All published articles of this journal are available on ScienceDirect.

Screening of Drought-Tolerant, Silicate-Solubilizing Bacteria and Their Efficacy in Enhancing the Growth and Yield of Rice under Water Stress
 Ali Kee Zuan Tan2
Zulkarami Berahim3
Hawa ZE Jaafar3
Authors Info & Affiliations
Abstract
Introduction
The beneficial impacts of silicate-solubilizing bacteria (SSB) on rice growth and yield under water stress remain poorly understood. Thus, this study was conducted to screen, identify, and evaluate the efficacy of drought-tolerant silicate bacteria in improving rice growth and yield under water deficit conditions.
Methods
Ten isolates were screened for their silicate-solubilizing capacity and their drought tolerance. A two-factor pot experiment was subsequently conducted in a glasshouse to evaluate the effects of SSB on rice growth and yield under both flooded and water deficit conditions. The water deficit condition was imposed using an alternate wetting and drying technique with water applied every 10 days from 35 to 105 days after sowing. The experiment was carried out in a randomized complete block design with four replications. The pot experiment included four bacterial inoculations and two soil conditions.
Results
In vitro assays identified Pseudomonas aeruginosa and Enterobacter sichuanensis as the most effective strains, exhibiting the highest levels of silicate solubilization and drought tolerance. In the pot experiment, the water deficit condition effectively induced physiological stress in rice, as evidenced by a reduction in relative water content (RWC) compared with the flooded condition. Treatments with E. sichuanensis and co-inoculation significantly increased plant height, relative water content, root length, SPAD value, and Si and lignin content in rice. Across both flooded and water-deficit conditions, the E. sichuanensis and co-inoculation treatments improved total grain yield by 9.25% and 12.88%, respectively, compared with the control.
Discussion
Notably, the E. sichuanensis and co-inoculation treatments enhanced Si uptake in rice regardless of water conditions, resulting in improved physiological attributes and yield components compared to the control.
Conclusion
These findings underscore the potential of E. sichuanensis and co-inoculation strategies to serve as biofertilizers to mitigate the impacts of water stress in rice and contribute to sustainable rice production. Further research is needed to validate their efficacy at the field scale and to optimize their formulation as biofertilizers.
1. INTRODUCTION
Rice (Oryza sativa L.) is a staple food for more than half of the global population. It contributes over 75% of dietary energy intake in several developing countries [1]. Unlike other staple crops, rice is particularly susceptible to water scarcity because of its high water requirements. Flooded rice cultivation under conventional practices typically demands from 1200 to 2000 mm of water per cropping cycle [2], whereas producing 1 kg of rice grain may require up to 2500 L of water [3]. A study by Yang et al. highlighted that exposure to drought during the flowering stage significantly disrupts rice physiology, leading to substantial yield losses [4]. Furthermore, the increasing global population is predicted to drive high demand for rice consumption in the coming years [5], and this challenge is compounded by climate change, which is intensifying water deficiency in crop production [6], further threatening global food security. Therefore, developing a sustainable and efficient strategy for rice production under water stress is essential.
Drought is a persistent natural hazard that poses substantial risks to ecosystems, agriculture, and human society. According to Mishra and Singh, drought occurrence is strongly influenced by climatic factors, including temperature, wind speed, relative humidity, and rainfall characteristics [7]. In developing countries, where livelihoods are highly dependent on agriculture, drought events frequently result in severe socio-economic impacts, including food insecurity, displacement, and increased risks of conflict [8]. Climate change is predicted to intensify the frequency and severity of drought globally [9], thereby impairing crop production and exacerbating the potential for food crises [10].
Silicon (Si) is recognized as a beneficial element that enhances plant drought tolerance by improving morphological and physiological traits [11]. In soil, Si predominantly exists as oxides and silicates bound to other elements [12], resulting in limited soluble Si available for plant uptake [13]. To address this limitation, Si fertilizers are commonly applied to increase soil soluble Si concentration, thereby alleviating drought stress in rice plants [14]. However, Si fertilizers are often expensive and supply limited concentrations of soluble Si for plant uptake [15]. Moreover, the use of these Si-based fertilizers can have adverse effects on soil health and the ecological system [16]. Thus, the application of conventional Si-based fertilizers should be replaced with a more sustainable and environmentally friendly approach for crop production.
Plant growth-promoting bacteria (PGPB) are beneficial bacteria that enhance plant growth [17]. Several studies have shown that PGPB have the capacity to convert insoluble nutrients in the soil into available forms for plant absorption [18-21]. Among these, silicate-solubilizing bacteria (SSB) have strong potential to enhance Si availability and may serve as effective biofertilizers for crops under abiotic stress, owing to their cost-effectiveness and environmental friendliness [22]. Nevertheless, the efficacy of SSB on rice growth and yield under water stress conditions remains unclear. This study hypothesizes that inoculation with drought-resilient SSB can enhance rice performance under water stress by improving silicon uptake. Therefore, this study aimed to screen, identify, and evaluate the effects of selected SSBs on rice growth and yield under both water-deficit and flooded conditions in response to drought stress.
2. MATERIALS AND METHODS
2.1. Experimental Site and Bacterial Preparation
The in vitro screening experiment for PGPB was conducted at the Microbiology Laboratory in the Department of Land Management, Faculty of Agriculture, Universiti Putra Malaysia. Ten bacterial strains for this experiment were collected from the Institute of Bioscience, Universiti Putra Malaysia. These isolates are listed in Table 1.
| Accession Number | Species | Source |
|---|---|---|
| UPMC 248 | Pseudomonas aeruginosa | Rice plants |
| UPMC 382 | Bacillus spp. | Aerobic rice |
| UPMC 383 | Bacillus spp. | Aerobic rice |
| UPMC 385 | Bacillus spp. | Aerobic rice |
| UPMC 386 | Bacillus spp. | Aerobic rice |
| UPMC 1340 | Enterobacter spp. | Soil |
| UPMC 1341 | Enterobacter spp. | Soil |
| UPMC 1342 | Enterobacter spp. | Soil |
| UPMC 1446 | Bacillus spp. | Oil palm |
| UPMC 1449 | Bacillus spp. | Rice roots |
2.2. Silicate Solubilizing Capacity, Drought Tolerance, and Bacterial Identification on PGPB
The ability of PGPB to solubilize silicate was assessed through plate and liquid assays. The plate assay was conducted using magnesium trisilicate agar, including insoluble magnesium trisilicate (Combi-Blocks, cat. no. COMH97E3391C) 2.5 g, glucose 10 g, agar 20 g, and distilled water 1000 mL as described by Vasanthi et al. [23]. After 4-day incubation at 30°C ± 1, the solubilization index (SI) was calculated by using the formula (1):
Liquid assays were carried out using a basal medium containing glucose (Millipore, cat. no. 49159, ≥ 99%) 10 g, (NH4)2SO4 (Sigma-Aldrich, cat. no. A4915, ACS reagent, ≥ 99%) 1 g, MgSO4 (Sigma-Aldrich, cat. no. 203726, ≥ 99% trace metals basis) 0.2 g, KCl (Sigma-Aldrich, cat. no. 204099, ≥ 99% trace metals basis) 0.2 g, K2HPO4 (Sigma-Aldrich, cat. no. P3786, ACS reagent, ≥ 98%) 0.1 g, calcium silicate (Sigma-Aldrich, cat. no. 372668, -200 mesh, ≥ 90%) 0.25 g, and distilled water 1000 mL [24]. After inoculating bacteria into the basal medium, Si concentration was recorded by Inductively Coupled Plasma Optical Emission Spectrometry (Optima 2000DV, Perkin Elmer Instruments, USA) at 5 and 10 days of incubation (DAI).
Drought-tolerant strains were determined by inoculating bacterial suspension into Tryptic Soy Broth (TSB; Millipore, cat. no. 22092) with different concentrations of polyethylene glycol 6000 (PEG-6000, Molecular Biology Grade, Sigma-Aldrich, cat. no. 528877) corresponding to osmotic potentials of 0, -0.25, -0.5, -0.75, and -1.25 MPa derived from these PEG concentrations [25]. Bacterial isolates exhibiting an increase in optical density (OD) after 48 hours of incubation were classified as drought-tolerant strains.
Selected strains were sent to Apical Scientific Sdn Bhd for bacterial identification. The bacterial full-length 16S gene (~1500 bp) was amplified using the universal primers 27F and 1492R. The total reaction volume of 25 μl contained gDNA purified using an in-house optimized protocol, 0.3 pmol of each primer, deoxynucleotide triphosphates (dNTPs, 400 μM each), 0.5 U of thermostable DNA polymerase, supplied PCR buffer, and water. The PCR was performed as follows: 1 cycle (94°C for 2 min) for initial denaturation; 25 cycles (98°C for 10 sec; 53°C for 30 sec; 68°C for 1 min) for denaturation, annealing, and extension. The PCR products were purified by the standard PCR clean-up method. The purified PCR products were subjected to bidirectional sequencing with universal primers 785F and 907R using BigDye® Terminator v3.1 Cycle Sequencing Kit (Applied Biosystems).
2.3. Pot Experiment
Following the in vitro screening of PGPB, the two different strains with the best performance were selected to evaluate their efficacy on rice plants in a pot experiment conducted at Field 15, Faculty of Agriculture, Universiti Putra Malaysia. During this period, the actual measured temperature and relative humidity ranged from 29-33 °C and 79-81%, respectively. This experiment was arranged in a randomized complete block design with two factors and four replications. The first factor consisted of two water regimes: water deficit and flooded conditions. The second factor included four bacterial inoculation treatments: (i) control (no inoculation), (ii) inoculation with Pseudomonas aeruginosa, (iii) inoculation with Enterobacter sichuanensis, and (iv) co-inoculation.
The soil used in the pot experiment was collected from the Padi Transformation IR 4.0 Research Station (5.962913°N,102.287910°E) located in Kampung Padang Raja, Ketereh, Kelantan. This site is located in a major rice-producing region of Peninsular Malaysia, which is highly vulnerable to seasonal water scarcity. The region undergoes a pronounced dry period characterized by elevated temperatures [26]. Soil was collected from a paddy field at a depth of 0–30 cm in accordance with local agricultural guidelines. No formal permits were required for the collection. Subsequently, the soil was air-dried, cleaned of residues, sieved, and mixed. After that, a soil analysis was performed to determine soil properties, including pH, number of SSB, and available nutrients, including organic carbon, total nitrogen, available phosphorus, soluble Si, potassium, calcium, magnesium, and sodium. The soil properties were summarized in Table 2.
| Soil properties | Analysis results |
|---|---|
| pH | 6.5 |
| Organic carbon | 0.38% |
| Total nitrogen | 0.04% |
| Available phosphorus | 42 ppm |
| Soluble Si | 1.72 mg kg-1 |
| Potassium | 0.05 meq/100g |
| Calcium | 1.67 meq/100g |
| Magnesium | 0.26 meq/100g |
| Sodium | 0.16 meq/100g |
Subsequently, 15 kg of soil was placed into individual pots (38.5 cm height x 34.5 cm diameter), which were then filled with water and left for 14 days prior to rice transplanting. The rice variety MR297 used in this study was obtained from the Department of Agriculture (DOA), Malaysia. Next, germinated seeds were sown into 200-cell trays filled with peat moss as the growth medium. Three rice seedlings were transplanted into each pot at a depth of approximately 1 cm.
For bacterial inoculation, cells were harvested by centrifugation at 8000 rpm, the supernatant removed, and the pellet resuspended in sterile distilled water. Seedlings were inoculated with inoculum at 15 days after sowing (DAS) by submerging their roots in bacterial solution (108 CFU mL-1) for 30 minutes [27], while sterile distilled water was used for the control treatment. Then, the inoculated seedlings were transplanted into the pots. Re-inoculation was performed at 45 DAS by pouring the bacterial inoculum (108 CFU mL-1) near the root zone [28].
Fertilizer application was carried out in accordance with standard agronomic guidelines established by the Malaysian Agricultural Research and Development Institute. Fertilizers were applied in splits at 7, 30, 50, and 70 days after transplanting (DAT). Fertilizers were applied at different growth stages according to the recommended application schedule. At 7 days after transplanting (DAT), 140 kg ha−1 NPK (17:20:10), 57 kg ha−1 triple superphosphate (TSP; 46% P2O5), and 42 kg ha−1 muriate of potash (MOP; 60% K2O) were applied. At 30 DAT, 80 kg ha−1 urea (46% N) was applied. At 50 DAT, a combination of 12 kg ha−1 urea, 100 kg ha−1 NPK (17:20:20), and 100 kg ha−1 NPK (17:3:25 + 2MgO) was applied. At 70 DAT, 50 kg ha−1 NPK (17:3:25 + 2MgO) and 20 kg ha−1 urea (46% N) were applied. In addition, calcium silicate (Sigma-Aldrich, Cat. No. 372668, −200 mesh, ≥90%) was applied as a silicon source at a rate of 100 kg ha−1 during basal fertilizer application [22].
The water deficit condition was initiated at 35 DAS by withholding irrigation to establish an intermittent wetting-and-drying cycle [29]. Rice plants under water-deficit conditions were irrigated at 10-day intervals (35, 45, 55, 65, 75, 85, 95, and 105 DAS) with a 5 cm water level above the soil surface, allowing the soil to progressively dry between irrigation periods. The imposed water deficit condition was biologically validated by a marked reduction in RWC compared to plants maintained under continuous flooding. Rice plants under flooded conditions were continuously maintained at a 5 cm water level above the soil surface throughout the experiment.
2.4. Soil Measurement
A 1-gram soil sample was taken and transferred into a conical flask containing 99 mL of phosphate buffer, then shaken for 1 hour under laboratory conditions. Subsequently, 100 μL of 10-2 and 10-3 dilutions were inoculated onto magnesium trisilicate agar medium and incubated at 30°C ± 1 for 24–36 hours [30]. The number of SSB was determined by counting bacterial colonies with halo zones.
Si concentration in soil at 60, 90, and 120 DAS was measured using the method described by Pereira et al. [31]. A 10-gram soil sample was mixed with 50 mL of Na2CO3 (10 g/L; Sigma-Aldrich, cat. no. S7795, BioXtra, ≥ 99%) and 50 mL of NH4NO3 (16 g/L; Sigma-Aldrich, cat. no. 221244, ACS reagent, ≥ 98%). The mixture was shaken at 60 rpm for an hour and subsequently left to stand at room temperature for 5 days. Then, the Molybdenum Blue Colorimetric method was applied to determine the Si concentration in the sample solution [32]. A 1 mL soil solution aliquot was combined with 2.5 mL of 20% ammonium acetate (Sigma-Aldrich, cat. no. 238074, ACS reagent, ≥ 97%) and 1 mL of 0.3 M ammonium molybdate (Sigma-Aldrich, cat. no. A7302, ACS reagent, 81.0 – 83.0% MoO3 basis) in a 50 mL microcentrifuge tube and vortexed. After standing for 5 min, 0.5 mL of 20% tartaric acid (Sigma-Aldrich, cat. no. 251380, ACS reagent grade, ≥ 99.5%), 2 mL of 20% acetic acid (Sigma-Aldrich, cat. no. 695092, glacial, ACS reagent, ≥ 99.7%), and 0.5 mL of reducing solution consisting of 2 g Na2SO3 (Sigma-Aldrich, cat. no. 239321, ACS reagent, ≥ 98.0%), 0.4 g C10H9NO4S (Sigma-Aldrich, cat. no. 398969, ACS reagent, ≥ 90%) 25 g NaHSO3 (Sigma-Aldrich, cat. no. 243973, ACS reagent), and 250 mL H2O were added. The solution was left at ambient temperature for 1 hour before spectrophotometric analysis at 815 nm (Thermo Scientific Multiskan GO, USA).
2.5. Growth Traits
At 90 DAS, plant height (cm) was measured from the base of the stem to the tip of the highest leaf blade. The flag leaf was subjected to the measurement of leaf area, with length (cm) recorded from tip to base at the panicle sheath and width (cm) measured at the midpoint. The RWC in the flag leaf was assessed according to the procedure of Slatyer and Barrs [33]. To measure root length, rice roots were spread in acrylic trays filled with distilled water to minimize overlap, scanned with an Epson V700, and analyzed for length using WinRHIZO root-scanning software (Regent Instruments Inc., Ottawa, ON, Canada).
2.6. Biochemical Traits
A MINOLTA™ SPAD-502 Plus (Konica Minolta Optics, Japan) was employed to measure SPAD values on the topmost fully expanded leaf at 60 and 90 DAS. In addition, lignin content in rice tissue was determined using the method described by Suzuki et al. [34].
The protocol of Wei-min et al. was used to quantify Si content in rice stems at the harvest stage [35]. Briefly, rice stems were oven-dried at 70°C to constant weight, then ground and sieved to a particle size of 0.5 mm. Next, a 0.1 g sample was added to a 50 mL Falcon tube containing 3 mL of 50% NaOH (Sigma-Aldrich, cat. no. 221465, ACS reagent, ≥ 97.0%) and autoclaved at 120°C for 20 minutes at 15 psi, after which 50 mL of distilled water was added. Subsequently, the Molybdenum Blue Colorimetric method was utilized to determine the Si concentration in the sample solution [32].
2.7. Yield Components
Yield traits included panicle numbers pot-1, 1000-grain weight by weighing 1000 filled grains pot-1, filled grains panicle-1 by counting filled grains from 5 panicles pot-1, filled grain ratio by dividing total filled grains by total grains, and total grain weight pot-1 by weighing all grains pot-1.
2.8. Data Analysis
All data on rice plant development and biochemical characteristics were statistically analyzed using analysis of variance (ANOVA) in RStudio (version 2023.12.1+402; Posit, Boston, Massachusetts, USA). Treatment means were compared using the Least Significant Difference (LSD) test at a 0.05% significance level, and the tests were performed in four replications. Assumptions of normality and homogeneity of variance were verified for all datasets. For soil Si data, these assessments were conducted across all sampling stages (60, 90, and 120 DAS) to account for the inherent biological variability of rhizosphere-based experiments. Microsoft Excel was employed to generate graphical presentations.
3. RESULTS
3.1. Silicate Solubilization
No significant differences in SI were observed among UPMC 382, 383, 385, 386, 1446, and 1449. UPMC 248 (1.32) showed a higher SI than UPMC 382 and 386 (1.13-1.14) but did not differ from UPMC 383, 385, 1446, and 1449 (1.21-1.24). However, the highest SI values were recorded in UPMC 1340, 1341, and 1342 (1.80-1.86) (Table 3). In the liquid assay at 5 DAI, UPMC 248, 386, 1340, 1341, 1342, 1446, and 1449 (71.39-75.29 mg L-1) showed significantly higher silicon solubilization than the control (68.93 mg L-1). In contrast, all bacterial isolates (80.34-91.04 mg L-1) had significantly greater Si concentration than the control (78.71 mg L-1) at 10 DAI, except for UPMC 382 (80.28 mg L-1).
| Treatment | Solubilization Index (SI) | Si Concentration (mg L-1) | |
|---|---|---|---|
| 5 DAI | 10 DAI | ||
| Control | - | 68.93d (67.68, 70.19) | 78.71d (77.58, 79.83) |
| UPMC 248 | 1.32b (1.22, 1.42) | 72.55b (71.29, 73.80) | 82.20b (81.07, 83.32) |
| UPMC 382 | 1.13c (1.03, 1.23) | 69.02d (67.76, 70.27) | 80.28cd (79.16, 81.41) |
| UPMC 383 | 1.22bc (1.12, 1.32) | 70.06cd (68.81, 71.32) | 81.42bc (80.30, 82.55) |
| UPMC 385 | 1.21bc (1.11, 1.31) | 69.31d (68.06, 70.57) | 80.34c (79.22, 81.46) |
| UPMC 386 | 1.14c (1.04, 1.24) | 71.78bc (70.52, 73.03) | 81.48bc (80.35, 82.60) |
| UPMC 1340 | 1.80a (1.70, 1.90) | 72.93b (71.68, 74. 19) | 90.77a (89.65, 91.90) |
| UPMC 1341 | 1.86a (1.76, 1.96) | 75.07a (73.82, 76.33) | 91.04a (89.92, 92.17) |
| UPMC 1342 | 1.83a (1.73, 1.93) | 75.29a (74.04, 76.55) | 90.46a (89.34, 91.58) |
| UPMC 1446 | 1.22bc (1.12, 1.32) | 71.39bc (70.14, 72.65) | 80.55c (79.43, 81.67) |
| UPMC 1449 | 1.24bc (1.14, 1.34) | 71.60bc (70.35, 72.86) | 81.18bc (80.06, 82.31) |
| F | 40.35*** | 13.77*** | 77.92*** |
| CV (%) | 5.86 | 1.40 | 1.08 |
3.2. In vitro Drought Evaluation
Addition of PEG-6000 to the TSB medium inhibited the growth and survival of bacterial strains (Fig. 1). All bacteria grew well at -0.25 MPa, whereas growth was inhibited at -0.5 MPa, reducing the number of isolates to seven. At lower water potential (-0.75 and -1.25 MPa), only six isolates (UPMC 248, 386, 383, 1340, 1341, and 1342) remained viable.
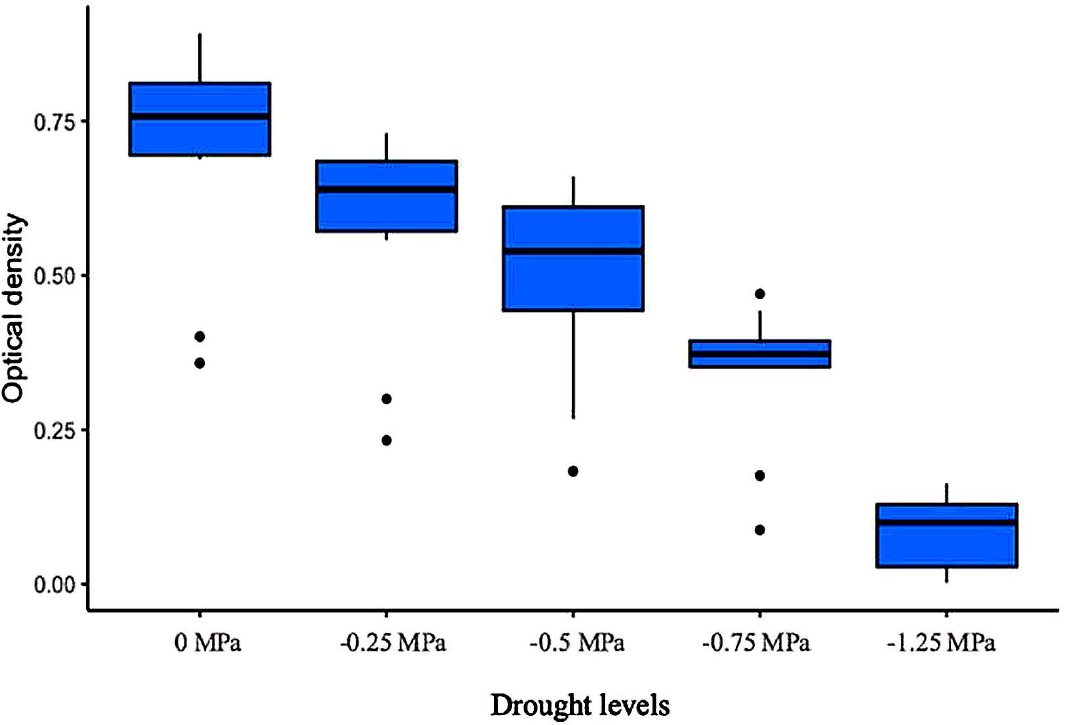
Optical density of ten isolates on in-vitro drought treatment at five different water potentials. Box plot showing the optical density (OD600) of ten silicate-solubilizing bacteria after 48 h incubation under five drought stress levels such as 0, -0.25, -0.5, -0.75, and -1.25 MPa. The boxes indicate the interquartile range, the horizonal line denotes the median, whisk extend to the minimum and maximum values, and dots represent outliers.
3.3. Bacterial Identification based on Full-length 16S rDNA Gene Sequence
Phylogenetic analysis using sequences retrieved from the National Center for Biotechnology Information (NCBI) revealed that approximately 1473 bp were sequenced for UPMC 1340, UPMC 1341, and UPMC 1342 (Fig. 2). The gene sequence results were searched on the Basic Local Alignment Search Tool, which demonstrated 99.73% sequence similarity between these isolates and Enterobacter sichuanensis (accession number NR_179946.1). To avoid potential overlap in effects, two distinct strains (UPMC 248 and 1341) were chosen for the pot experiment.
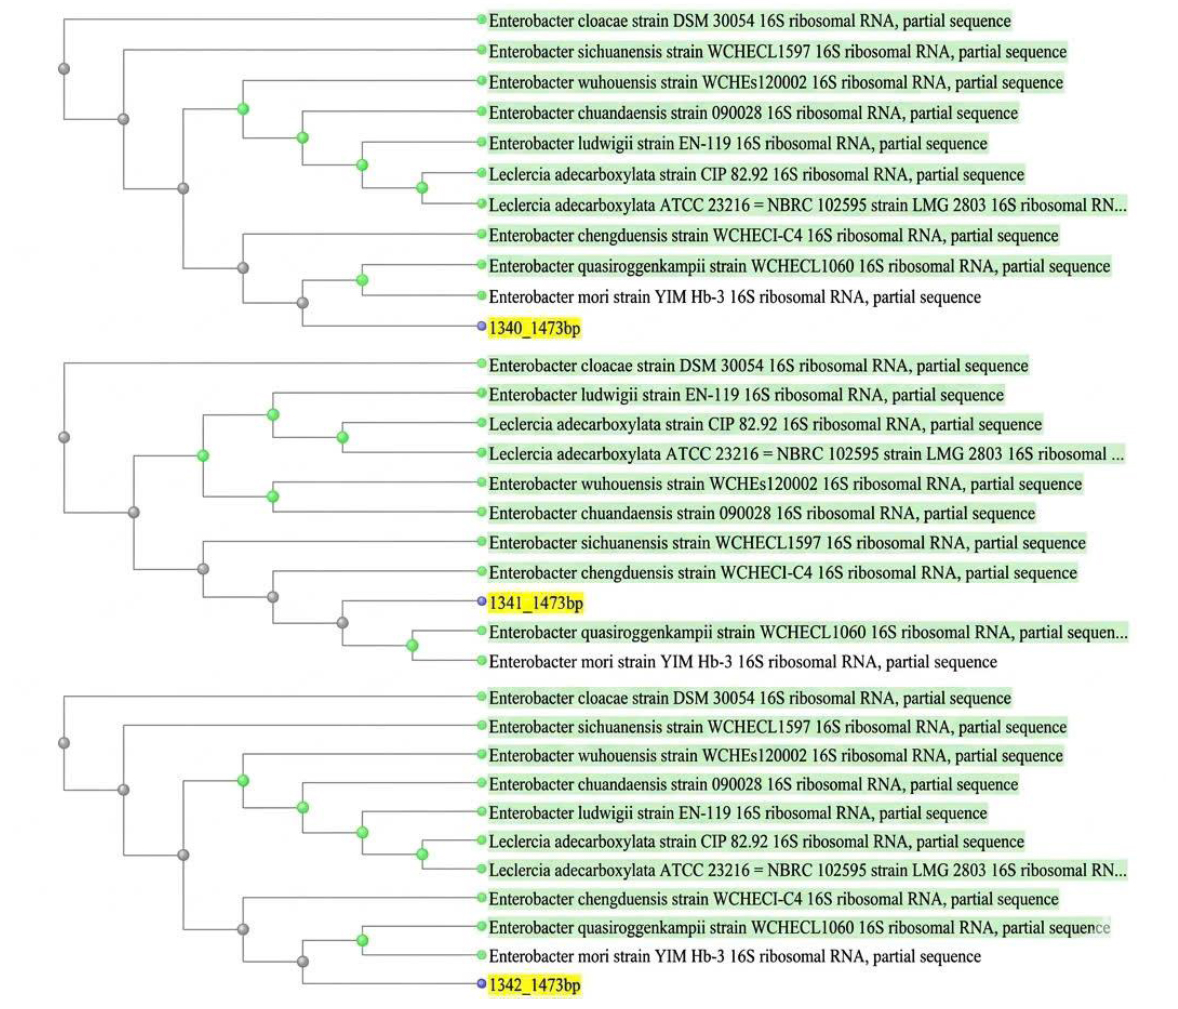
Phylogenetic tree based on 16S rRNA gene sequences indicating the relationship of three isolates UPMC 1340, UPMC 1341, and UPMC 1342 to closely related isolates. Bar denotes the nucleotide divergence value.
3.4. Soil Measurement
Table 4 showed no significant interaction in the number of SSB in soil between bacterial inoculations and water conditions at any of the examined stages in rice plants. The number of SSB in the E. sichuanensis and co-inoculation treatment was significantly higher than the control at 60 DAS, whereas only the co-inoculation showed a higher density of SSB than the control at 90 DAS. However, the number of SSB across all treatments did not differ significantly at 120 DAS. Compared with flooded conditions, the number of SSB under water-deficit conditions was significantly lower at 60 and 90 DAS. In contrast, water deficit conditions (3.93 log10CFU g-1 soil) showed a significantly higher number of SSB than flooded conditions (3.58 log10CFU g-1 soil) at 120 DAS.
| Treatment | DF |
Number of SSB in soil (log10CFU g-1 soil) |
|||
|---|---|---|---|---|---|
| 0 DAS | 60 DAS | 90 DAS | 120 DAS | ||
| Types of bacteria inoculation (A) | - | - | - | - | |
| Control | - | 3.30 | 3.69c (3.52, 3.87) | 3.61b (3.37, 3.85) | 3.60a (3.25, 3.94) |
| P. aeruginosa | - | 3.30 | 3.93bc (3.75, 4.11) | 3.86ab (3.62, 4.10) | 3.74a (3.39, 4.09) |
| E. sichuanensis | - | 3.30 | 4.03b (3.86, 4.21) | 3.71b (3.47, 4.00) | 3.76a (3.41, 4.11) |
| Co-inoculation | - | 3.30 | 4.36a (4.19, 4.54) | 4.10a (3.85, 4.34) | 3.91a (3.56, 4.26) |
| Water conditions (B) | - | - | - | - | - |
| Water deficit | - | 3.30 | 3.78b (3.66, 3.91) | 3.69b (3.51, 3.86) | 3.93a (3.68, 4.17) |
| Flooded | - | 3.30 | 4.23a (4.10, 4.36) | 3.95a (3.78, 4.13) | 3.58b (3.33, 3.82) |
| F (A) | 3 | ns | 10.43*** | 3.28* | 0.59ns |
| F (B) | 1 | ns | 26.93*** | 5.26* | 4.41* |
| F (AxB) | 3 | ns | 0.21ns | 1.22ns | 0.21ns |
| CV (%) | - | 0.00 | 6.12 | 8.68 | 12.51 |
Soluble Si in soil showed no interaction effects between bacterial inoculations and water conditions in any sampling period (Table 5). The co-inoculation treatment showed significantly higher soluble Si levels than the control at all examined stages. Compared to the control, the P. aeruginosa treatment significantly increased soluble Si at 60 and 120 DAS, but the E. sichuanensis treatment showed no significant effects at any sampling time. Regarding water conditions, soluble Si in the flooded condition (7.83 mg kg-1) was significantly higher than in the water-deficit condition (4.42 mg kg-1) at 60 DAS. Nevertheless, no significant difference in soluble Si concentration was recorded in the water conditions at 90 and 120 DAS.
| Treatment | DF | Soluble Si concentration in soil (mg kg-1) | |||
|---|---|---|---|---|---|
| 0 DAS | 60 DAS | 90 DAS | 120 DAS | ||
| Types of bacteria inoculation (A) | - | - | - | - | |
| Control | 1.72 | 3.13b (0.65, 5.62) | 1.01b (-0.14, 2.16) | 1.75c (-0.41, 3.92) | |
| P. aeruginosa | 1.72 | 7.28a (4.79, 9.76) | 2.29ab (1.13, 3.44) | 5.70ab (3.54, 7.86) | |
| E. sichuanensis | 1.72 | 5.46ab (2.97, 7.94) | 2.00ab (0.84, 3.15) | 3.45bc (1.29, 5.62) | |
| Co-inoculation | 1.72 | 8.64a (6.15, 11.13) | 3.50a (2.35, 4.65) | 6.62a (4.46, 8.79) | |
| Water conditions (B) | - | - | - | - | |
| Water deficit | 1.72 | 4.42b (2.66, 6.18) | 2.00a (1.18, 2.81) | 5.11a (3.58, 6.64) | |
| Flooded | 1.72 | 7.83a (6.07, 9.59) | 2.40a (1.58, 3.21) | 3.66a (2.13, 5.19) | |
| F (A) | 3 | ns | 3.97* | 3.41* | 4.48* |
| F (B) | 1 | ns | 8.10** | 0.53ns | 1.94ns |
| F (AxB) | 3 | ns | 0.53ns | 1.17ns | 0.34ns |
| CV (%) | 0.00 | 55.24 | 71.39 | 67.19 | |
3.5. Growth and Biochemical Attributes
The interactions between two factors were not significant in plant height, leaf area, SPAD values, lignin, and Si content, except for RWC and root length (Tables 6 and 7). Compared to the control, the bacterial treatments improved plant height, leaf area, RWC, root length, SPAD values, lignin, and Si content. The plant height in the co-inoculation treatment was comparable to that of the E. sichuanensis treatment and greater than that of the P. aeruginosa treatment. For the leaf area, there were no differences among the bacterial treatments. However, the greatest RWC was observed in the co-inoculation treatment, followed by the E. sichuanensis and P. aeruginosa treatments. The root length in the co-inoculation treatment was significantly higher than that of the P. aeruginosa treatment, but not different from the E. sichuanensis treatment. Additionally, SPAD values in the co-inoculation treatment were equivalent to those in the single E. sichuanensis treatment and greater than those in the control. The SSB treatments increased lignin content by 3.5-9.03% and Si content by 22.82-42.72% relative to the control. Water-deficit conditions significantly reduced plant height, leaf area, RWC, root length, and SPAD values. On the contrary, lignin content in water-deficit conditions did not differ from that in flooded conditions, whereas water-deficit conditions ameliorated Si content compared to flooded conditions.
| Treatment | DF |
Plant height (cm) |
Leaf area (cm2) |
RWC (%) | Root length (m) |
|---|---|---|---|---|---|
| Types of bacteria inoculation (A) | - | - | |||
| Control | - | 38.27c (37.53, 39.00) | 28.81b (26.9, 30.72) | 41.16d (38.57, 43.74) | 113.35c (103.51, 123.20) |
| P. aeruginosa | - | 38.95bc (38.22, 39.68) | 30.30ab (28.39, 32.21) | 46.84c (44.26, 49.42) | 136.02b (126.17, 145.86) |
| E. sichuanensis | - | 39.35ab (38.62, 40.08) | 3 1.33ab (29.42, 33.24) | 55.24b (52.66, 57.82) | 147.34ab (137.49, 157.18) |
| Co-inoculation | - | 40.06a (39.33, 40.80) | 32.74a (30.83, 34.65) | 60.17a (57.58, 62.75) | 159.32a (149.48, 169.16) |
|
Water conditions (B) |
- | - | - | - | - |
| Water deficit | - | 36.06b (35.54, 36.58) | 27.66b (26.31, 29.01) | 45.82b (44.00, 47.64) | 111.22b (104.26, 118.18) |
| Flooded | - | 42.25a (41.73, 42.77) | 33.93a (32.58, 35.28) | 55.88a (54.05, 57.70) | 166.79a (159.83, 173.75) |
| F (A) | 3 | 4.53* | 3.26* | 46.78*** | 17.09*** |
| F (B) | 1 | 307.60*** | 46.71*** | 65.70*** | 137.81*** |
| F (AxB) | 3 | 0.51ns | 0.25ns | 3.50* | 6.78** |
| CV (%) | - | 2.55 | 8.43 | 6.90 | 9.63 |
| Treatment | DF | SPAD Values |
Lignin content (mg g-1) |
Si content (mg g-1) |
|---|---|---|---|---|
| Types of bacteria inoculation (A) | - | - | - | - |
| Control | - | 46.15c (45.37, 46.94) | 17.83c (17.41, 18.24) | 2.06c (1.87, 2.26) |
| P. aeruginosa | - | 47.02bc (46.24, 47.81) | 18.47b (18.05, 18.89) | 2.53b (2.33, 2.72) |
| E. sichuanensis | - | 47.41ab (46.62, 48.19) | 19.05ab (18.63, 19.46) | 2.57b (2.37, 2.76) |
| Co-inoculation | - | 48.18a (47.40, 48.97) | 19.44a (19.03, 19.86) | 2.94a (2.74, 3.13) |
| Water conditions (B) | - | - | - | - |
| Water deficit | - | 46.38b (45.82, 46.93) | 18.85a (18.56, 19.15) | 2.88a (2.74, 3.02) |
| Flooded | - | 48.01a (47.45, 48.56) | 18.54a (18.24, 18.83) | 2.17b (2.03, 2.31) |
| F (A) | 3 | 5.00** | 12.35*** | 14.65*** |
| F (B) | 1 | 18.74*** | 2.49ns | 57.32*** |
| F (AxB) | 3 | 0.05ns | 1.63ns | 0.75ns |
| CV (%) | - | 2.26 | 3.03 | 10.50 |
In addition, the interaction between the two factors significantly affected RWC and root length. Significant differences in RWC between flooded and water deficit conditions were recorded in the single inoculations, but the co-inoculation treatment increased that of water deficit conditions, resulting in non-significant differences between flooded and water deficit conditions (Fig. 3). Rice plants under flooded conditions exhibited significantly longer roots compared to those under water deficit conditions across all SSB treatments (Fig. 4).
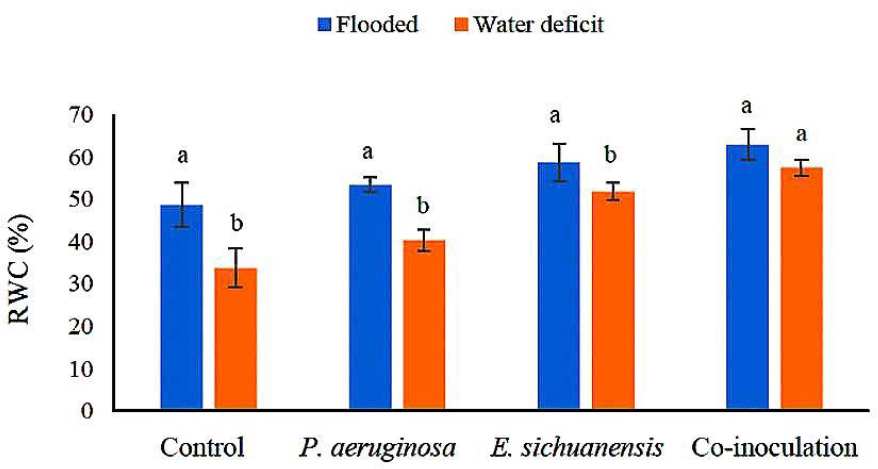
Effect of bacterial inoculation on relative water content of rice plants. Relative water content (RWC) of rice plants under flooded and water deficit conditions with four bacterial inoculations (control, P. aeruginosa, E. sichuanesis, and co-inoculation). Error bars indicate the standard error of the mean (n=4). Columns marked with different letters differ significantly at the 5% probability level.
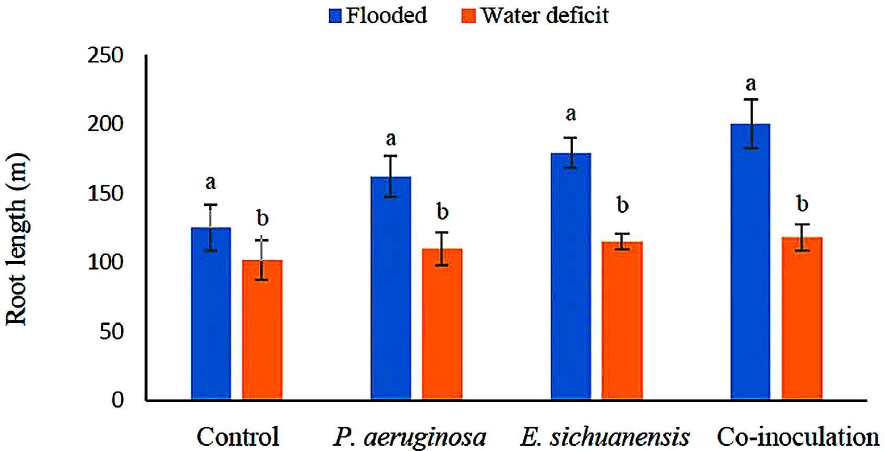
Effect of bacterial inoculation on root length of rice plants. Root length of rice plants under flooded and water deficit conditions with four bacterial inoculations (control, P. aeruginosa, E. sichuanesis, and co-inoculation). Error bars indicate the standard error of the mean (n=4). Columns marked with different letters differ significantly at the 1% probability level.
3.6. Yield Components
There were no significant interactions between the two factors for all yield components (Table 8). The SSB treatments did not significantly affect panicle number in pot-1 or 1000-grain weight compared to the control. Filled grain panicle-1 in the E. sichuanensis and co-inoculation treatments (116.58-117.34) was significantly higher than the control (104.36). Only the E. sichuanensis treatment showed a higher filled-grain percentage than the control. The total grain yield in the P. aeruginosa treatment was equivalent to that of both the control and other bacterial treatments. However, the E. sichuanensis and co-inoculation treatments increased the total grain yield by 9.25-12.88% compared to the control.
| Treatment | DF | Panicle number pot-1 | 1000-grain weight (g) | Filled grains panicle-1 | Filled grain percentage (%) | Total grain yield (g pot-1) |
|---|---|---|---|---|---|---|
| Types of bacteria inoculation (A) | - | - | - | - | ||
| Control | 43.75a (41.20, 46.30) | 21.56a (21.07, 22.05) | 104.36c (99.38, 109.34) | 63.11b (61.00, 65.21) | 92.19b (86.34, 98.04) | |
| P. aeruginosa | 47.25a (44.70, 49.80) | 21.69a (21.20, 22.18) | 109.57bc (104.59, 114.55) | 63.50b (61.39, 65.60) | 96.54ab (90.69, 102.39) | |
| E. sichuanensis | 45.63a (43.08, 48.17) | 21.82a (21.34, 22.31) | 116.58ab (111.60, 121.56) | 66.67a (64.57, 68.78) | 100.72a (94.87, 106.57) | |
| Co-inoculation | 47.13a (44.58, 49.67) | 22.23a (21.75, 22.72) | 117.34a (112.36, 122.33) | 66.05ab (63.94, 68.15) | 104.06a (98.21, 109.91) | |
| Water conditions (B) | - | - | - | - | ||
| Water deficit | 49.50a (47.70, 51.30) | 20.91b (20.57, 21.26) | 75.62b (72.10, 79.14) | 52.56b (51.07, 54.05) | 68.38b (64.25, 72.52) | |
| Flooded | 42.38b (40.57, 44.18) | 22.74a (22.40, 23.09) | 148.30a (144.78, 151.83) | 77.11a (75.62, 78.60) | 128.37a (124.23, 132.51) | |
| F (A) | 3 | 1.78ns | 1.55ns | 6.61** | 3.13* | 3.35* |
| F (B) | 1 | 33.79*** | 60.92*** | 920.48*** | 587.19*** | 454.83*** |
| F (AxB) | 3 | 0.31ns | 0.50ns | 1.08ns | 0.32ns | 0.28ns |
| CV (%) | 7.55 | 3.04 | 6.05 | 4.42 | 8.09 |
For water conditions, water deficit conditions significantly reduced 1000-grain weight, filled grains panicle-1, filled grain percentage, and total grain yield, except for panicle number pot-1. Compared to flooded conditions, water-deficit conditions reduced the number of panicles per pot-1 by 14.38%.
4. DISCUSSION
Among the ten bacterial isolates, UPMC 1340, 1341, and 1342 exhibited the highest solubilization activity, followed closely by UPMC 248 (Table 3). In fact, solubilizing minerals by bacteria predominantly occurs via mechanisms involving the production of organic acids [36]. Reportedly, these solubilization bacteria may produce organic acids that promote a decrease in pH and facilitate ligand attack on cationic sites, thereby breaking Al-O-Si or Mg-, Ca-, or MgO-Si bonds, while Si-O-Si linkages in quartz or amorphous silica are mainly disrupted by proton or hydroxyl ion polarization [37-39]. This assumption is strongly supported by a study by Pastore et al., who reported a negative correlation between pH and dissolved silicate concentration, whereas the amount of organic acid produced by soil bacteria was positively related to the rate of silicate solubilization [39]. Although the value of pH was not measured in the present study, the superior performance of UPMC 248, 1340, 1341, and 1342, compared to other isolates, suggests that they might produce higher amounts of organic acids to facilitate the dissolution of silicate minerals, thereby exhibiting strong potential as inoculants for enhancing available Si in soil.
Drought conditions not only impair plant growth but also influence the composition and activity of the surrounding microbial community. Hence, it is understandable that bacterial diversity can be negatively impacted by water deficiency. As shown in (Fig. 1), increasing drought stress led to a decline in the overall bacterial population. Despite this, drought tolerance was observed in six of the ten bacterial isolates tested, including UPMC 248, 386, 383, 1340, 1341, and 1342. According to Abdelaal et al., bacterial isolates subjected to drought stress tend to produce higher levels of exopolysaccharides that play a critical role in protecting bacterial cells and enhancing their survival in water-limited environments [40]. As described by Forni et al., this mechanism involves exopolysaccharides that form hydrophilic biofilms to retain moisture around bacterial cells, thereby protecting them from desiccation [41]. The drought tolerance of the six isolates suggests their potential to improve plant growth under water-stress conditions.
Identification based on 16S rDNA gene sequencing revealed that all three isolates showed the highest sequence similarity to Enterobacter sichuanensis, as determined through comparison with the NCBI database. Several studies have indicated that the genus Enterobacter is considered a PGPB, as it exhibits plant growth-promoting traits [42, 43]. Chhetri et al. found that E. sichuanensis can serve as a promising biofertilizer to promote plant growth [44]. In our study, the superior silicate-solubilizing performance of these E. sichuanensis strains may indicate a highly efficient metabolic capacity for the production of organic acids [36]. Through the organic acid-mediated solubilization mechanism discussed earlier, these strains have been reported to mobilize Si from recalcitrant silicate minerals by converting it into plant-available monosilicic acid [16], improving Si availability in the rhizosphere and supporting their potential as effective microbial inoculants.
SSB are recognized as beneficial isolates that possess the ability to convert insoluble silicates in the soil to accessible forms for plant absorption. It is well established that organic acid production by SSB releases H+ ions, which promote cation exchange at the mineral surface by replacing cations in the silicate structure [15], leading to the release of soluble Si in the soil. According to Raturi et al., increased Si availability in the rhizosphere enhances Si uptake in plant tissue [16]. The present study is consistent with previous studies, as rice plants treated with bacterial treatments showed higher Si uptake than the control (Table 7). In contrast to the typical pattern in which elevated soil-soluble Si persists, inoculation with E. sichuanensis did not significantly increase soil-soluble Si concentrations at any examined stage relative to the control (Table 5), while significantly increasing Si content in rice plants (Table 7). This pattern may be explained by rapid, direct coupling between soil Si availability and plant uptake. Although E. sichuanensis continuously maintained silicate solubilization throughout the growth stages, rice is a strong silicon-accumulating crop [15], which may promote rapid root uptake of the released Si and limit the accumulation of soluble Si in the soil [45]. The Si accumulation observed in the control can be attributed to the baseline pool of native soluble Si and indigenous SSB naturally present in the soil. As an efficient silicon accumulator, rice plants absorb this available Si supply [46]. In addition, the deposition of Si following root absorption is a critical factor under water stress. Irfan et al. highlighted that Si can improve stem rigidity under water scarcity [47]. To evaluate the role of Si uptake on stem strength, lignin content, which is a vital contributor to plant rigidity [48], was measured in the present study. The SSB treatments that increased Si absorption in rice tissue led to higher lignin content than the control (Table 7). Evidence indicated that the increased uptake of Si ameliorated stem strength through stimulating lignin accumulation in herbaceous peony [49]. The current finding advances the understanding of the role of SSB inoculation in enhancing rice cell wall rigidity under water stress by promoting lignin biosynthesis. The elevated lignin accumulation may be attributed to greater bioavailability of monosilicic acid (H4SiO4), which enhances the phenylpropanoid pathway by upregulating enzymes, such as phenylalanine ammonia-lyase (PAL), while silica deposition within the cell wall matrix reinforces rice stem structure, increasing mechanical strength under drought stress [50, 51]. This structural reinforcement underscores a crucial Si–drought interaction, where enhanced lignification and cell wall silicification may help maintain stem rigidity, enabling inoculated rice plants to tolerate physical stress and prevent vascular collapse under water scarcity [52].
Previous studies have shown that Si plays an integral role in improving growth and physiological traits in rice [53, 54]. In this study, although all SSB treatments significantly increased Si uptake in rice compared to the control, the E. sichuanensis and co-inoculation treatments significantly improved growth and physiological parameters, such as plant height, RWC, root length, and SPAD values, compared to the control (Tables 6 and 7). Notably, only the co-inoculation treatments significantly increased leaf area, and the E. sichuanensis treatment was equivalent to the control. This suggests that Si benefits depend on effective utilization rather than uptake alone, with co-inoculation likely stimulating root development, photosynthesis, and nutrient acquisition through synergistic interactions, whereas single inoculations, despite increasing Si uptake, were insufficient to promote leaf expansion. For yield components, rice plants in the E. sichuanensis and co-inoculation treatments exhibited significant improvements in filled grain panicle-1 and total grain yield compared to the control, regardless of water conditions (Table 8). This could be because the increased SPAD values under the E. sichuanensis and co-inoculation treatments contributed to higher filled grain panicle-1 and total grain yield. According to Monteoliva et al., chlorophyll content enhances photosynthesis, thereby improving crop yield [55].
Water insufficiency during the flowering stage reduces grain number and spikelet fertility, resulting in significant yield losses [4]. In this study, water deficit conditions hindered rice growth, resulting in lower yield characteristics than under flooded conditions (Table 8). Jarin et al. reported that water stress decreased SPAD values, RWC, and flag leaf area in rice, thus decreasing grain yield [56]. This aligns with our findings, as rice plants exhibited reductions in plant height, leaf area, RWC, root length, and SPAD values, leading to reduced total grain yield.
The results indicate that bacterial inoculation interacted significantly with water conditions for RWC and root length (Table 6). The co-inoculation treatment combined with the flooded conditions promoted higher RWC and root elongation in rice plants than those under water deficiency without bacterial inoculation (Figs. 3, 4). Si deposition in epidermal cells, the cuticle, guard cells, and endodermal tissues may stimulate the formation of a silica double layer, lowering cuticular transpiration by increasing leaf and epidermal thickness and minimizing water loss during water stress [47]. Furthermore, Si is well known for improving plant water uptake by regulating root anatomy. The reason for this is likely due to Si-mediated modulation of polyamine and 1-aminocyclopropane-1-carboxylic acid concentrations, which strengthen endodermal silicification and suberization, enhancing root growth and, consequently, improving water uptake under drought [57]. In addition, increased Si uptake facilitated by SSB may promote endodermal suberization and continuous root growth, thereby helping preserve cell expansion and hydraulic conductivity and optimizing root water uptake under soil-drying conditions [53]. In the present study, rice cultivated under flooded conditions with higher water status and root development is readily apparent (Table 5). According to Vadez et al., soil conductance is substantially higher than root hydraulic conductance under water-sufficient soils and thus regulates the water flow sustaining transpiration [58], while the reduction of soil hydraulic conductivity occurring in soil drying becomes a dominant constraint rather than the root conductance, which is then associated with root shrinkage combined with loss of soil contact, further limiting water acquisition.
5. LIMITATIONS OF THE STUDY
The experiment was restricted to one rice variety, one location, and one growing season, while the use of pots may not adequately simulate field soil hydrodynamics. Moreover, soil pH, changes in the soil microbiota, and the biosafety aspects of Pseudomonas aeruginosa as a biofertilizer candidate were beyond the scope of this study. Silicon content was quantified only in stems at harvest, and the proposed mechanisms of silicon solubilization were inferred rather than directly demonstrated.
CONCLUSION
The present findings reveal that the E. sichuanensis and co-inoculation treatments improved plant height, RWC, SPAD values, lignin content, and Si uptake, thus enhancing filled grains panicle-1 and total grain yield in rice under both flooded and water-stressed conditions. Notably, co-inoculation increased root length under water-deficit conditions to levels comparable to those observed under flooded conditions. These results suggest that the E. sichuanensis and co-inoculation applications can alleviate the adverse impacts of water stress in rice, and may contribute to food security under climate change and population expansion. Nevertheless, some plant and soil parameters were restricted by the limitations of the pot experiment. Thus, it is suggested that future studies explore the field-scale application and formulation of these strains as biofertilizers.
AUTHORS’ CONTRIBUTIONS
All authors reviewed and agreed on this final manuscript for submission and publication. All authors: conceptualization and writing-original draft; H.M.H.: Methodology and formal analysis; M.M.Y., A.T.K.Z., Z.B., and H.Z.J.: Investigation, validation and supervision; H.M.H.: Experimental design, sampling and data analysis; M.M.Y., A.T.K.Z, Z.B, and H.Z.J: Review and editing; all authors: result interpretation and manuscript preparation; M M Y: funding acquisition.
LIST OF ABBREVIATIONS
| SSB | = Silicate-solubilizing bacteria |
| PGPB | = Plant growth-promoting bacteria |
| DOA | = Department of Agriculture |
| DAS | = Days after sowing |
| SI | = Solubilization index |
| DAI | = Days of incubation |
| TSB | = Tryptic Soy Broth |
| PEG | = Polyethylene glycol |
| OD | = Optical density |
| RWC | = Relative water content |
| NCBI | = National Center for Biotechnology Information |
AVAILABILITY OF DATA AND MATERIAL
All data reported in this article are available and will be provided on reasonable request.
FUNDING
This research was funded by Universiti Putra Malaysia (UPM) under the Putra Grant GP-IPS (GP-IPS/2023/9745000) (Vot No: 9745000).
ACKNOWLEDGEMENTS
All authors would like to thank Universiti Putra Malaysia (UPM) for providing financial support through the Putra Grant GP-IPS (GP-IPS/2023/9745000) under the project entitled “Enhancement of Growth and Development of MR297 Rice Variety by Silicate Solubilizing Bacteria under Different Water Conditions”. The authors would also like to thank Southeast Asian Regional Center for Graduate Study and Research in Agriculture (SEARCA) and the German Academic Exchange (DAAD) for awarding a DAAD-SEARCA scholarship to Mr. Ho Minh Hung to pursue his Master’s studies at the Faculty of Agriculture, Universiti Putra Malaysia.