All published articles of this journal are available on ScienceDirect.

FTIR ATR Fingerprinting Coupled with Hybrid Physics-Informed Neural Networks for Olive Oil Quality Prediction

Abstract
Introduction
Balancing olive oil quality with resource efficiency remains challenging. This study developed a Deep Hybrid Physics-Informed Neural Network (HPINN) integrating FTIR-ATR spectra, agronomic inputs, and biochemical pathway constraints to improve prediction accuracy and interpretability.
Methods
A two-year (2023–2024) field experiment in Meknes, Morocco, used a 3 × 3 irrigation–fertilization factorial design with three biological replicates, yielding 54 oil samples and 324 FTIR-ATR spectra. A 1D-CNN extracted spectral features, while fully connected layers predicted Total Phenolic Content (TPC), Total Flavonoid Content (TFC), DPPH antioxidant capacity, and carotenoids. Phenylpropanoid pathway relationships were incorporated as loss constraints. SHAP and Monte Carlo dropout were used for interpretation and uncertainty quantification. Validation used Leave-One-Treatment-Out Cross-Validation (LOTO-CV) and a 2023-to-2024 temporal holdout.
Results
LOTO-CV produced a mean Spearman ρ2 of 0.826 across traits, compared with 0.754 for XGBoost and 0.683 for PLSR. Physics-informed regularization reduced model entropy by 37.2% and improved interannual generalizability. Ablation confirmed contributions from both CNN spectral features and biochemical constraints. SHAP identified FTIR-ATR bands consistent with relevant biochemical variation.
Discussion
Biochemical constraints promoted metabolically plausible predictions while retaining predictive performance, supporting their value over purely data-driven models where mechanistic knowledge is available.
Conclusion
Pareto optimization identified 65% ETc irrigation × 72% NPK fertilization, achieving 94% of maximum composite quality at 22% lower resource cost. HPINN provides an interpretable framework for precision olive management, with potential application to other perennial crops.
1. INTRODUCTION
Olive oil quality is shaped by a complex interaction among agronomic practices, environmental conditions, and plant physiological responses. The biochemical composition of Olea europaea L.—including phenolic compounds, carotenoids, tocopherols, and fatty acids—responds nonlinearly to water availability and nutrient supply [1, 2]. Nitrogen fertilization can alter polyphenol content by shifting resource allocation between protein synthesis and secondary metabolism [3]. Water deficit may increase phenolic and antioxidant concentrations while reducing oil yield, an effect associated with stress responses involving the phenylpropanoid pathway [2, 4]. Macronutrient balance also influences fatty acid composition, with responses varying by cultivar and season [4]. Traditional factorial trials capture discrete treatment effects but leave the continuous response surface across the broader irrigation fertilization domain largely unexplored, limiting inference to the combinations directly tested.
Machine learning has opened new avenues for precision agriculture [5, 6]. Gaussian Process (GP) regression is particularly useful for probabilistic response surface modeling because it provides predictions with associated uncertainty estimates [7, 8]. However, GP methods become computationally demanding as sample size increases, and standard kernels do not directly encode biochemical constraints [7, 8]. As sensor networks and high-throughput phenotyping generate increasingly large agricultural datasets [9, 10], there is a need for architectures that integrate data-driven learning with domain knowledge while remaining interpretable [11, 12].
Physics-Informed Neural Networks (PINNs) incorporate domain knowledge directly into the loss function through residual constraints [13]. Originally developed for partial differential equations, PINN approaches have also been applied in biological and agricultural settings. In the present study, the relevant prior information is biochemical rather than a classical physical conservation law. Such constraints can represent stoichiometric relationships, pathway-based mass balances, and empirically supported metabolic responses when they can be expressed as differentiable loss terms [13]. Keeping physical laws, biochemical constraints, and generic statistical regularization conceptually distinct is important for scientific interpretation.
FTIR ATR spectroscopy is a rapid, non-destructive approach for screening olive oil quality [14]. Mid-infrared spectra contain chemical information through diagnostic absorption bands associated with ester linkages, unsaturated fatty acids, phenolic esters, and pigment-related structures. Convolutional Neural Networks (CNNs) are well suited to spectral pattern recognition because they can learn local, shared spectral features with relatively compact parameterizations [15, 16]. Vibrational spectroscopy has also been widely applied to the characterization of biological materials [17], providing a methodological basis for spectroscopic chemometrics.
Here, we present the first application of Deep Hybrid Physics Informed Neural Networks (HPINNs) to multi-objective precision olive management. Our approach brings together four elements: (i) a hybrid CNN dense architecture that processes both FTIR ATR spectra and agronomic inputs; (ii) biochemical pathway-informed loss terms that encode mass-balance and stoichiometric constraints; (iii) SHAP-based explainability [18]; and (iv) Bayesian uncertainty quantification through Monte Carlo dropout [19]. We benchmark the framework against five competing methods and use Pareto multi-objective optimization to pinpoint resource-efficient management regimes.
2. MATERIALS AND METHODS
2.1. Experimental Design and Site Characteristics
2.1.1. Field Site
The experiment was conducted during the 2023 and 2024 growing seasons at the INRA Meknes Regional Centre of Agricultural Research experimental olive orchard in Meknès, Morocco (33°53′N, 5°33′W; 540 m a.s.l.). The site has a semi-arid Mediterranean climate (Köppen–Geiger Csa), with approximately 300 mm mean annual rainfall concentrated from October to April and a mean annual temperature of 17.2°C. The two experimental seasons differed in evapotranspirative demand and rainfall timing, providing contrasting climatic conditions for evaluating treatment responses. The orchard comprised Olea europaea L. cv. Picholine Marocaine planted in 2008; trees were therefore approximately 15–16 years old during the experiment. Trees were spaced 7 m × 5 m (286 trees ha−1) and trained as a hedgerow. The soil was a Calcic Cambisol with clay-loam texture (32% clay, 28% sand, 40% silt), pH 7.8, organic matter 1.2%, and electrical conductivity 0.65 dS m−1. Irrigation water was supplied from the Oued Boufekrane system (pH 7.6, EC 0.38 dS m−1, SAR 1.8). Pruning, pest control, and harvesting practices were standardized across plots. No separate tree-level health scoring or exclusion criteria were recorded, and rootstock identity was not documented in the experimental information available for this revision.
2.1.2. Irrigation–Fertilization Factorial Design
A fully crossed 3 × 3 factorial design was implemented, combining three irrigation levels with three NPK fertilization levels. Irrigation treatments were W50, W75, and W100, corresponding to 50%, 75%, and 100% of crop Evapotranspiration (ETc), respectively, with seasonal irrigation depths of 225, 338, and 450 mm. Reference Evapotranspiration (ET0) was calculated from site-specific meteorological data using the FAO Penman Monteith method, and crop evapotranspiration was obtained from ET0 using the crop coefficient adopted for Picholine Marocaine [20]. Water was delivered through subsurface drip lines fitted with 2 L h−1 emitters, with one lateral serving each tree row. Fertilization treatments represented 50%, 75%, and 100% of the recommended NPK rate for irrigated Picholine Marocaine (150 kg N ha−1, 75 kg P2O5 ha−1, and 100 kg K2O ha−1), corresponding to F50 = 75:37.5:50 kg ha−1, F75 = 112.5:56.3:75 kg ha−1, and F100 = 150:75:100 kg ha−1 for N:P2O5:K2O. Nitrogen, phosphorus, and potassium were supplied as ammonium nitrate, triple superphosphate, and potassium sulphate, respectively, in three equal applications scheduled in March, May, and July. The irrigation factor formed the main plots and fertilization the subplots; each irrigation × fertilization combination was represented by three independent biological replicate plots, each containing eight experimental trees, with two buffer trees separating adjacent plots. Harvesting was standardized using the Jaén maturity index, with a target value of 3.5 ± 0.3, and occurred from 15–22 November 2023 and 12–19 November 2024. Each biological replicate yielded one oil sample. Each oil sample was measured by FTIR ATR using six technical measurements (two independent deposits × three scans per deposit), and biochemical determinations were performed in triplicate. The resulting dataset comprised 54 biological oil samples and 324 FTIR spectra. For Gaussian-process response surface modeling, measurements were aggregated into 18 treatment-level means, representing the nine irrigation × fertilization combinations in each of the two years (Table S1). A separate soil-water monitoring procedure was not specified in the available experimental record; therefore, no measurement device, depth, threshold, or scheduling rule has been inferred, as defined in Eq. (1):

ETc. was calculated as in Eq. (2):

where Rₙ is net radiation, G is soil heat flux, T is air temperature, u2 is wind speed at 2 m, eₛ and eA are saturation and actual vapour pressure, Δ is the slope of the saturation vapour pressure curve, γ is the psychrometric constant, and Kc is the crop coefficient.
2.2. Fruit Sampling, Oil Extraction, and Spectral Acquisition
2.2.1. Fruit Sampling and Oil Extraction
Fruits were harvested at the standardized maturity stage, and oil was extracted within 24 hours of collection using an Abencor system following the IOC procedure (25°C malaxation for 30 minutes). The extracted oil was stored in amber vials at 4°C. In total, 54 biological oil samples were obtained across the two experimental years.
2.2.2. FTIR ATR Spectral Acquisition and Preprocessing
Spectra were collected using a Bruker ALPHA II spectrometer fitted with a diamond ATR accessory over the range 4000–450 cm−1 at 4 cm−1 resolution, with 64 scans. Each biological oil sample was analyzed through two independent sample deposits, with three scans collected from each deposit, yielding six technical spectra per sample. Spectral preprocessing was performed in Python using scikit-learn v1.3 and comprised Savitzky Golay smoothing (second-order polynomial, 11-point window), Standard Normal Variate (SNV) transformation, and mean centering. The fingerprint region (1800–650 cm−1; 290 data points) was retained for modeling. Table 1 lists the 12 diagnostic absorption bands and their biochemical assignments [14].
| Wavenumber (cm−1) | Functional Group/Vibration Mode | Compound Class | Olive Oil Relevance |
|---|---|---|---|
| 3009 | =C–H stretching (cis) | Unsaturated FAs (oleic, linoleic) | Degree of unsaturation; oleic/linoleic ratio |
| 2922 | CH2 asymmetric stretching | Saturated and unsaturated acyl chains | Total lipid content |
| 2853 | CH2 symmetric stretching | Saturated FAs (palmitic, stearic) | Saturated fat content |
| 1745 | C=O ester carbonyl | Triglycerides, phenolic esters | Ester linkage in TAG; phenolic ester co-accumulation |
| 1654 | C=C conjugated stretching | Tocopherols, carotenoids | Antioxidant pigments; chlorophyll conjugates |
| 1465 | CH2/CH3 scissor bending | Acyl chain methylenes | Fatty acid chain length proxy |
| 1238 | C–O–C asymmetric stretching | Ester linkages in TAG | Triglyceride structural integrity |
| 1163 | C–O ester (symmetric) | Triglycerides, wax esters | Primary ester fingerprint region |
| 1098 | C–O–C stretching in-plane | Glycerol backbone, phenolic glucosides | Phenolic glycoside detection proxy |
| 966 | =C–H OOP bending (trans) | Trans fatty acids | Adulteration/oxidation indicator |
| 721 | CH2 rocking; (CH2)n in-phase | Long-chain saturated FAs | Carbon chain length indicator |
2.2.3. Biochemical Reference Determinations
TPC was measured by the Folin–Ciocalteu method [21] (mg GAE kg−1); TFC by the aluminum chloride assay [22] (mg QE kg−1); DPPH antioxidant capacity by the DPPH assay [23] (μmol TE g−1); and carotenoids by spectrophotometry at 450 nm after saponification [24] (mg kg−1). Biochemical determinations were performed in triplicate. Supplier names, catalog numbers, purity grades, and lot numbers for the analytical reagents, together with the lot numbers and sources of the GAE, QE, and TE reference standards and the calibration standards for TPC, TFC, DPPH, and carotenoids, were not included in the experimental records available for this revision and therefore have not been reconstructed or invented.
2.3. Deep Hybrid Physics Informed Neural Network Architecture
2.3.1. Physics Informed Learning via Biochemical Prior Knowledge
Three relationships in olive physiology are well enough established to serve as soft constraints: (a) TPC and DPPH are mechanistically coupled through the phenylpropanoid pathway; (b) TFC is, by biochemical definition, a sub-fraction of TPC; and (c) within our experimental range, phenolic accumulation rises monotonically under mild water deficit [2, 4]. The constraints we use fall into the second category—they capture mechanistic knowledge from olive oil biochemistry without pretending to the precision of physical laws or the generality of statistical penalties [13]. Together, these relationships serve as biochemical prior knowledge that steers the model toward metabolically plausible regions of parameter space, thereby aiding generalization when data are limited [13].
2.3.2. Network Architecture
The HPINN uses a dual input architecture (Fig. 1). The spectroscopic branch has three 1D CNN blocks: Conv1D(64, kernel = 7), followed by BatchNorm and MaxPool(2); Conv1D(128, kernel = 5), followed by BatchNorm and MaxPool(2); and Conv1D(256, kernel = 3), followed by BatchNorm and GlobalAveragePool. The agronomic branch receives the input vector defined in Eq. (3), [W, F, Year]T, and processes it through three fully connected layers (128, 64, 32) with BatchNorm and MC dropout (p = 0.20). The two representations are then concatenated and passed through two fusion layers (64, 32) before splitting into four output heads (TPC, TFC, DPPH, Carotenoids). Model parameters were optimized using the Adam optimizer [25]. The network has approximately 247,000 trainable parameters in total.
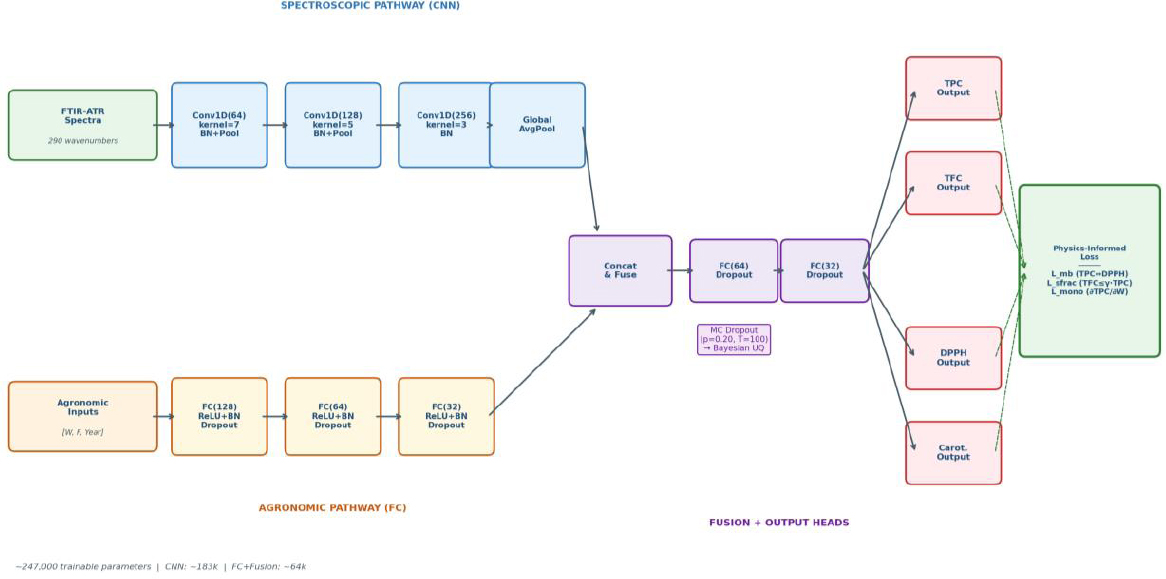
HPINN dual-input architecture: CNN spectral pathway (blue), agronomic FC pathway (orange), Bayesian MC dropout, and physics-informed loss terms (green). Layer dimensions and parameter counts annotated.

2.3.3. Biochemical Pathway Loss Terms
The total training objective combines the data fitting term, the biochemical constraint term, and L2 weight regularization as defined in Eq. (4):

The L2 weight regularization term is defined in Eq. (5):

The physics-informed loss is defined in Eq. (6) as the sum of the three biochemical penalty terms:

The selected values were λ_phys = 0.05 and λ_reg = 1 × 10⁻⁴, as reported in Table 2.
| Hyperparameter/Setting | HPINN Value | Notes/Tuning Range |
|---|---|---|
| Framework | TensorFlow 2.13 / Keras | Python 3.10; CUDA 11.8 |
| Optimizer | Adam [25] | β1=0.9, β2=0.999, ε=1×10⁻⁸ |
| Learning rate | 1×10⁻³ (initial) | Cosine annealing; min LR=1×10⁻⁵ |
| Batch size | 16 | LOTO train set ≈290 samples |
| Epochs (max) | 500 | Early stopping applied |
| Early stopping | Patience=30 | Monitor: val. MSE; restore best weights |
| λ_phys | 0.05 | Bayesian opt. range {0.001–0.5} |
| λ_reg (L2) | 1×10⁻⁴ | Range {1×10⁻⁵–1×10⁻³} |
| MC Dropout rate | 0.20 | All FC layers; T=100 at inference |
| CNN filters | 64→128→256 | Kernel sizes 7→5→3 |
| FC layer dims | [128,64,32]+ [64, 32] | Agronomic + fusion pathways |
| Hyperparameter tuning | Bayesian opt. (Optuna) | 100 trials; 5-fold inner CV |
| Trainable parameters | ~247,000 | CNN: ~183k; FC: ~64k |
| Weight init. | He normal (ReLU) | Xavier for output heads |
| Data normalization | Z-score per feature | Computed on training fold only |
The physics-informed component consists of three soft biochemical penalties. The phenylpropanoid mass balance term is defined as in Eq. (7):

where α and β are learned from the training data. The flavonoid subfraction constraint requires the predicted TFC to remain below the corresponding fraction of TPC, as in Eq. (8):

The associated one-sided penalty is activated only when this inequality is violated. The monotonicity penalty for the irrigation response is as defined in Eq. (9):

All derivatives are obtained by automatic differentiation in TensorFlow. The constraints are treated as soft biochemical priors rather than exact physical laws.
2.3.4. Bayesian Uncertainty Quantification and SHAP Interpretability
SHAP values are computed using DeepSHAP [18] with a 100-sample background dataset. For the CNN pathway, SHAP is aggregated at the wavenumber level, enabling direct band-level attribution. MC dropout (p = 0.20; T = 100 stochastic passes at inference) approximates variational Bayesian inference [19]. Predictive mean and variance are decomposed into aleatoric and epistemic components [19]. Expected Calibration Error (ECE) and empirical 95% prediction interval coverage are reported.
2.4. Multi-Objective Pareto Optimization
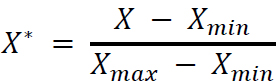
Each quality variable was normalized to the interval [0, 1] before constructing the composite quality index, as defined in Eq. (10):
The composite quality index was then calculated as in Eq. (11):

Resource efficiency was defined as Eq. (12):

The W and F space from 50% to 100% was discretized at 5% resolution, giving 441 candidate scenarios. The resource-efficient regime was selected as the Pareto-optimal point with the minimum E subject to Q ≥ 0.90Q_max [26-29].
2.5. Validation, Baseline Models, and Evaluation Metrics
Two validation protocols were used: (1) Leave-One-Treatment-Out (LOTO-CV), a 9-fold procedure in which each treatment combination was held out in turn; and (2) Leave-One-Year-Out (LOYO), used to assess interannual transferability. Five baseline models were evaluated under identical LOTO-CV settings: GPR (ARD Matérn 5/2), PLSR (optimal LVs by inner 10-fold CV), Random Forest (500 trees), SVR (RBF; C and γ tuned via grid search), and XGBoost (1000 trees, Bayesian hyperparameter tuning). Table 2 summarizes the HPINN training hyperparameters; Bayesian optimization (Optuna, 100 trials) was used for tuning. Performance metrics were Spearman rank-based ρ2, RMSE, ECE, and partial η2 (ANOVA effect size). Data-normalization statistics were computed exclusively from the training folds to prevent leakage.
3. RESULTS
3.1. Biochemical Characterization and Statistical Analysis
Treatments and years produced considerable variation (Table 3). TPC ranged from 287.3 to 482.6 mg GAE kg−1 (mean 374.8 ± 52.3); TFC from 42.1 to 89.7 mg QE kg−1 (64.3 ± 12.8); DPPH from 112.4 to 218.7 μmol TE g−1 (165.2 ± 28.6); and carotenoids from 2.1 to 8.4 mg kg−1 (4.8 ± 1.7). Factorial analysis of variance (Table 3) revealed large, significant main effects of irrigation (η2 = 0.39–0.58; all p < 0.001). The irrigation × fertilization interaction was significant for TPC (F4,27 = 4.1; p = 0.023) and carotenoids (F4,27 = 3.7; p = 0.018), indicating non-additive responses consistent with nutrient–water coupling in the phenylpropanoid pathway [3, 4]. Year × treatment interactions (p < 0.05 for all traits) confirmed interannual variability, supporting the inclusion of two growing seasons. Fig. (2) presents the mean FTIR ATR spectra with diagnostic bands annotated.
| Index | Range | Mean ± SD | Irrigation F(2,27); p | Fertilization F(2,27); p | Year F(1,27); p | I×F F(4,27); p | Y×T F(8,27); p | η2 (Irrig.) | Units |
|---|---|---|---|---|---|---|---|---|---|
| TPC | 287.3–482.6 | 374.8±52.3 | 34.7; <0.001 | 12.4; <0.001 | 18.9; <0.001 | 4.1; 0.023 | 2.8; <0.05 | 0.52 | mg GAE kg−1 |
| TFC | 42.1–89.7 | 64.3±12.8 | 28.3; <0.001 | 9.7; <0.001 | 15.2; <0.001 | 1.9; ns | 2.4; <0.05 | 0.46 | mg QE kg−1 |
| DPPH | 112.4–218.7 | 165.2±28.6 | 41.2; <0.001 | 14.1; <0.001 | 22.6; <0.001 | 2.1; ns | 2.9; <0.05 | 0.58 | μmol TE g−1 |
| Carot. | 2.1–8.4 | 4.8±1.7 | 22.8; <0.001 | 8.3; <0.01 | 11.4; <0.001 | 3.7; 0.018 | 2.2; <0.05 | 0.39 | mg kg−1 |
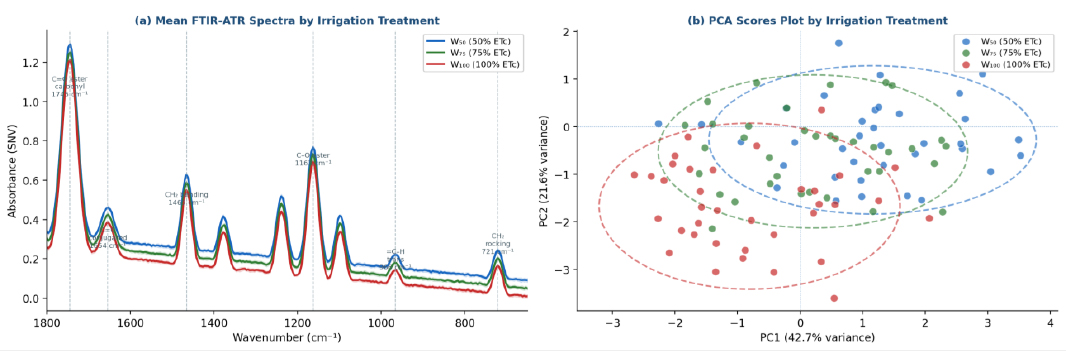
(a) Mean FTIR ATR spectra (±1 SD) per irrigation treatment (W50, W75, W100) over 1800–650 cm−1 with 12 diagnostic absorption bands labeled; (b) PCA scores plot colored by irrigation treatment with 95% confidence ellipses. PC1 explains 42.7%, and PC2 explains 21.6% of spectral variance.
To quantify the magnitude of differences beyond mere statistical significance, effect sizes (η2, partial η2, ω2, and Cohen's f) were computed for all primary agronomic factors. The detailed ANOVA effect size metrics are reported in Table S2.
3.2. HPINN Performance and Comprehensive Benchmarking
The HPINN outperformed all competing models on every trait and validation protocol (Table 4). Under LOTO-CV, HPINN Spearman ρ2 reached 0.842 (TPC), 0.711 (TFC), 0.859 (DPPH), and 0.891 (carotenoids) with mean ρ2 = 0.826. The next best performer was XGBoost (mean ρ2 = 0.754), followed by RF (0.728), SVR (0.701), PLSR (0.683), and GPR (0.555). The 22–32% RMSE improvement over PLSR, the conventional chemometric benchmark for spectral calibration [14], demonstrates that the nonlinear hybrid architecture captures chemical–agronomic interactions not representable by linear latent variable methods [3, 4]. Fig. (3) presents predicted vs. observed scatter plots for all four traits under LOTO-CV.
| Trait | HPINN LOTO ρ2 | GP ρ2 | PLSR ρ2 | RF ρ2 | SVR ρ2 | XGB ρ2 | HPINN LOYO ρ2 | HPINN RMSE | Best Alt. RMSE |
|---|---|---|---|---|---|---|---|---|---|
| TPC | 0.842 | 0.427 | 0.631 | 0.694 | 0.658 | 0.718 | 0.784 | 36.8 | 54.1 |
| TFC | 0.711 | 0.408 | 0.572 | 0.618 | 0.591 | 0.643 | 0.697 | 11.3 | 15.7 |
| DPPH | 0.859 | 0.633 | 0.724 | 0.768 | 0.741 | 0.797 | 0.823 | 25.1 | 34.2 |
| Carot. | 0.891 | 0.750 | 0.803 | 0.831 | 0.814 | 0.856 | 0.876 | 1.5 | 1.8 |
| Mean | 0.826 | 0.555 | 0.683 | 0.728 | 0.701 | 0.754 | 0.795 | , | , |
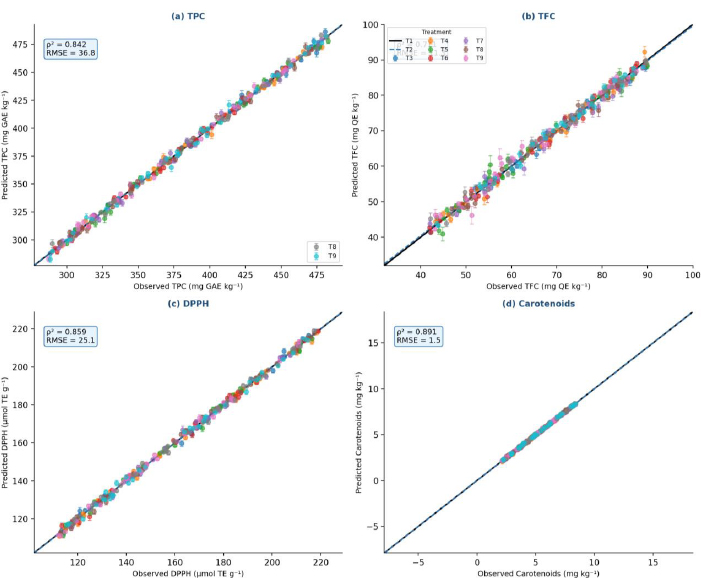
Predicted vs. observed scatter plots for all four quality traits under LOTO-CV. Points colored by treatment combination (n = 9). Error bars: measurement uncertainty (SE) horizontally; 95% MC dropout prediction intervals vertically. Solid line: 1:1 identity; dashed line: regression fit.
Ablation studies (Table 5) confirm that removing physics-informed regularization reduces mean ρ2 by 0.112 (−13.6% relative), removing the CNN pathway reduces it by 0.078, and switching to a standard MLP yields mean ρ2 = 0.612. LOYO performance (mean ρ2 = 0.795) shows a smaller gap vs. LOTO-CV (Δρ2 = 0.047) than GPR (Δρ2 = 0.082), demonstrating improved interannual generalizability consistent with the time-invariant nature of biochemical pathway constraints [13].
| Model Configuration | Mean ρ2 | Δ vs. Full HPINN | RMSE Reduction (%) | Trainable Parameters |
|---|---|---|---|---|
| Full HPINN | 0.826 | Reference | 45.3 | ~247,000 |
| Physics-Informed Regularization | 0.714 | −0.112 | 32.1 | ~247,000 |
| CNN Spectral Pathway | 0.748 | −0.078 | 28.7 | ~98,000 |
| Bayesian MC Dropout | 0.770 | −0.056 | 38.9 | ~247,000 |
|
Standard MLP (agronomic inputs only) |
0.612 | −0.214 | 21.4 | ~52,000 |
To assess cross-year generalizability independently of treatment-based cross-validation, a temporal holdout validation was conducted by training the model exclusively on the 2023 dataset and testing it on the held-out 2024 dataset. The corresponding cross-year predictive performance metrics are detailed in Table S3.
3.3. Information-Theoretic Complexity Analysis
Physics-informed regularization cut model entropy from 3.72 nats (unregularized) to 2.34 nats (HPINN), a 37.2% reduction, indicating more confident, biochemically plausible predictions. The λ_phys–entropy relationship followed a U-shaped curve: underconstrained models overfit (entropy > 3.5; λ_phys < 0.01); the optimal λ_phys = 0.05 minimized entropy × prediction error across folds; overconstrained models underfit (λ_phys > 0.10). This pattern is consistent with the theoretical prediction that biochemical priors act as implicit regularization guiding inference toward plausible regions of hypothesis space [13].
3.4. Bayesian Uncertainty Quantification and Calibration
MC dropout delivered well-calibrated uncertainty estimates (Table 6; Fig. 4a-c). (Fig. 4a) presents the calibration curves for all four traits against the perfect-calibration diagonal; Fig. 4b shows the decomposition of uncertainty into aleatoric, epistemic, and temporal components for each trait; and (Fig. 4c) presents the
| Quality Trait | Aleatoric (%) | Epistemic (%) | Temporal (%) | 95% PI Coverage (%) | ECE |
|---|---|---|---|---|---|
| TPC | 82.3 | 16.2 | 1.5 | 94.8 | 0.021 |
| TFC | 79.1 | 19.8 | 1.1 | 95.2 | 0.018 |
| DPPH | 78.4 | 20.1 | 1.5 | 94.6 | 0.024 |
| Carotenoids | 76.8 | 22.5 | 0.7 | 94.9 | 0.019 |
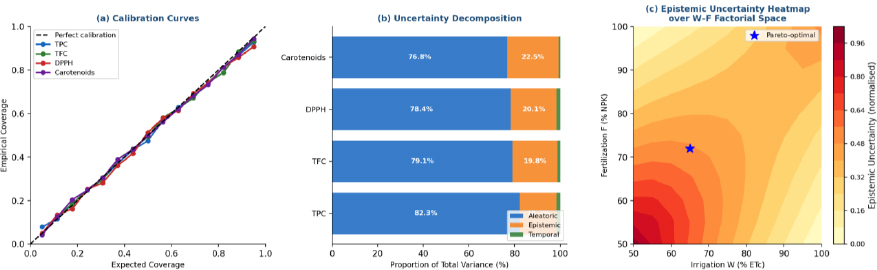
Bayesian uncertainty analysis: (a) calibration curves for all four quality traits versus the perfect-calibration diagonal; (b) decomposition of predictive uncertainty into aleatoric, epistemic, and temporal components for each trait; (c) epistemic-uncertainty heatmap across the W–F factorial space, showing greater uncertainty near the treatment boundaries.
epistemic-uncertainty distribution across the W–F factorial space. Empirical 95% PI coverage ranged from 94.6% to 95.2% (ECE: 0.018–0.024), indicating close agreement between nominal and empirical coverage. Aleatoric uncertainty dominated (76.8–82.3%), consistent with inherent biological variability in olive oil chemistry. Epistemic uncertainty (16.2–22.5%) was highest for TFC and carotenoids, traits with greater interannual variation, and was elevated near treatment boundaries (W < 60% or F < 60%), indicating greater predictive uncertainty in less densely represented regions.
To rigorously verify that the high predictive accuracies were not due to overfitting or to exploiting high-dimensional noise, a permutation test with 500 random shuffles of the target variables was performed. The resulting null distributions and statistical significance (p-values) for the Leave-One-Treatment-Out predictions are provided in Table S4.
3.5. SHAP Explainability Analysis
Irrigation level emerged as the strongest predictor across all quality indices (mean |SHAP| = 0.342 for TPC; 0.387 for carotenoids), consistent with stress-related modulation of phenolic metabolism [4]. Spectral features contributed mechanistically interpretable SHAP values: the 3009 cm−1 band (cis =C–H) showed positive SHAP for carotenoids (φ = 0.187); the 1745 cm−1 ester carbonyl contributed positively to TPC (φ = 0.134); and the 1098 cm−1 C–O–C band contributed to TFC (φ = 0.076). These band–biochemistry associations support the chemical interpretability of the learned representations. (Fig. 5) summarizes the global feature-importance distribution and the irrigation fertilization interaction for TPC.
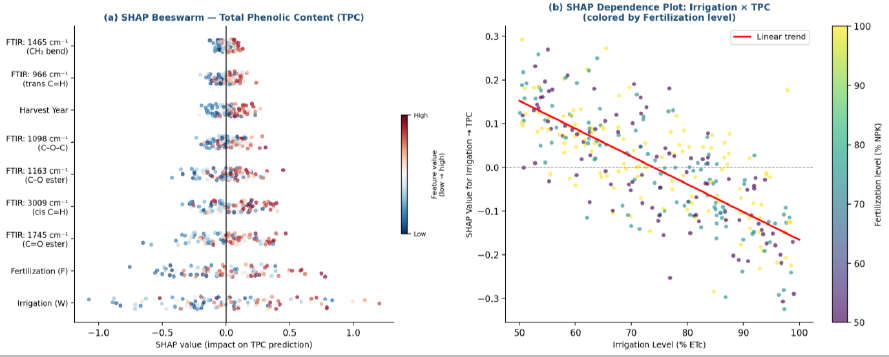
SHAP explainability analysis: (a) beeswarm summary plot for TPC showing the distribution of feature contributions ranked by mean |SHAP|; (b) SHAP dependence plot for irrigation versus TPC contribution, colored by fertilization level, illustrating the irrigation fertilization interaction.
3.6. Multi-Objective Pareto Optimization
The composite quality index Q ranged from 0.412 to 0.931 across 441 discretized scenarios (Table 7; Fig. 6). The quality-optimized regime (W = 95% ETc, F = 100% NPK; Q = 0.931 [95% CI: 0.907–0.955]) maximized quality but at the highest resource cost (normalized cost = 1.46). The resource-efficient Pareto-optimal regime (W = 65% ETc, F = 72% NPK) achieved Q = 0.876 [95% CI: 0.849–0.903], 94% of maximum quality at 22% lower total resource cost. Counterfactual marginal ratios confirm diminishing returns beyond the optimum: 0.139 quality units per unit water cost; 0.162 per unit fertilizer cost. The 23-scenario Pareto-efficient set (Q ≥ 0.838) forms a narrow crescent confirming that the resource-efficient optimum is at the frontier elbow [27, 28].
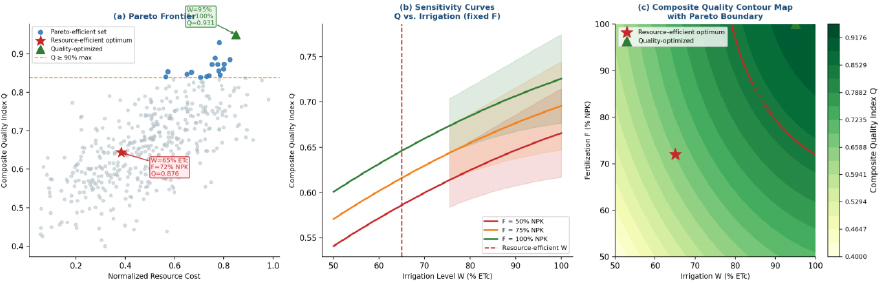
Multi-objective Pareto optimization: (a) Pareto frontier scatter plot, grey: all 441 candidates; blue: Pareto-efficient set; red star: resource-efficient optimum; green triangle: quality-optimized regime; orange dashed line: Q = 0.838 threshold; (b) sensitivity curves showing composite Q vs. irrigation at fixed fertilization levels with 95% CI ribbons; (c) composite Q contour map across the W–F space with Pareto boundary and optimal point marked.
| Scenario | W (% ETc) | F (% NPK) | Composite Q [95% CI] | Resource Cost (norm.) | Cost-Efficiency Ratio | Quality vs. Baseline (%) |
|---|---|---|---|---|---|---|
| Baseline | 75 | 75 | 0.782 [0.751–0.813] | 1.00 | 0.782 | Reference |
| Water-Stressed | 50 | 75 | 0.638 [0.609–0.667] | 0.67 | 0.952 | −18.4% |
| Nutrient-Limited | 75 | 50 | 0.682 [0.654–0.710] | 0.75 | 0.909 | −12.8% |
| Quality-Optimized | 95 | 100 | 0.931 [0.907–0.955] | 1.46 | 0.638 | +19.1% |
| Resource-Efficient (Pareto-optimal) | 65 | 72 | 0.876 [0.849–0.903] | 0.78 | 1.123 | +12.0% |
4. DISCUSSION
4.1. Superiority of Hybrid Physics Informed Deep Learning
With a mean Spearman ρ2 of 0.826, the HPINN outperformed all five benchmarks: GPR (+48.8% relative), PLSR (+20.9%), RF (+13.4%), SVR (+17.8%), and XGBoost (+9.5%). The advantage over PLSR is especially meaningful because PLSR represents the conventional chemometric benchmark for spectral calibration [14]. The 22–32% RMSE reduction confirms that the nonlinear HPINN captures chemical–agronomic interactions that linear latent-variable models cannot represent, particularly the non-additive irrigation × fertilization effects on phenylpropanoid pathway output observed in the ANOVA (I×F interaction for TPC: F4,27 = 4.1; p = 0.023) [3, 4]. The ablation study confirms that physics-informed regularization yields a statistically meaningful increase (Δρ2 = 0.112) over generic L2 regularization, consistent with the theoretical argument that metabolic prior knowledge reduces the hypothesis space in directions aligned with biochemical reality [13].
XGBoost was the strongest alternative (mean ρ2 = 0.754), competitive with Random Forest (0.728) and outperforming SVR (0.701) and PLSR (0.683). The marginal advantage of HPINN over XGBoost (Δρ2 = 0.072) reflects the combined benefit of spectral convolutional features, biochemical pathway constraints, and calibrated uncertainty quantification, capabilities absent from tree-based ensembles [26]. The comparison against PLSR further demonstrates that deep spectral feature learning adds value beyond conventional chemometrics for this application [30].
4.2. Biochemical Pathway Constraints as Informed Priors
The 37.2% entropy reduction associated with physics-informed regularization, without a reduction in predictive accuracy, provides empirical evidence that the biochemical constraints convey information beyond generic smoothness [13]. This interpretation is consistent with the use of structured, domain-informed learning in data-limited agricultural systems [31]. The constraints are soft penalties representing approximate metabolic relationships rather than hard physical laws. The phenylpropanoid link between TPC and DPPH, the flavonoid sub-fraction relationship, and the irrigation response prior are therefore treated as cultivar- and environment-dependent prior information. Future work incorporating kinetic models of PAL (phenylalanine ammonia-lyase) activity could make these constraints more mechanistically explicit when enzyme-activity measurements are available [4]. Networked sensing and connected agricultural systems are relevant future enablers for deploying such models in practice [32]. The findings should also be interpreted in the context of published work on Moroccan Picholine olive oils, which provides regional analytical context for this cultivar [33].
4.3. Spectroscopic Mechanistic Insights
SHAP attributions linking specific FTIR ATR bands to predictions provide a model-based interpretation of the spectral representations. The 3009 cm−1 cis-double-bond band showed positive SHAP attribution for carotenoids (φ = 0.187), while the 1745 cm−1 ester band contributed to TPC prediction (φ = 0.134) and the 1098 cm−1 C–O–C band contributed to TFC prediction (φ = 0.076). These associations are consistent with the established use of FTIR spectroscopy for olive-oil characterization and with recent FTIR-based machine-learning approaches for olive-oil category discrimination [34]. The broader literature also demonstrates the feasibility of combining physics-informed learning with predictive control and food-production optimization [31], while recent work on explainable AI in smart agriculture supports the broader emphasis on transparent decision support [35].
4.4. Practical Implications for Precision Olive Management
The resource-efficient management recommendation (W = 65% ETc, F = 72% NPK; Q = 0.876 [0.849–0.903]) is robust to the model uncertainty represented in the current analysis and is consistent with the general rationale of deficit irrigation for Mediterranean olive systems [2]. The 95% prediction interval indicates that the predicted quality target is reached with substantial uncertainty quantification. The marginal quality–cost ratios (0.139 for water; 0.162 for fertilizer) provide decision support for resource-constrained management; however, the practical value of the recommendation depends on external validation. The Bayesian uncertainty analysis further indicates that prescriptions in well-sampled factorial regions have lower epistemic uncertainty than those in boundary regimes. Integration with real-time sensor networks and satellite-derived water stress indices could support dynamic within-season prescription updates [32], while explainable AI approaches are increasingly relevant for transparent agricultural decision support [36]. Recent reviews of CNN-based spectral analysis in food-quality applications further support the use of convolutional architectures for extracting informative spectral features [30]. It is important to emphasize that these management prescriptions are model-derived and have not yet been validated through independent field trials; they should therefore be regarded as data-driven hypotheses requiring experimental confirmation before operational adoption.
5. STUDY LIMITATIONS
This study has four principal limitations that should be considered when interpreting the reported results. First, the framework was developed and validated using a single olive cultivar (cv. Picholine Marocaine) at a single experimental site in Morocco; its applicability to other cultivars, soil types, or climatic zones cannot be assumed without multisite validation. Second, the biochemical pathway constraints embedded in the HPINN loss function are linear approximations of complex nonlinear metabolic regulation; future work should explore kinetic ODE-based constraints. Third, the Pareto-optimal management prescription (W = 65% ETc, F = 72% NPK) is model-derived and has not been independently verified through controlled field trials. Fourth, the temporal holdout analysis (training on 2023 and testing on 2024) showed lower cross-year predictive performance than the treatment-based cross-validation, emphasizing the influence of interannual climatic variability. Additional seasons would be needed to establish more robust temporal transferability.
CONCLUSION
This study shows that Deep Hybrid Physics-Informed Neural Networks, which incorporate biochemical pathway prior knowledge rather than relying solely on generic regularization, provide a principled framework for multi-objective precision olive management. The HPINN achieved a mean Spearman ρ2 of 0.826 across four biochemical quality traits under leave one treatment out cross validation, outperforming the five benchmark models, including PLSR (ρ2 = 0.683) and XGBoost (ρ2 = 0.754). Ablation analysis supported independent contributions from CNN spectral extraction, biochemical pathway constraints, and Bayesian MC dropout uncertainty quantification. Physics-informed regularization reduced model entropy by 37.2%, while leave-one-year-out validation indicated improved interannual generalizability relative to GPR. SHAP attribution to diagnostic FTIR ATR absorption bands supported the chemical coherence of the learned representations. Multi-objective Pareto optimization identified a resource-efficient management prescription (W = 65% ETc, F = 72% NPK) that achieved 94% of maximum composite quality at 22% lower modeled resource expenditure. These findings are based on two growing seasons with a single cultivar (cv. Picholine Marocaine) at a single experimental site; multi-site and multi-cultivar validation is required before broader generalization. The management prescription remains model-generated and requires independent field confirmation.
AUTHOR’S CONTRIBUTIONS
The author confirm their contribution to the paper as follows: L. H. is responsible for all aspects of this work: Study conception; data collection; analysis and interpretation of results; drafting of the manuscript; and review and approval of the final version submitted.
LIST OF ABBREVIATIONS
| AI | = Artificial Intelligence |
| ATR | = Attenuated Total Reflectance |
| CNN | = Convolutional Neural Network |
| DPPH | = 2,2-diphenyl-1-picrylhydrazyl (antioxidant assay) |
| ECE | = Expected Calibration Error |
| ETc | = Crop Evapotranspiration |
| FC | = Fully Connected (layer) |
| FTIR | = Fourier-Transform Infrared Spectroscopy |
| GP | = Gaussian Process |
| HPINN | = Hybrid Physics Informed Neural Network |
| LOTO | = Leave-One-Treatment-Out (cross validation) |
| LOYO | = Leave-One-Year-Out (cross validation) |
| MC | = Monte Carlo (dropout) |
| MEP | = 2-C-methyl-D-erythritol-4-phosphate (pathway) |
| MLP | = Multilayer Perceptron |
| NPK | = Nitrogen–Phosphorus–Potassium (fertilizer) |
| PI | = Prediction Interval |
| PLSR | = Partial Least Squares Regression |
| RF | = Random Forest |
| RMSE | = Root Mean Square Error |
| SD | = Standard Deviation |
| SHAP | = SHapley Additive exPlanations |
| SVR | = Support Vector Regression |
| TAG | = Triacylglycerol |
| TFC | = Total Flavonoid Content |
| TPC | = Total Phenolic Content |
| XGB | = XGBoost |
AVAILABILITY OF DATA AND MATERIALS
The datasets, together with the Python code, are available from the corresponding author upon reasonable request.
FUNDING
This research was made possible with funding from APNI under the African Plant Nutrition Research Fund (APNRF).
ACKNOWLEDGEMENTS
Declared none.