All published articles of this journal are available on ScienceDirect.

GABA Metabolism and MDA Production in Barley (Hordeum vulgare L.) Seedlings under Salinity and Osmotic Stresses
Authors Info & Affiliations
Abstract
Aim
This study examined the gamma-aminobutyric acid (GABA) shunt pathway in response to salt and osmotic stresses in three barley (Hordeum vulgare L.) genotypes (Acsad176, Athroh, and Rum) in terms of seed germination, seedlings growth, oxidative damage through malondialdehyde (MDA) accumulation as an indicator for reactive oxygen species (ROS), GABA metabolite accumulation, chlorophyll level, total proteins, total carbohydrates and the expression of glutamate decarboxylase gene (GAD) analysis.
Background
GABA is a secondary metabolite that modulates nitrogen metabolism, protects against oxidative damage, and cytosolic pH in response to various abiotic and biotic stress in plants.
Methods
The effects of salt and osmotic stresses imposed by different concentrations of mannitol, sorbitol, and NaCl on the three barley genotypes were studied. Seed germination, seedling length, fresh weight, and dry mass were recorded. The physiological and biochemical responses as per GABA and MDA accumulation, total chlorophyll, proteins and carbohydrates, and the level of GAD expression were also characterized and determined.
Results
Mannitol, sorbitol, and NaCl treatments decreased seed germination and seedling growth for the three barely genotypes used in this study. MDA concentration was increased in seedlings of all genotypes with increasing NaCl, mannitol, and sorbitol concentrations. Acsad 176 showed high GABA accumulation under NaCl treatment. Mannitol treatment significantly increased GABA accumulation in the Rum genotype. All salt and osmotic treatments decreased chlorophyll a and b and carbohydrate content and significantly increased GAD transcription in all barley genotypes. Salt and osmotic stresses affected the total protein content in all genotypes.
Conclusion
Acsad 176 genotype may adapt to NaCl stress by accumulating carbohydrates more than Athroh and Rum. GABA shunt is a crucial signaling and metabolic pathway facilitating barley's adaptation to salt and osmotic stress. In soil with high salt and osmotic contents, the Acsad 176 genotype is the recommended genotype for cultivation.
1. INTRODUCTION
One of the most widely used cereal grains, barley (Hordeum vulgare L.), is grown all over the globe. In addition, barley is highly tolerant to various abiotic challenges, including water scarcity, salt, and high temperatures that negatively influence crop production [1, 2]. Middle Eastern countries are known for their mild wet winters and dry hot summers [3], where barley production varies from year to year depending on the annual rainfall (~30-100 mm in the steppe desert to 600 mm in the highlands), and its distribution during the growing season (October to March) which varies from region to region [3]. In Middle Eastern countries, barley yields are mostly affected by the fluctuations in precipitation throughout the season [4]. The genotype (G), environmental (E), and G by E effects all contribute to the plant phenotype. Environmental stressors profoundly affect seed germination and growth, among other plant-growth stages [5]. About half of the world's irrigated areas are subject to salinity stress, which inhibits growth and reproduction [6]. Salinity impacts plants depending on species, growth stage, and exposure period [7].
One of the secondary stresses caused by salinity, drought, or extreme heat is osmotic stress [8, 9]. Water loss or solute accumulation increases osmotic stress by impairing water absorption and transport from soil solution to root cells [10]. Osmotic stress causes significant changes in plant growth, productivity, cell division, elongation, and many other physiological parameters [11]. Several mechanisms allow plants to respond to osmotic stress. One of these is accumulating the phytohormone abscisic acid (ABA) [12]. Salinity stress has a negative impact on the number of tillers, spike length, spikelet count per spike, plant yield and biomass, root and shoot lengths, germination percentages, and fresh and dry weights [13]. Unlike wheat and other cereal crops, Barley can provide a consistent and profitable harvest even in unfavorable environments. Barley is well-known for its ability to produce a large number of tillers, which cover the soil's surface and limit the quantity of water lost through evaporation [14]. This could explain why barley is more tolerant to drought than maize, wheat, and rice.
According to Bouche et al. [15] and Shelp et al. [16], GABA metabolism shortcut is the GABA shunt, which bypasses two phases of the tricarboxylic acid (TCA) cycle. Mitochondrial GABA transaminase (GABA-T) enzymes, glutamate decarboxylase (GAD), and succinic semialdehyde dehydrogenase (SSADH) are all involved in the GABA shunt [17]. Many studies suggest that GABA may play a role in regulating cytosolic pH, modifying nitrogen and carbon metabolism, and providing protection against oxidative stress [18, 19]. Under oxidative stress and other abiotic conditions, GABA breakdown was expected to decrease the amount of reactive oxygen species that accumulated [18]. Plants subjected to biotic and abiotic stresses rapidly accumulate GABA [18, 20-22]. Insects crawling on leaves raise GABA levels [23]. Wheat under stress (salt and osmotic) had significantly higher GABA levels. Al-Quraan et al. [24] investigated how three wheat genotypes responded to salt and osmotic stress induced by sorbitol, mannitol, and NaCl treatments by characterizing the GABA shunt pathway related to protein and carbohydrate levels. The study outcome showed that GABA accumulation increased the ability of wheat seedlings to grow and develop under salt and osmotic stress. The study showed that the GABA shunt pathway is a key signaling and metabolic pathway that allows wheat to adapt to salt and osmotic stress. Therefore, the objectives of this study were to examine the specific response of three Jordanian cultivated barley cultivars (Acsad, Athroh, and Rum) to salt and osmotic stress induced by NaCl, mannitol, and sorbitol treatments, separately with respect to seed germination, seedling growth, oxidative damage in term of reactive oxygen substances accumulation, GABA accumulation level, proteins and carbohydrates level and characterization of glutamate decarboxylase gene (GAD) expression under salt and osmotic stress conditions.
2. MATERIALS AND METHODS
2.1. Plant Materials and Growth Conditions
Jordan National Agricultural Research Center provided three six-row barley genotypes (Acsad 176, Athroh, and Rum) used in this study, generally grown as feed crops in Middle Eastern countries. Tested genotypes are mainly characterized as the following: Acsad176 (released 1987) is medium in height and produces short spikes; under favorable conditions, it produces vigorous vegetative growth. Athroh (released 2004) is characterized by a medium height and long spikes, long coleoptile, produces vigorous vegetative growth and fresh weight. Rum (released 1986) is characterized by producing many tillers that have short spikes, medium height, early to medium flowering, fast filling, and large grain size. It is adapted and strongly tolerant to drought stress in semi-arid regions of the Middle East. Before treatments, freshly harvested seeds were surface sterilized by suspending seeds in 100% bleach (v/v, 6% sodium hypochlorite) for 5 minutes, followed by washing them five times with sterile distilled water. The experiments were conducted in a controlled environment using a substrate consisting of 50% peat moss and 50% perlite and varying concentrations of sodium chloride (NaCl) (0, 25, 50, 75, 100, and 200 mM), Mannitol (0, 50, 100, 150, 200 and, 300 mM), and Sorbitol (0, 50, 100, 150, 200 and, 300 mM) these concentrations were chosen based on previously published studies [24, 25]. Seedlings were grown in a growth chamber at a constant 25 ºC with continuous illumination (40 mol m-2 s-1) from cool white fluorescent lamps. The three barely genotypes (Acsad 176, Athroh, and Rum) used in this study are cultivated cultivars in Jordan and Middle Eastern countries. All experimental work and plant materials collection were performed to comply with relevant institutional, national, and international guidelines and legislation.
2.2. Seed Germination Rate Under Salinity and Osmotic Stress
Three separate sets of ten surface-sterilized Acsad 176, Athroh, and Rum seeds were placed on two filter papers in each petri dish saturated with different NaCl concentrations for the seed sensitivity assay (0, 25, 50, 75, 100 and 200 mM), separately, mannitol (0, 50, 100, 150, 200, and 300 mM) and sorbitol (0, 50, 100, 150, 200, and 300 mM) were used. Ten days after the seeds were germinated, we recorded the number of radical sprouts that had emerged. The germination rate was determined and compared to that of untreated seeds to assess the influence of NaCl, mannitol, and sorbitol on seed germination. Every measurement was performed in triplicate.
2.3. Determination of Seedling Growth
For each treated seedling from the three barley genotypes, three parameters were measured: seedling length (cm), shoot fresh, and dry weight (g). After 10 days, Acsad 176, Athroh, and Rum were compared to non-treated seedlings to determine plant growth. The seedling's length was measured from the emerging plant at the soil level to the shoot tip using a ruler. Shoot fresh weight (g) was obtained by weighing the shoot of each seedling and shoot dry weight (g) after drying the shoot in the oven at 70 ºC for 24 hours.
2.4. Extraction and Determination of Chlorophyll
The chlorophyll contents (a and b) were determined using a modification of the protocol published earlier [26]. To generate chlorophyll extracts, 250 mg of fresh leaves were combined with 25 mL of 90% ice-cold acetone in a tissue homogenizer. The combination was centrifuged for five minutes at 14,000 rpm (Ace Industries Pvt. Ltd. India). The supernatant was then moved to a separate container for chlorophyll analysis. Using the microplate reader, the extract's absorption was determined at frequencies of 664 nm and 647 nm (Multiskan FC, Thermo-Fisher Scientific, Finland). Then, to calculate the total amount of chlorophyll, we calculated the amounts of chlorophyll a and b using the coefficients of the presented equation. Each measurement was carried out three times.
2.5. Evaluation of Oxidative Damage
Three separate sets of two-week-old seedlings of each barely genotype (Acsad 176, Athroh, and Rum) were grown in synthetic soil and irrigated every day for ten days with 25, 50, 75, 100, and 200 mM NaCl; 50, 100, 150, 200, and 300 mM mannitol, and 50, 100, 150, 200, and 300 mM sorbitol [23-37] separately. After 10 days, the shoots were collected to determine the malondialdehyde (MDA) amount. Malondialdehyde is used as a reference for reactive oxygen species in seedling shoots using the thiobarbiturate reactive substances (TBARS assay) [27]. Using mortar and pestle, 250 mg of tissue was crushed, and then 0.25 mL of 0.5% (w/v) thiobarbituric acid and 0.25 mL of 175 mM NaCl in 50 mM Tris-HCl at pH 8 were added. For 25 minutes, tubes were preheated to 90 °C. The substance was centrifuged for 20 minutes at 15,000 rpm to collect the supernatant. At 532 nm, the absorbance of the supernatant was measured using the microplate reader (Multiskan FC, Thermo-Fisher Scientific, Finland). An MDA standard curve's nmol/mg FW readings were used to determine the MDA concentrations. For each treatment, an average of three replicate sets was determined.
2.6. Extraction and Identification of GABA Metabolite
Three different sets of two-week-old Acsad 176, Athroh, and Rum genotype seedlings were grown in synthetic growth soil and irrigated every day with different concentrations of NaCl, Mannitol, and Sorbitol (see Seed germination rate under salinity and osmotic stress sub-title). The shoots were harvested for GABA level analysis after 10 days. GABA metabolites were extracted according to Zhang and Bown [28] with the following modification:
Shoot tissues (500 mg) of fourteen-day-old seedlings of each genotype treated by NaCl, mannitol, and sorbitol separately were grounded with a mini pestle and mortar and placed in 1.5 mL microcentrifuge tubes. 0.4 mL of methanol was added to each tube, and the samples were mixed for 10 minutes. Liquid from the samples was removed by regular evaporation overnight (tubes were kept open to allow methanol evaporation). Then, 0.5 mL of 70 mM lanthanum chloride was added to each tube. The tubes were mixed for 15 minutes and subsequently centrifuged at 10 000× g for 5 min. The supernatant was removed to new tubes and mixed with 0.16 mL of 1 M potassium hydroxide (KOH). The tubes were mixed for 10 min and then centrifuged at 10 000× g for 5 min. The supernatant containing metabolite was transferred to a new tube to measure the GABA level.
2.7. GABA (γ-Aminobutyric Acid)
Zhang and Bown’s [28] method was used to quantify GABA levels with the following modifications: the reaction mixture contained 50 µL of sample extract, 14 μL of 4 mM NADP+, 19 μL of 0.5 M potassium pyrophosphate at pH 8.6. 10 µL of GABASE (2 U μL-1) (GABASE enzyme powder was suspended in 0.1 M potassium pyrophosphate at pH 7.2 containing 12.5% glycerol and 5 mM β-mercaptoethanol) and 10 μL of α-ketoglutarate. Change in absorbance at 340 nm was recorded after 90 min incubation at 25°C using the microplate reader (Multiskan FC, Thermo-Fisher Scientific, Ratastie, Finland). The content of GABA was determined using the NADPH standard curve. For each treatment, three replicates were conducted.
2.8. RNA Extraction
Total RNA from fresh shoot samples was extracted using the Qiagen RNeasy Plant Mini reagent (Mini-prep, easy-spinTM IIP, Intron Biotechnology, Korea) according to the manufacturer's instructions. Total RNA was suspended in RNase-free water. RNA amounts were determined using a nanodrop spectrophotometer (ND-1000) and their absorbance at A260. The integrity of the RNA was evaluated and imaged using a UV trans-illuminator detection technique after electrophoresis, ethidium bromide staining, and RNA separation on a 1.5% (w/v) agarose gel (UVP BioDoc-It Imaging System. UniGreenScheme, UK).
2.9. Reverse Transcriptase-PCR Measurement of GAD mRNA Expression
According to the experiment, reverse transcriptase-PCR (RT-PCR; Intron Biotechnology, Korea) measurement of steady-state mRNA levels in all barley samples was performed using gene-specific primers for the GAD enzyme gene (reverse primer 5'-CGG TTC TGG AGC TCG GTG GTG AC -3' and forward primer 5'-TGC CGG AGA ACT CGA TCC CCA AG -3'). According to Xu et al. [29], all sequenced GAD genes coming from different plants share a considerable portion of identity. In a one-step RT-PCR procedure, the GAD gene-specific primer pairs developed by Mazzucotelli et al. [30] were applied. SuperScriptTM III, One-Step RT-PCR instrument with platinum® TaqDNA polymerase was used according to the manufacturer's instructions (Intron Biotechnology) as the following: one cycle of reverse transcription reaction (45°C for 30 min) and denaturation of RNA:cDNA hybrid (94°C for 5 min) followed by three step cycling (denaturation (94°C for 30 s), annealing (56°C for 40 s), extension (72°C for 1 min) for 40 cycles then final extension (72°C for 5 min) for one cycle. RT-PCR. On 2% agarose gels, RT-PCR amplified products were sorted and stained with ethidium bromide. For all barley genotypes, the GAD gene expression level was determined by Al-Quraan et al. [31]. To guarantee constant RNA yields, each reaction tube also held an internal standard made up of a primer pair for the 18S RNA (forward primer 5’-CCA CCC ATA GAA TCA AGA AAG AG-3’and reverse primer 5’-GCA AAT TAC CCA ATC CTGAC-3’) as an internal control in each tube was used to normalize the abundance of transcribed GAD RN as outlined by Jarošová and Kundu [32]. Individual cDNA amplicons' levels of RNA expression were measured using the UVP BioDoc-It Imaging System (UniGreenScheme, UK) to determine the fluorescence. The fluorescence value of each DNA band was calculated after the background fluorescence was eliminated from it. To evaluate the amounts of GAD gene expression that happened as a consequence of treatments with NaCl, Mannitol, and Sorbitol, the data were calculated as a Log2 fold change in all three barley genotypes under all treatments.
2.10. Extraction and Determination of Proteins
Acsad 176, Athroh, and Rum genotype seedlings were grown in a soil substrate and watered, as previously mentioned, when they were two weeks old. On day 10 of watering, plant shoots were harvested for protein extraction and quantification using a SMART BCA Protein Assay Kit (Intron Biotechnology, Korea) in agreement with the directions given by the producer, with the necessary modifications made one mL of the working solution was added after 0.05 mL of each treated sample had been collected, and the combination was blended entirely. The samples were then permitted to settle to room temperature after 30 minutes of incubation at 37 °C. The samples' absorbance at 562 nm was measured with a microplate reader (Multiskan FC, Thermo-Fisher Scientific, Finland), and the protein concentrations of each sample were calculated using the BSA reference curve.
2.11. Estimation and Extraction of Total Carbohydrates
Acsad 176, Athroh, and Rum genotypes' two-week-old seedlings were grown in an artificial growth medium and watered as previously described. The shoots of the plants were collected on the 10th day after they were irrigated and then used following Gerhardt [33] with the following modifications: After obtaining 0.05 mL of each treated shoot sample and chilling them on ice, mixing all of the tubes with 0.1 mL of chilled 75% H2SO4, adding 0.2 mL of chilled anthrone solution to each tube, and then placing all of the COD (Chemical Oxygen Demand) tubes in a water bath heated to 100 °C for 15 minutes, the tubes were removed and left to cool at room temperature. Plotting the absorbance recorded at 578 nm using the microplate reader (Multiskan FC, Thermo-Fisher Scientific, Finland) against a glucose standard curve allowed us to estimate the total quantity of carbohydrates in the samples.
2.12. Data Analysis and Experimental Design
This study's experiments were all completely randomized (CRD). Every assay was performed in three replicates. Calculations were made to determine the mean and standard deviation (SD) for each trait of every experiment. The findings were reported using mean and standard deviation. One-way analysis of variance (ANOVA), normality tests, and multiple comparison tests using the Least Significant Difference (LSD) were used to analyze the data. The SPSS version 16.0 software was used for all statistical analyses. P-values equal to or less than 0.05 were considered significant in all data analyses, and P-values equal to or less than 0.01 were considered highly significant.
3. RESULTS
3.1. Sensitivity of Barley Seed Germination to Osmotic Stress and Salinity
Under salinity and osmotic stress, germination rates were measured in Acsad 176, Athroh, and Rum (Table 1). In the control treatment, the germination percentage was 100% in Acsad 176, 97% in Athroh, and 93% in Rum. The germination percentages of Acsad 176, Athroh, and Rum decreased significantly with a negative correlation within genotype when different levels of sorbitol, NaCl, and mannitol were increased, respectively (Table 1). Athroh germination was decreased under osmotic stress (mannitol) (P = 0.022), with the highest germination reduction (30%) under 300 mM mannitol compared to control. According to the data, Athroh showed a 20% decrease in germination when exposed to 300 mM sorbitol (P = 0.002) and a 27% reduction under 200 mM NaCl (P = 0.005). Under salinity (NaCl) and osmotic stress (mannitol and sorbitol), Acsad 176 showed a modest reduction in germination where the reduction under 300 mM sorbitol (P = 0.034) reached 15% and 20% reduction under 300 mM mannitol (P = 0.002) and 200 mM NaCl stress (P = 0.028). According to our findings, Rum is more responsive to sorbitol treatment compared to other treatments (NaCl and mannitol). Rum germination was reduced to 30% under 300 mM sorbitol, 23% under 200 mM NaCl, and 17% under 300 mM mannitol.
3.2. Barley Seedlings Growth Under Salt and Osmotic Stress
The three barley genotypes showed no significant differences in seedling length under osmotic and salt stresses, except Acsad 176 had a significant reduction in seedling length with increasing concentrations of mannitol (P = 0.012) and sorbitol (P = 0.005) (Table 2). These results might be due to the short duration of treatment (10 days), which might not be enough to have an observed significant effect on seedling length.
| [mM] | Acsad 176 | Athroh | Rum |
|---|---|---|---|
| Control | 100.00 | 96.67 | 93.33 |
| NaCl 25 | 100.00 | 93.33 | 90.00 |
| NaCl 50 | 100.00 | 96.67 | 80.00 |
| NaCl 75 | 96.67 | 83.33 | 76.67 |
| NaCl 100 | 86.67 | 76.67 | 76.67 |
| NaCl 200 | 86.67 | 66.67 | 70.00 |
| P | 0.028* | 0.005** | 0.013* |
| r | -0.859 | -0.944 | -0.904 |
| Mannitol 50 | 100.00 | 93.33 | 93.33 |
| Mannitol 100 | 93.33 | 86.67 | 90.00 |
| Mannitol 150 | 86.67 | 70.00 | 90.00 |
| Mannitol 200 | 83.33 | 66.67 | 86.67 |
| Mannitol 300 | 80.00 | 63.33 | 76.67 |
| P | 0.002** | 0.022* | 0.001** |
| r | -0.963 | -0.877 | -0.983 |
| Sorbitol 50 | 100.00 | 93.33 | 90.00 |
| Sorbitol 100 | 100.00 | 86.67 | 90.00 |
| Sorbitol 150 | 93.33 | 83.33 | 80.00 |
| Sorbitol 200 | 90.00 | 83.33 | 73.33 |
| Sorbitol 300 | 90.00 | 73.33 | 63.33 |
| P | 0.034* | 0.002** | 0.002** |
| r | -0.845 | -0.968 | -0.969 |
| [mM] | Acsad 176 | Athroh | Rum |
|---|---|---|---|
| Control | 19.33 | 19.33 | 18.67 |
| NaCl 25 | 19.00 | 18.67 | 18.00 |
| NaCl 50 | 18.67 | 18.67 | 17.67 |
| NaCl 75 | 17.67 | 19.67 | 17.33 |
| NaCl 100 | 18.00 | 18.33 | 18.00 |
| NaCl 200 | 19.00 | 18.33 | 18.00 |
| P | 0.73 | 0.294 | 0.61 |
| r | -0.182 | -0.517 | -0.266 |
| Mannitol 50 | 18.33 | 16.33 | 17.67 |
| Mannitol 100 | 17.67 | 18.67 | 18.00 |
| Mannitol 150 | 18.67 | 18.00 | 16.67 |
| Mannitol 200 | 17.33 | 17.33 | 17.33 |
| Mannitol 300 | 16.00 | 18.00 | 17.67 |
| P | 0.012* | 0.798 | 0.446 |
| r | -0.908 | -0.136 | -0.389 |
| Sorbitol 50 | 19.00 | 19.00 | 17.67 |
| Sorbitol 100 | 18.00 | 18.00 | 17.00 |
| Sorbitol 150 | 18.00 | 17.00 | 18.33 |
| Sorbitol 200 | 17.33 | 16.67 | 18.00 |
| Sorbitol 300 | 16.67 | 18.00 | 18.67 |
| P | 0.005** | 0.322 | 0.526 |
| r | -0.945 | -0.492 | 0.328 |
Barley genotypes showed no significant difference in fresh weight under salt and osmotic stresses. Acsad 176, Athroh, and Rum, NaCl (P = 0.432, 0.083, and 0.124), mannitol (P = 0.162, 0.487, and 0.026), and sorbitol (P = 0.188, 0.18, and 0.265), respectively, but there is a negative correlation of fresh weight and increasing stress levels in the three barley genotypes (Table 3).
Salt and osmotic stress decreased plant dry weight in Acsad 176, Athroh, and Rum compared with the control treatment (Table 4). In the control treatment, the dry weight of plant was 0.29 g in Acsad 176, 0.28 g in Athroh, and 0.29 g in Rum. The dry weight under NaCl treatment of Acsad 176, Athroh, and Rum were negatively correlated with increasing stresses of NaCl (r = -0.713, -0.652, and -0.641), mannitol (r = -0.706, -0.66, and -0.809), and sorbitol (r = -0.714, -0.627, and -0.683), respectively.
| [mM] | Acsad 176 | Athroh | Rum |
|---|---|---|---|
| Control | 0.64 | 0.49 | 0.75 |
| NaCl 25 | 0.55 | 0.49 | 0.92 |
| NaCl 50 | 0.55 | 0.35 | 1.06 |
| NaCl 75 | 0.76 | 0.4 | 0.62 |
| NaCl 100 | 0.47 | 0.4 | 0.78 |
| NaCl 200 | 0.5 | 0.34 | 0.45 |
| P | 0.432 | 0.083 | 0.124 |
| r | -0.4 | -0.755 | -0.696 |
| Mannitol 50 | 0.73 | 0.75 | 0.99 |
| Mannitol 100 | 0.97 | 0.8 | 0.73 |
| Mannitol 150 | 0.93 | 0.66 | 0.46 |
| Mannitol 200 | 0.52 | 0.63 | 0.35 |
| Mannitol 300 | 0.3 | 0.5 | 0.21 |
| P | 0.162 | 0.487 | 0.026* |
| r | -0.651 | -0.357 | -0.865 |
| Sorbitol 50 | 0.77 | 0.43 | 0.72 |
| Sorbitol 100 | 0.72 | 0.76 | 0.51 |
| Sorbitol 150 | 0.72 | 0.76 | 0.32 |
| Sorbitol 200 | 0.8 | 0.71 | 0.52 |
| Sorbitol 300 | 0.46 | 0.51 | 0.49 |
| P | 0.188 | 0.88 | 0.265 |
| r | -0.621 | -0.18 | -0.544 |
| [mM] | Acsad 176 | Athroh | Rum |
|---|---|---|---|
| Control | 0.29 | 0.28 | 0.29 |
| NaCl 25 | 0.16 | 0.14 | 0.16 |
| NaCl 50 | 0.13 | 0.14 | 0.13 |
| NaCl 75 | 0.13 | 0.12 | 0.13 |
| NaCl 100 | 0.1 | 0.12 | 0.12 |
| NaCl 200 | 0.1 | 0.11 | 0.12 |
| P | 0.112 | 0.161 | 0.17 |
| r | -0.713 | -0.652 | -0.641 |
| Mannitol 50 | 0.16 | 0.13 | 0.2 |
| Mannitol 100 | 0.14 | 0.12 | 0.16 |
| Mannitol 150 | 0.14 | 0.1 | 0.14 |
| Mannitol 200 | 0.14 | 0.09 | 0.13 |
| Mannitol 300 | 0.11 | 0.09 | 0.11 |
| P | 0.177 | 0.154 | 0.051 |
| r | -0.706 | -0.66 | -0.809 |
| Sorbitol 50 | 0.15 | 0.15 | 0.14 |
| Sorbitol 100 | 0.14 | 0.1 | 0.13 |
| Sorbitol 150 | 0.13 | 0.1 | 0.1 |
| Sorbitol 200 | 0.12 | 0.1 | 0.083 |
| Sorbitol 300 | 0.1 | 0.1 | 0.09 |
| P | 0.111 | 0.183 | 0.135 |
| r | -0.714 | -0.627 | -0.683 |
3.3. Response of Chlorophyll to Osmotic and Salt Stress
In all barley genotypes studied, chlorophyll a and b content significantly decreased when exposed to salt and osmotic pressure (Tables 5 and 6). Athroh showed a significant decrease of chlorophyll a content under mannitol treatment (P = 0.011), which was correlated with a low level of GABA accumulation under 300 mM mannitol, indicating the lethal effect of high mannitol level on Athroh genotype. Acsad 176 showed a high chlorophyll-a level under NaCl stress (P = 0.009), which was associated with high GABA accumulation under 200 Mm NaCl treatment. Furthermore, Rum revealed a relation between GABA levels and chlorophyll content under 300 mM mannitol treatment (P = 0.046).
| [mM] | Acsad 176 | Athroh | Rum |
|---|---|---|---|
| Control | 8.82 | 7.27 | 8.52 |
| NaCl 25 | 8.83 | 6.35 | 8.04 |
| NaCl 50 | 8.73 | 6.12 | 7.83 |
| NaCl 75 | 7.91 | 5.84 | 7.69 |
| NaCl 100 | 7.42 | 5.07 | 7.15 |
| NaCl 200 | 7.07 | 5.11 | 6.22 |
| P | 0.009** | 0.029* | 0.001** |
| r | -0.92 | -0.857 | -0.991 |
| Mannitol 50 | 9.00 | 3.28 | 8.33 |
| Mannitol 100 | 8.36 | 2.59 | 7.91 |
| Mannitol 150 | 8.03 | 2.10 | 7.54 |
| Mannitol 200 | 7.32 | 1.55 | 6.56 |
| Mannitol 300 | 7.40 | 1.37 | 6.91 |
| P | 0.031* | 0.011* | 0.046* |
| r | -0.853 | -0.727 | -0.819 |
| Sorbitol 50 | 9.43 | 6.97 | 5.39 |
| Sorbitol 100 | 8.28 | 6.62 | 4.80 |
| Sorbitol 150 | 7.87 | 6.06 | 4.54 |
| Sorbitol 200 | 7.33 | 5.71 | 4.30 |
| Sorbitol 300 | 6.65 | 5.50 | 3.26 |
| P | 0.011* | 0.011* | 0.049* |
| r | -0.915 | -0.912 | -0.807 |
| [mM] | Acsad 176 | Athroh | Rum |
|---|---|---|---|
| Control | 4.63 | 4.71 | 5.4 |
| NaCl 25 | 4.96 | 3.99 | 5.10 |
| NaCl 50 | 3.83 | 3.14 | 3.20 |
| NaCl 75 | 3.24 | 2.59 | 2.29 |
| NaCl 100 | 2.88 | 1.73 | 1.91 |
| NaCl 200 | 2.15 | 0.96 | 1.12 |
| P | 0.008** | 0.004** | 0.016* |
| r | -0.927 | -0.948 | -0.893 |
| Mannitol 50 | 3.89 | 2.88 | 5.66 |
| Mannitol 100 | 3.54 | 2.33 | 4.52 |
| Mannitol 150 | 2.3 | 1.147 | 3.39 |
| Mannitol 200 | 1.26 | 0.87 | 2.04 |
| Mannitol 300 | 0.98 | 0.57 | 1.51 |
| P | 0.013* | 0.038* | 0.01** |
| r | -0.907 | -0.837 | -0.917 |
| Sorbitol 50 | 3.73 | 4.03 | 3.77 |
| Sorbitol 100 | 2.75 | 3.65 | 2.64 |
| Sorbitol 150 | 2.48 | 2.89 | 1.35 |
| Sorbitol 200 | 1.35 | 1.27 | 0.85 |
| Sorbitol 300 | 0.67 | 0.98 | 0.59 |
| P | 0.006** | 0.01** | 0.034* |
| r | -0.937 | -0.919 | -0.846 |
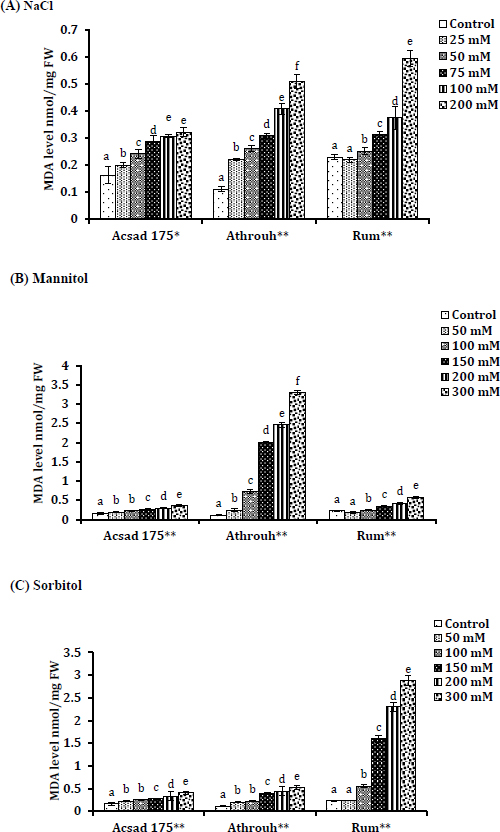
3.4. Salt and Osmotic Stress Cause Oxidative Damage in Barley Seedlings
The amount of oxidative damage, reactive oxygen species (ROS), and lipid peroxidation in barley seedlings under the investigated conditions is reflected in the outcomes of our investigation, which were determined based on the level of malondialdehyde (MDA) accumulation. In the barley seedlings of the Acsad 176, Athroh, and Rum genotypes, the concentrations of MDA increased with increasing amounts of NaCl (r = 0.889, 0.965, and 0.98), mannitol (r = 0.976, 0.944, and 0.64), and sorbitol (r = 0.974, 0.923, and 0.935), respectively. The data show that Acsad 176 had the least MDA accumulation under salt stress (NaCl) compared with other genotypes (P = 0.019) (Fig. 1a), which might indicate a low ROS level in Acsad 176 tissue under NaCl treatments due to physiological adaptation by Acsad 176 genotype to salt stress. Athroh showed the highest MDA accumulation under 300 mM of mannitol (P = 0.005), which is an indicator of oxidative damage that is created in response to osmotic stress (mannitol) (Fig. 1b). Rum, on the other hand, demonstrated the highest MDA accumulation during sorbitol-induced osmotic stress (P = 0.006) (Fig. 1c).
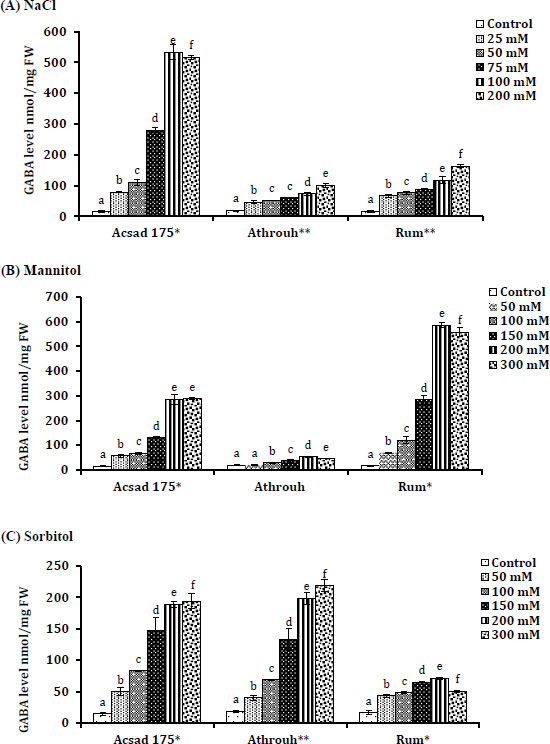
3.5. GABA Levels in Barley Seedlings Under Salt and Osmotic Stress
GABA levels significantly increased and positively correlated in the three barley genotypes as the levels of NaCl (r = 0.876, 0.967, and 0.964), mannitol (r = 0.89, 0.79, and 0.872), and sorbitol (r = 0.879, 0.918, and 0.615), respectively (Fig. 2A). Athroh showed a significant increase in GABA metabolite accumulation under 300 mM sorbitol (P = 0.010) compared to the control. No significant increase of GABA accumulation in Athroh genotype under mannitol treatments (P = 0.061) (Fig. 2B), which indicates that Athroh tolerates osmotic stress-induced via sorbitol possibly by the synthesis of GABA rather more than osmotic stress caused on by treatment with mannitol (Fig. 2C). The Acsad 176 genotype showed high GABA accumulation under 200 mM NaCl treatment (P = 0.022) (Fig. 2A), which indicates a higher tolerance of Acsad 176 genotype to salt stress compared to other barley genotypes. Under 300 mM mannitol, there was a highly significant increase in GABA accumulation in Rum (P = 0.024). This suggests that, compared to treatments with NaCl and sorbitol, Rum is more tolerant of high concentrations of mannitol due to highly significant GABA accumulation (Fig. 2).
3.6. GAD mRNA Transcripts in Barley Under Osmotic and Salt Stress
Regarding seed germination, the level of GAD RNA transcription correlates with the response to salt and osmotic treatments (Table 1). This study demonstrated MDA accu- mulation (Fig. 1) and GABA accumulation (Fig. 2). Under salt and osmotic stress, the transcription level of GAD significantly increased (P ≤ 0.05) in all treated barley genotypes tested in this investigation (Acsad 176, Athroh, and Rum) (Fig. 3). The GAD improves decarboxylation of glutamate to CO2 and GABA. Rum genotypes subjected to osmotic stress (mannitol) had significant levels of GAD expression (Fig. 3B), which was consistent with the high amount of GABA accumulation (mannitol). Acsad 176 genotype showed high GAD expression under NaCl stress (Fig. 3A), consistent with the high level of GABA accumulation under the same conditions. GAD expression in Athroh, on the other hand, was lower under mannitol because GABA accumulation and germination were low under the same conditions. This suggests that mannitol has a negative effect on Athroh shoot tissue, in contrast to high GAD expression under NaCl and sorbitol treatments (Fig. 3C). Rum genotype responded to salt and osmotic stresses with moderately significant GAD expression and GABA accumulation (Fig. 3). Under mannitol, the highest GAD expression was found (Fig. 3B). This demonstrates that the GABA shunt was activated in response to stressors based on metabolite production and GAD expression (salt and osmotic).
3.7. Barley Protein Level Under Salt and Osmotic Stress
Protein content demonstrated a significant difference among Acsad 176, Athroh, and Rum responses to stresses (salt and osmotic) (Fig. 4). The protein concentration in Rum was the highest under 50 mM NaCl treatment (Fig. 4A). Rum showed no significant difference in protein level under mannitol stress (P = 0.378) (Fig. 4B), which is correlated with high GABA accumulation in response to mannitol. This result indicated that mannitol treatments did not affect Rum's protein content. The protein level in Rum significantly decreased under sorbitol (P = 0.034) treatment (Fig. 4C). This observation could be attributed to the deadly effect of high-concentration NaCl and sorbitol treatments on barley. According to protein accumulation, Rum genotype is more tolerant to high mannitol concentrations than Acsad 176 and Athroh (Fig. 4). Our data showed the highest protein content in Athroh compared to the control treatment. Athroh’s protein content was significantly reduced by mannitol treatment (P = 0.045), which was negatively correlated with low GABA accumulation under osmotic stress (mannitol) (r = -0.785). This finding suggested that Athroh is less tolerant to high mannitol concentrations than NaCl and sorbitol through protein accumulation under stress treatments. Protein content in Acsad 176 did not differ significantly in response to NaCl stress (P = 0.356). On the other hand, Acsad 176 was strongly affected under mannitol stress, which was observed by reduced protein content (r= -0.921, P = 0.009).


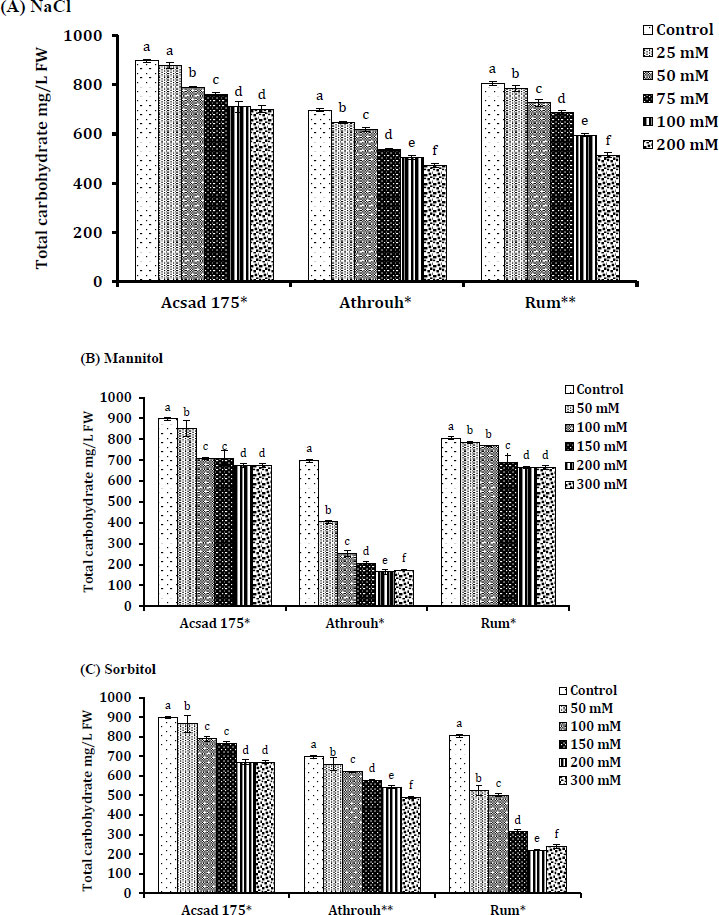
3.8. Carbohydrates Level Under Salt and Osmotic Stress in Barley
Carbohydrate content in Acsad 176, Athroh, and Rum was significantly decreased under salt and osmotic stress (Fig. 5). Acsad 176 showed a significant decrease in carbohydrate content under salt treatment (NaCl) (P = 0.023) compared with mannitol (P = 0.048) and sorbitol stress (P = 0.02). According to the findings of this study, Acsad 176 may adapt to salt stress (NaCl) by accumulating carbohydrates more than Athroh and Rum genotypes (Fig. 5A). Carbohydrate concentration in Rum was decreased significantly under osmotic stress (sorbitol) (P = 0.049) (Fig. 5C), which was correlated with low GABA accumulation in Rum tissue under sorbitol treatment. Athroh genotype showed a significant decrease under osmotic stress (mannitol) (P = 0.021) (r= -0.726) (Fig. 5B).
4. DISCUSSION
Several studies have found that abiotic stresses cause serious harm to the growth of crops and lead to yield reduction [14, 21]. The growth of roots and shoots in salt-sensitive plants was significantly reduced under an external osmotic stress solution [34, 35]. This was consistent with the findings of Al-Quraan et al. [24] on wheat (T. astivum), which reported a reduction in germination % under salinity and osmotic stress (sorbitol & maintol) compared to control. Jain et al. [36] confirmed that sorbitol causes a decrease in maize (Zea maize) seedling growth parameters due to osmotic stress. Sorbitol, which can be taken up by plant cells, is one of the components of seeds required for germination [37]. Furthermore, Al-Quraan et al. [22] observed seed sensitivity and decreased seed germination in various wheat and barely cultivars exposed to different NaCl treatments. Despite the fact that numerous research studies have shown a beneficial relationship between salinity and fresh weight, contradicted results showed a detrimental relationship between salt stress and fresh weight. Other studies have found different outcomes, including the one conducted by Niaz et al. [38]. These researchers found that applying 200 mM of sodium chloride to seabeet (Beta maritima) and fodderbeet (Beta vulgaris L.) significantly increased the dry weight of the shoot system for both beet species. On the other hand, our findings found that the sodium chloride treatment had the opposite effect. Taken together, salt and osmotic stress had a negative impact on seed germination and seedling growth in all barely genotypes.
The rate of photosynthesis and how much dry matter is produced by plants under stress can be estimated from their total chlorophyll content. Researchers discovered that the content of chlorophyll is significantly correlated positively with grain yield [39]. A reduced chlorophyll content will result in a decreased rate of photosynthesis, which will then lead to a lower production of dry matter and a lower crop yield. Balota et al. [40] identified tolerant genotypes concerning more leaf chlorophyll retention under stress conditions. Wheat genotypes exposed to long-term soil salinity (NaCl) caused impaired and deteriorated effects on membrane stability index, carotenoids, proline, chlorophyll, soluble sugar, superoxide dismutase, and biomass and grain yield [41]. Chlorophyll biosynthesis was reduced in Zea mays L. under low temperatures due to the damaged development of thylakoid membranes [42]. Rao and Rao [43] reported a reduction of chlorophyll contents when the plant is under salt and osmotic stress through enhancing the activity of the chlorophyllase enzyme, which is responsible for the degradation of chlorophyll pigments. Abiotic stress activated the deterioration of chloroplast structure and reduced the photosynthesis rate.
Due to membrane lipid peroxidation, the amount of MDA accumulation in plant tissues under stress increased [27]. This accumulation of MDA under salt and osmotic stress is consistent with other investigations that found a significant concentration of MDA accumulating in wheat shoots under conditions in which they were subjected to osmotic and salt stress [24]. Variations in MDA concentrations were also found in rice (Oryza sativa L) [44]. Under salt stress, lipid peroxidation in both shoots and root tissues increased in barley genotypes. In addition, Bor et al. [45] described that lipid peroxidation increased in two beet species under salt stress. It was discovered by Flores et al. [37] that individual molecules of sorbitol can be taken up by plant cells. As a result, the three genotypes of barley (Acsad 176, Athroh, and Rum) were not impacted by the treatment with 50 mM sorbitol, as demonstrated in Fig. (1C). Alfalfa (Medicago sativa L.) plants showed a high accumulation of MDA under stress (different concentrations of NaCl) [46]. Maize genotypes demonstrated a growth loss at several growth stages when exposed to salt stress [47]. Moreover, Chen et al. [48] discovered that differing saline systems in hydroponic culture resulted in a growth reduction of the Oryza sativa genotype [49].
The levels of GABA found in plant tissue tend to rise in response to environmental stressors such as dryness, darkness, and hypoxia [18, 19]. Renault et al. [50] concluded that Gamma-aminobutyric acid (GABA) was readily accumulated at the whole plant level during NaCl application in Arabidopsis thaliana. In addition, the activity of GABA transaminase (GABA-TP), which is utilized as an indicator to evaluate the concentration of GABA, rapidly rose in Arabidopsis seedlings in response to treatment with 150 mM NaCl. This was the case even though the seedlings had been exposed to the same amount of salt. This was observed as a consequence of the seedlings being exposed to a high salt concentration [50]. Mazzucotelli et al. [30] displayed that the GABA shunt metabolite highly accumulated in wheat and barley genotypes when subjected to the stresses of cold and freezing temperatures. The levels of GABA accumulation were found to be closely proportional to the amount of stress that was endured during the treatments. The accumulation of GABA is promoted when non-hardened plants are subjected to exogenous glutamate in a low-temperature environment [30]. According to Al-Quraan et al. [24], wheat genotypes were subjected to salt and osmotic stress, which increased the accumulation of GABA. In agreement with our findings, Rentsch et al. [51] reported that GABA was the only non-amino acid intermediary of the GABA shunt that increased when subjected to osmotic stress. Wheat seedlings exposed to 20% polyethylene glycol 6000 for 28 hours as an osmotic stressor experienced a considerable increase in GABA buildup [52].
Numerous studies have found evidence to support the concept that GAD and GABA may be components of a signal transduction pathway activated in crops when they are subjected to a stressful environment [53]. Mclean [54] reported overexpression of glutamate decarboxylase in transgenic tobacco plants (Nicotiana tabacum) in response to root-knot nematode exposure and heat shock [20]. Data showed that GAD expression levels increased in wheat genotype seedlings under NaCl, mannitol, and sorbitol treatments [24]. In conformity with our findings, GAD activity significantly increased in response to a NaCl stressor, which was correlated with a rise in GAD gene expression in an Arabidopsis thaliana CMSII case. On the contrary, GABA accumulation in Arabidopsis seedlings was prevented under heat stress due to disruption of the GAD1 gene [15]. In this study, the expression of GAD in the three barley cultivars was significantly induced in a similar pattern under salt and osmotic stressors. However, the variation in GABA levels in the three barley cultivars under salt and osmotic treatments is explained by the depletion of GABA into carbon and nitrogen metabolism through the interconnection with the TCA cycle. GABA consumption is significantly critical to maintain the C:N homeostasis under salt and osmotic stress in barley seedlings.
This study found that under salt and osmotic stress, barley seedlings accumulated more GABA, higher MDA levels, and lower protein contents. The findings of this research offer substantial support for the proposition that plants may be more resistant to abiotic stress caused by salt and osmotic treatments if they have GABA as part of their metabolism. Protein production in plants may respond differently to environmental stress [55]. The presence of abiotic stresses negatively impacted the growth, development, and yield of the crop. It has been discovered that plant stress adaptation occurs through changes in gene expression, which modify plant phenotypes. Plants showed different mechanisms at the transcriptional and enzymatic activity levels, overlapping patterns in the reactions of the adaptive mechanisms to various stresses. In agreement with our study, two cotton genotypes revealed a significant decrease in soluble protein concentrations under 50 and 100 mM NaCl treatments [56]. In addition, the protein concentrations of actin-depolymerizing factor, superoxide dismutase, and salt-induced protein in rice were altered as a result of drought and osmotic stress [57]. Some plants excrete glycine-betaine (GB) in response to abiotic stress (salt and drought stress), where the plant cells accumulate GB for stabilizing the quaternary structure of protein complexes and membrane structures against various abiotic stresses [58]. Furthermore, GB increases the ability of plant cells to save water without disturbing normal cellular function. GB accumulation in transgenic apple expressed Osmyb4 gene, which is a stress regulator gene, was linked to high cold and drought tolerance [58].
Furthermore, our findings revealed a strong connection between carbohydrate metabolism and GABA accumulation. This suggests that GABA may function as a regulatory metabolic molecule in the tricarboxylic acid (TCA) cycle and C:N assimilation during adaptation to salt and osmotic treatments in barely seedlings. Many studies have shown that the carbohydrate content of the shoot system is decreased under various abiotic stresses [59-61]. Also, Chen et al. [59] noticed a decrease in carbohydrate content in the roots of irrigated plants. Plants can switch between their primary and secondary routes of biochemical glucose metabolism when these conditions are present [60], even though numerous studies have demonstrated that stress has a beneficial effect on the amount of carbohydrates in the body and the metabolism. The state of carbohydrates in the reproductive structures of crops can become more unstable when there is a drought. Oligosaccharides were also observed to accumulate in various plants when placed under the stress of a low temperature. Plants respond to environmental stresses by adjusting their nutrient uptake and metabolism [18]. GABA metabolism is included in regulating C:N equilibrium by regulating nitrate uptake, sugar level, and internal N assimilation in response to stress. This study highlighted the direct metabolic role of GABA in the metabolism of amino acids and sugars, as well as in the transport and storage of carbon and nitrogen, the assimilation of carbon from glutamate, and the generation of carbon and nitrogen fluxes that enter the TCA cycle. In response to salt and osmotic stress treatments, GABA accumulation correlated with increased total carbohydrates and protein levels.
CONCLUSION
Acsad 176, Athroh, and Rum barley genotypes used in this research had a clear relationship between GABA accumulation, germination %, chlorophyll content, MDA level, total protein, and carbohydrate contents (i.e., a significant increase in GABA concentration in Rum genotype under mannitol treatment with an increase of GAD mRNA transcription, chlorophyll content, MDA concentration, proteins and carbohydrates contents under the same treatments). The data recommends that a GABA metabolite may act as a protective molecule in carbohydrate metabolism in conjunction with a variety of physiological responses when plants are treated with salt and osmotic stress. This hypothesis is strengthened by the fact that the metabolite is produced when crops are exposed to salt and osmotic stress. To understand more about how GABA shunt metabolic signaling works in numerous crops, more research is required to determine how it influences diverse physiological processes in response to shifts in both the environment and the genes themselves. According to the outcomes of our research, Acsad 176 barley genotype is the most suitable variety to be grown in soil with high levels of salt and osmotic content.
LIST OF ABBREVIATIONS
| ABA | = Abscisic acid |
| ANOVA | = analysis of variance |
| BSA | = Bradrord protein assay |
| DNA | = Deoxyribonucleic acid |
| cDNA | = complementary DNA |
| CRD | = Completely randomized |
| C:N | = Carbon-to-nitrogen ratio |
| E | = Environment |
| G | = Genotype |
| GABA | = Gamma-Aminobutyric acid |
| GABA-T | = 4-aminobutyrate aminotransferase |
| GAD | = Glutamate decarboxylase |
| GB | = Glycine-betaine |
| KOH | = Potassium hydroxide |
| LSD | = Least Significant Difference |
| MDA | = Malondialdehyde |
| NADPH | = Nicotinamide adenine dinucleotide phosphate |
| RNA | = Ribonucleic acid |
| ROS | = Reactive oxygen species |
| RT-PCR | = Reverse transcription polymerase chain reaction |
| SD | = Standard deviation |
| NaCl | = Sodium chloride |
| SSADH | = Succinate semialdehyde dehydrogenase |
| TBARS | = Thiobarbiturate reactive substances |
| TCA | = Tricarboxylic acid |
CONSENT FOR PUBLICATION
Not applicable.
AVAILABILITY OF DATA AND MATERIALS
Data and material produced and/or analyzed during the present study are available from the corresponding author [Z.A-A] upon reasonable request.
FUNDING
The study has been funded by the Deanship of Research at Jordan University of Science and Technology (grant number 234,2016).
CONFLICT OF INTEREST
The authors declare no conflict of interest, financial or otherwise.
ACKNOWLEDGEMENTS
Declared none.

