All published articles of this journal are available on ScienceDirect.

Morphological, Physical and Chemical Characteristics of Soils under Three Geological Formations in some Parts of Ogun State, Nigeria, and their Agricultural Potentials
Authors Info & Affiliations
Abstract
Background:
Understanding soil characteristics is crucial for optimizing soil health, agricultural productivity, and implementing effective soil management practices.
Objective:
The objectives of this study were to characterize the morphological, physical and chemical properties of the soils, developed on three different geological formations.
Methods:
The study was conducted in the three geological formations, viz; Basement complex rocks, Coastal Plain Sand and Ewekoro Formation. Soil samples were collected from the pedogenic horizons of each profile pit and replicated into well-labeled polyethylene bags. The profile pits were described morphologically and soil samples were analyzed for their physical and chemical properties.
Results:
The results indicated that there were no significant physical constraints hindering agricultural activities in the studied areas. Based on the mean values across geological formations, the soils exhibited favorable pH levels, total nitrogen content, soil organic matter, and exchangeable cations, all of which were conducive to crop production. However, the availability of phosphorus was found to be inadequate. Furthermore, the chemical properties of the soils were ranked in the order of basement complex > coastal plain sand > Ewekoro formation, and upper slope > middle slope > lower slope.
Conclusion:
The soils require fertilizers that are deficient in nitrogen and potassium but rich in phosphorus, to optimize crop growth and productivity. To sustain soil fertility, a comprehensive soil management approach is recommended, which includes the incorporation of both organic and inorganic amendments. Effective practices for managing organic residue and promoting cropping systems such as crop rotation and intercropping, especially involving legumes, are essential. These strategies can help maintain soil fertility over time. Additionally, regular soil tests for fertility evaluation are crucial and should be conducted every two years, particularly after continuous cropping.
1. INTRODUCTION
Ogun State is situated in southwestern Nigeria and is known for its diverse geological formations. These formations include the Basement Complex, the Coastal Plain Sands, and the Alluvial Deposits. Each of these geological formations possesses unique soil characteristics due to variations in parent materials, weathering processes, and sedimentation patterns. The Basement Complex comprises ancient crystalline rocks, while the Coastal Plain Sands are predominantly composed of marine sediments. On the other hand, the Alluvial Deposits are derived from the deposition of sediments by rivers and streams. Understanding the soil characteristics within these formations is crucial for optimizing agricultural productivity, determining suitable crops, and implementing effective soil management practices. Characterization of soils provides useful information for the assessment and monitoring of the soil quality status and behaviour of soils [1].
Understanding the morphological characteristics of soils is essential for assessing their suitability for different agricultural practices. Factors such as soil texture, structure, color, and depth provide insights into soil formation processes and potential limitations for cultivation. Chemical characteristics involve analyzing soil pH, nutrient content (such as nitrogen, phosphorus, and potassium), organic matter content, and cation exchange capacity (CEC), providing insights into soil fertility, nutrient cycling, and potential limitations. The reason behind this is that soil fertility is typically determined by the quantity of nutrients present in the soil. During the initial stages of soil formation (known as pedogenesis), the chemical makeup of the soil is largely influenced by the composition of the parent materials derived from geological sources. However, as the soil matures, its chemical composition is significantly shaped by the processes of weathering in the surrounding environment [2].
Over time, the composition of the soil gradually deviates from that of the parent material due to the influence of pedogenic processes, that are determined by factors such as vegetation, topography, and, most notably, climate. This divergence occurs because elements within the soil are redistributed throughout its structure, both vertically between different layers (horizons) and horizontally across various soils within the landscape [3].
Consequently, it becomes imperative to conduct comprehensive studies to characterize these soils, particularly within different geological formations [4]. These studies are essential to gain a deeper understanding of the properties and potential fertility of the soils in question.
By examining these soil characteristics in the context of agricultural potentials, we can identify suitable crop types, determine optimal fertilizer requirements, and develop strategies for sustainable land management practices. This research contributes to the existing knowledge on the soil composition in Ogun State and provides valuable information for farmers, land planners, and policymakers to make informed decisions regarding land use, crop selection, and soil conservation practices. Ultimately, the aim is to promote sustainable and productive agriculture in Ogun State, Nigeria, by harnessing the agricultural potentials of different soil types and geological formations. Therefore, the objectives of this study were to characterize the morphological, physical and chemical properties of the soils developed in three different geological formations.
2. MATERIALS AND METHODS
2.1. Description of the Study Area
The study was conducted in the three geological formations that were of interest in this research, which were Basement complex rocks, Coastal Plain Sand and the Ewekoro Formation. The sites chosen were Lanlate, Akute and Ewekoro for Basement complex rocks, Coastal Plain Sand and Ewekoro Formation, respectively.
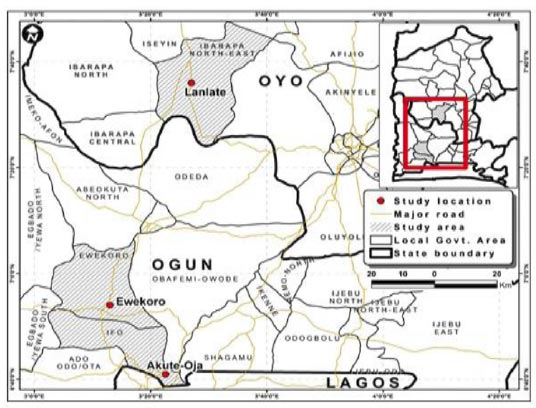
Lanlate (Fig. 1) falls within latitude 7o 350 N and 70 450 N and longitude 30 400E. The region is bounded in the North by Oke -Ogun area of Oyo State, to the west and south by Ogun State of Nigeria. It is found within the tropical hinterland climatic belt, based on latitudinal location of Lanlate. . There is a double maxima of rainfall, especially in the southern part bordering Ibadan in the Oyo State region. The annual rainfall is between 1500 mm and 2000 mm. Relative humidity is over 80% in the morning and falls to between 50% and 70% in the afternoon. The mean annual temperature range is 80OC. Despite age-long human interference with the original forest vegetation, the area is able to retain the forest vegetation species. Species are more abundant than grasses in Lnlatte tree. The forest reserve in the region remains the major remnant of the original vegetal cover in the area.
Akute is situated in Ifo Local Government of Ogun State, Nigeria. It is a major boundary between Lagos and Ogun State. Its geographical coordinates are 6° 40' 56” North, 3° 22' 34” East and its original name is Akute-Oja. The area has very high annual rainfall exceeding 2000 mm annually. Sedimentary rocks in such regions, with respect to geology, burries in them, the records of organic life through the ages .The soils on which plant grows are a form of sediments and also have economic considerations.
Ewekoro lies within Ogun State, which is bounded in the west by Benin Republic, in the south by Lagos State, in the North by Oyo and Osun States, and in the east by Ondo State. Ewekoro is the host to West African Portland cement quarry and lies between longitude 3°05 ́e to 3°15 ́E and latitudes 6°40 ́N to 6°55 ́N. Ewekoro town falls within the tropical rain forest of the subequatorial southwestern region, Nigeria. It experiences both, wet and dry seasons in a year, which is a typical nature of Nigeria climate. The average relative humidity of the study area is between 75-95% while the average mean annual rainfall and mean monthly temperature are about 1,500 -2000 mm and 220C - 22.50C, respectively [5].
2.2. Field Survey
2.2.1. Preliminary Field Survey
This was conducted to identify some features like vegetation, slope, drainage pattern, and toposequence in all three types of locations. Detailed soil survey was conducted using the rigid grid approach with traverses placed at intervals of 100 m in both vertical and horizontal axis and at right angle to each other. A total of nine profile pits of 2 m x 1 m x 2 m size were dug in all three locations. Soil samples were collected from the pedogenic horizons of each profile pits and replicated into well-labeled polyethylene bags. A total of (64) Sixty-four samples were collected for study. The field work exercise was accomplished with the use of several field materials such as topographic map, compass, cutlass, marker, field board, tape rule, pen, cryon and location guide map was used as a guide to the different location point. The profile pits were described morphologically after FAO [6]. Soil samples from observed horizon were collected for physical and chemical analysis. The samples were kept in the sample bags and labelled to indicate the location and the depth at which they were collected from the pits. The collected samples were air-dried and sieved using 2mm sieve, before usage for laboratory studies.
Soil colour was determined using a Munsel colour chart while other morphological properties were determined with visual observation and hand feeling as described by USDA [7].
2.2.2. Soil Analysis
The physical and chemical properties of the soil samples were determined, as described by Carter [8]. The hydrometer method was the laboratory procedure used to determine the particle size distribution of soils. It involves measuring the suspended soil particles in water with sodium hexametaphosphate as the dispersing agent and calculating the particle size based on the soil particle's settling velocity [9]. Using the percentages of sand, silt, and clay, a soil texture triangle was used to determine the texture of the soil. The Walkley and Black method was used for the determination of organic carbon in soil samples. The method involves the digestion of the soil sample with a mixture of concentrated sulfuric acid and potassium dichromate, which oxidizes the organic matter present in the soil to carbon dioxide (CO2) [10]. Available P was determined by using the Bray-1 extraction method. 10 grams of the soil sample was measured into a 50 mL flask. 20 mL of the Bray-1 extraction solution was added, typically consisting of 0.03 M NH4F (ammonium fluoride) and 0.025 M HCl (hydrochloric acid). It was vigorously shaken for five minutes to extract the available phosphorus from the soil. The soil extract was allowed to settle for a few minutes after which filtration was done using Whatman No. 42 filter paper. The concentration of the available P in the extract was determined by the vanado-molybdate blue method of Murphy and Riley [11] using spectrophotometer at 882 nm wavelength. The total N in the soil samples was determined using the micro-kjedahl method. 2 grams of the soil sample was weighed into a digestion flask. A digestion mixture consisting of sulphuric acid (H2SO4) and a catalyst (copper sulphate (CuSO4) was added. The flask was heated gently until the mixture became clear or pale green, indicating the conversion of nitrogen into ammonium sulphate. The resulting solution is then neutralized with sodium hydroxide, which liberates ammonia. The ammonia is distilled and collected, and its volume is measured and used to calculate the nitrogen content of the original sample [12].
The exchangeable bases were extracted using normal neutral ammonium acetate. To perform this procedure, a soil sample weighing 5 grams, sieved to 2 mm, was placed in a sample bottle. Then, 50 ml of ammonium acetate with a pH of 7.0 was added. The solution was vigorously shaken using a mechanical shaker for one hour, allowed to settle, and then filtered. The content of exchangeable sodium (Na+) and potassium (K+) in the filtered solution was determined using a flame photometer, while the content of exchangeable calcium (Ca+) and magnesium (Mg+) was determined using the EDTA titration method. The Effective Cation Exchange Capacity was calculated by summing the values of exchangeable cations and exchangeable acidity, as described by [13].
A titrimetric assessment was conducted to determine the exchangeable acidity [14]. The experiment involved weighing five grams of soil, sieved to a 2 mm size, and placing it in sample bottles. Subsequently, 25 ml of 1N KCl was added, and the mixture was vigorously shaken for one hour. After allowing the suspension to settle, the clear liquid above (supernatant) was carefully poured off, and an additional 30 ml of 1N KCl was introduced. This process was repeated once more. In the last stage, the filtrate obtained was supplemented with four drops of phenolphthalein indicator. Subsequently, it was titrated using NaOH solution until the color changed to pink, signifying the endpoint, at which point the titration value was recorded. The measurement of soil pH was conducted by preparing a 1:2 soil-water mixture. To accomplish this, 10 g of 2 mm sieved soil samples were carefully weighed and placed into a 50 ml beaker. Next, 20 ml of water was added to the beaker, and the solution was intermittently stirred using a glass rod. The samples were then left undisturbed for a duration of 30 minutes. After the allotted time, the soil pH was measured using a digital electronic pH meter.
Soil samples weighing approximately 0.5 grams, underwent digestion by combining them with 0.5 mL of H2SO4, 0.6 mL of concentrated HNO3, and 1.8 mL of concentrated HCl. The digestion process took place over a period of 2 hours at a temperature of 95°C. After cooling, the sample was diluted with deionized water to a final volume of 10 mL. Subsequently, the diluted samples were then analyzed for micronutrients (Zn, Mn, Cr, and Cu) using a PerkinElmer Atomic Absorption Spectrophotometer, model 303.
3. RESULTS
3.1. Morphological Properties
The results of the Morphological properties of Coastal plain sand (Akute) are presented in Table 1. The soils were generally deep with no surface stone or rock outcrops. Pedon 01 at Akute had four horizons while pedon 02 and pedon 03 each had 3 horizons. The surface soil has different shades of colours ranging from dark reddish brown (2.5YR2.5/3) to very dark brown (7.5YR2.5/2) and dry and reddish brown (2.5YR4/4) to dark reddish brown (2.5YR3/3) in the subsurface (Table 1). The texture of the soil was dark reddish brown loam sand top underlined by reddish-brown sandy clay loam in the subsoil. The pedon's textural class was predominantly loamy sand while the pedons had crumbs subangular blocky as its dominant structure. With the exception of pedon 03, the epiedons were non sticky, firm and hard while endopedon 1 and 2 had a very sticky consistency. Only pedon 1 had fine and medium roots, other pedons had none. In all the pedons there were no concretions.
The results of the Morphological properties of Basement Complex rock Formation (Lanlete) represented by pedons 04, 05 and 06 are presented in Table 2. Pedon 04 had five horizons while pedons 05 and 06 had three pedogenic horizons. The surface soil had different shade of colours varied from very dark brown (10YR2/2) to very dark grey (7.5YR3/1) and reddish brown (5YR4/4) to dark red (2.5YR3/6) in the subsurface. The texture of the soil ranged from sandy loam to loamy sand and sandy loam to sandy clay loam. The surface texture ranged from sandy loam to loamy sand and sandy clay loam to loamy sand to sandy clay in the – subsoil. The structure of the soil varied from fine to medium-sized coarse, crumbs with granular or columnar shapes. The consistency of the soil from Lanlate ranged from sticky to slightly sticky, loose to friable. The soil consistency ranged from non-sticky to loose at the surface horizons and slightly sticky to very hard at the sub-surface horizon. All the pedons were well-drained. Hence, no concentration is present in the pedons.
The results of the Morphological properties of the Ewekoro geological Formation (Ewekoro) represented by pedons 07, 08 and 09 are presented in Table 3. Pedon 08 had five horizons while pedons 07 and 09 had four and three pedogenic horizons, respectively. The parent material was sandstone. The surface soils had different shades of colours, ranging from very dark greyish brown (10YR 3/2) to very dark brown (7.5YR2.5/2) and lightly brown (7.5YR5/2) to strong brown (7.5YR5/6) in the subsurface. The texture of the soil ranged from sandy loam to sandy clay to sand clay loam. The surface texture ranged from sandy loam to sandy clay loam and clay sand to loamy sand in the sub-surface soil. The structure of the soil ranged from fine to medium; coarse granular, sub angular and blocky shapes. The consistency of the soil of Ewekoro varied from sticky to slightly sticky, loose to friable. The soil consistency ranged from non-sticky to lose at the surface horizons and slightly sticky to very friable at the subsurface horizons. Colour variation was from 2.5YR3/6 in pedon 09, (44-65 cm soil depth) to 10YR6/8 in pedon 07, (55-110 cm soil depth). All the epipedons fell within the sandy loam textural class with medium – sub-angular blocky structure. The pedon’s consistency was non-sticky and very friable. Root concentration ranged from few to common.
| Horizon Designation | Depth(cm) | Slope | Colour | Structure | Consistencies | Root Conc | Drainage | Mottle | |
| (%) | Dry | Texture | |||||||
| Pedon 01 | 0-40 | 2% | 2.5YR2.5/3 | LS | F , cr | ns,vf ,h | f, fe | Wd | None |
| 40-55 | - | 2.5YR2.5/3 | LS | Cr , sab | s, vf,h | f , vfe | Wd | None | |
| 55-82 | - | 2.5YR4/4 | SCL | Cr , sab | ss ,f, vh | vf , me | Wd | None | |
| 82-150 | - | 2.5YR4/4 | SCL | F , ab | vs, vh, vf | - | Wd | None | |
| Pedon 02 | 0-33 | 3% | 2.5YR3/3 | LS | Cr , ab | ns, vf, vh | N | Wd | None |
| 33-71 | - | 2.5YR2.5/3 | LS | Cr , sab | vfr ,ns, lo | n | wd | None | |
| 71-145 | - | 2.5YR4/4 | SCL | F , ab | vs , vf , vh | n | wd | None | |
| Pedon 03 | 0-33 | 3% | 7.5YR2.5/2 | SL | Cr , sab | s ,f, h | N | Wd | None |
| 33-71 | - | 2.5YR3/3 | LS | Cr , sab | s , f , h | n | wd | None | |
| 71-145 | - | 7.5YR3/3 | SC | f , ab | s , vh ,vf | n | wd | None | |
| Horizon Designation | Depth (cm) | Slope | Parent | Colour | Structure | Consistency | Root Conc | Drainage | Mottle | |
| (%) | Materials | Moist | Texture | |||||||
| Pedon 04 | 0-5 | 3% | Basement complex |
10YR2/2 | SL | Cr ,sab | ns, vf ,lo | Vf ,m | Wd | None |
| 5-33 | 10YR3/2 | LS | Cr , sab | ns, vf, h | F ,m | Wd | None | |||
| 33-47 | 5YR3/3 | LS | f,cr | s, vf, h | Vf ,co | Wd | None | |||
| 47-87 | 5YR4/4 | SL | f,cr | ns, f, vh | F ,fe | Wd | None | |||
| 87-146 | 2.5YR4/6 | SCL | me, sab | ss, vf , vh | Co, f | Wd | None | |||
| Pedon 05 | 0-12 | 3% | Basement complex | 7.5YR2.5/3 | LS | Me , cr | ns, fr, lo | F, vm | Wd | None |
| 12-50 | 7.5YR4/3 | S | F , cr | ns ,fr, lo | F, vm | wd | None | |||
| 50+ | Hardpan | - | - | - | - | - | - | |||
| Pedon 06 | 0-26 | 2% | Basement complex | 7.5YR3/1 | LS | cr , sab | ns, fr ,lo | F, me | Wd | None |
| 26-44 | 7.5YR4/4 | SCL | me , sab | ss f, h | F, co | wd | None | |||
| 44-65 | 2.5YR3/6 | SC | me, sab | ss, f. vh | F, vfe | wd | None | |||
| Horizon Designation | Depth(cm) | Slope | Parent | Colour | TC | Structure | Consistency | Root Conc | Drainage | Mottles |
| (%) | Materials | Moist | ||||||||
| Pedon 07 | 0-18 | 3% | Sandstone | 10YR3/2 | SL | me, sab | ns, vfr ,lo | co,m | Wd | None |
| 18-35 | 10YR2/2 | SL | me, sab | ns, vfr,lo | co, m | Wd | None | |||
| 35-55 | 7.5YR5/2 | CS | co, ab | vs, vf,vh | F, fe | Wd | None | |||
| 55-110 | 10YR6/8 | CS | me, ab | vs ,vf,vh | F, vfe | Wd | None | |||
| Pedon 08 | 0-18 | 3% | Sandstone | 7.5YR2.5/2 | SL | me, sab | ns ,fr , lo | F, m | Wd | None |
| 18-38 | 7.5YR4/3 | SL | f, sab | ns ,fr , lo | F, m | wd | None | |||
| 38-69 | 7.5YR4/6 | LS | me ,sab | s, fr ,so | F, m | wd | None | |||
| 69-120 | 7.5YR5/6 | SC | me, sab | ss, f, vh | F, m | wd | None | |||
| 120-150 | 7.5YR7/6 | CS | co, ab | ss, f, vh | F, m | wd | None | |||
| Pedon 09 | 0-8 | 3% | Sandstone | 7.5YR2.5/2 | SCL | me, sab | ns, vfr, lo | F, m | Wd | None |
| 23-Aug | 7.5YR3/3 | LS | f, sab | ns, vfr, h | c, m | wd | None | |||
| 44-65 | 2.5YR3/6 | SC | me, sab | ss ,f. vh | F, vfe | wd | None | |||
| Hardpan | - | - | - | - | - | None |
| Location | Slope | Horizon (cm) | Sand (%) | Silt (%) | Clay (%) | Silt/Clay | Silt/(silt+Clay) |
| Coastal plain sand | U/S | 0-33 | 79.52 | 8.92 | 11.56 | 0.77 | 0.44 |
| U/S | 33 - 71 | 77.52 | 10 | 12.48 | 0.80 | 0.45 | |
| U/S | 71-145 | 71.52 | 13.93 | 14.55 | 0.96 | 0.49 | |
| M/S | 0-33 | 62.07 | 21.37 | 16.56 | 1.29 | 0.56 | |
| M/S | 33-71 | 59.52 | 21.93 | 18.55 | 1.18 | 0.54 | |
| M/S | 71-145 | 58.06 | 21.88 | 20.06 | 1.09 | 0.52 | |
| L/S | 0 - 40 | 56.52 | 15.98 | 27.5 | 0.58 | 0.37 | |
| L/S | 40-55 | 54.06 | 14.38 | 31.56 | 0.46 | 0.31 | |
| L/S | 55 - 82 | 53.15 | 13.27 | 33.58 | 0.40 | 0.28 | |
| L/S | 82-150 | 51.06 | 9.07 | 39.87 | 0.23 | 0.19 | |
| Mean | 63.3 | 15.07 | 22.62 | 0.77 | 0.41 | ||
| SD ± | 10.28 | 5.14 | 9.84 | 0.34 | 0.12 | ||
| Basement complex | U/S | 0-5 | 78.4 | 10.25 | 11.35 | 0.90 | 0.47 |
| U/S | 5-33 | 76.53 | 10.2 | 13.27 | 0.77 | 0.43 | |
| U/S | 33-47 | 73.41 | 10.24 | 16.35 | 0.63 | 0.39 | |
| U/S | 47 -87 | 70.53 | 8.32 | 21.15 | 0.39 | 0.28 | |
| U/S | 87 - 126 | 67.35 | 9.14 | 23.51 | 0.39 | 0.27 | |
| M/S | 0-12 | 67.28 | 7.46 | 25.26 | 0.30 | 0.22 | |
| M/S | 12-50 | 65.34 | 7.46 | 27.2 | 0.27 | 0.21 | |
| L/S | 0-26 | 63.37 | 5.77 | 30.53 | 0.19 | 0.16 | |
| LS | 26-44 | 59.25 | 7.43 | 33.32 | 0.22 | 0.18 | |
| Mean | 69.05 | 8.47 | 22.43 | 0.45 | 0.29 | ||
| SD ± | 6.25 | 1.58 | 7.59 | 0.25 | 0.11 | ||
| Ewekoro formation | U/S | 8-23 | 72.27 | 15.68 | 12.05 | 13 | 0.56 |
| U/S | 23-68 | 67.85 | 17.88 | 14.27 | 1.25 | 0.15 | |
| U/S | 68-74 | 60.25 | 24.7 | 15.05 | 1.64 | 0.62 | |
| U/S | 74-120 | 59.95 | 24.78 | 15.27 | 1.62 | 0.61 | |
| M/S | 0-18 | 59.00 | 24.65 | 16.35 | 1.51 | 0.6 | |
| M/S | 18-38 | 58.12 | 24.73 | 17.15 | 1.44 | 0.59 | |
| M/S | 38-69 | 57.21 | 25.97 | 16.82 | 1.54 | 0.6 | |
| M/S | 69-120 | 57.02 | 26.93 | 16.05 | 1.68 | 0.62 | |
| M/S | 120-150 | 56.63 | 26.2 | 17.17 | 1.52 | 0.6 | |
| L/S | 0-18 | 56.35 | 24.78 | 18.87 | 1.31 | 0.56 | |
| L/S | 18-35 | 56.11 | 20.54 | 22.35 | 0.92 | 0.47 | |
| L/S | 35-55 | 55.93 | 16.75 | 27.32 | 0.61 | 0.38 | |
| L/S | 55-110 | 55.27 | 15.36 | 29.37 | 0.52 | 0.34 | |
| Mean | 59.38 | 22.23 | 18.31 | 2.19 | 0.51 | ||
| SD ± | 5.06 | 4.32 | 5.07 | 3.26 | 0.14 | ||
3.2. Soil Physical Properties
The description of the physical properties of Coastal plain sand (Akute), Basement Complex (Lanlate) and Ewekoro Formation (Ewekoro) based on the soil particle size distribution under each of the geological formation at three topographic positions, namely the lower slope, middle slope and the upper slope are presented in Table 4. The sand content of Coastal plain sand (Akute) varied from 51% in the lower slope at 82-150 cm depth to 80% in the upper slope at 0-33 cm soil depth of coastal plain sand. Among all topographic positions and horizons, the upper slope had the highest sand content. The silt and clay contents also varied from 9 – 22% and 12 – 40%, respectively. The lower slope gave the highest amount of clay in the coastal plain sand pedons. At profile one, the soil had a sand particle fraction of 79.5% in the surface horizon and the sub-surface horizon had a range of 71.52% to 77.52% sand content. In this profile, the sand content decreases with an increase in the soil depth. Profile two had a sand particle size fraction of 62.07% in the surface horizon and had a range of 58.06 to 59.52% at the sub-surface horizon. The sand particle size fraction of the soil from pit three is 56.52% on the surface horizon and 51.06 to 54.06% in the sub–surface horizon. As the soil depth increases, there is a decrease in the sand content. Among the three pedons in Akute pedon, one has the highest sand content in the surface horizon (79.50%) at the upper slope followed by pedon two which had 62.07% at the middle slope and pedon three had the lowest sand content at the surface (56.52%). Among the three topographic positions, the average sand content was highest on the lower slope. In all the locations, the variability in the sand particle size fraction was moderate.
The clay content is low to moderate compared with the sand content and increases with depth down the profile. Profile one had a clay particle size fraction of 11.56% in the surface horizon and the sub-surface horizon had a range of 12.48-14.55% in the upper slope. Profile two had a clay content of 16.56% at the surface layer and 18.55 to 20.06% at the sub-surface layer. The clay content increases with depth. Profile three of soil from Akute had a clay content of 27.5% at the surface layers and 31.56 to 39.87% at the sub-surface layer.
The silt fraction increases with depth. Profile one had a silt content of 8.92% at the surface layer and 10.00 to 13. 93% at the sub-surface layer. Profile two had a silt particle fraction of 21.37% at the surface and 21.93% - 21.88% at the sub–surface and profile three had a particle size of 15.98% at the surface and 9.07-14.38% at the sub-surface, the silt particle fraction of soil of profile three decrease as the depth increases. The silt-to-clay ratio was >0.15. In the soils of Akute, the value of the silt to clay ranged between 0.23 in the lower slope to 1.29 in the middle slope, the highest value of 1.29 was recorded for the surface soil where the lowest value was recorded in the sub-surface soil of the same pedon. The silt/(silt +clay) weathering indices of steward et al (1970) of soil from Akute are very low(<0.7)(Table 4) in all the horizons of the soil of pedon one and they generally decrease with profile depth.
Soil of Lanlate profile one (upper slope) had a sand particle fraction of 78.4% at 0-5 cm deep and 73.41% at 33-47 cm deep at the surface and subsurface respectively. In this profile, the sand content decreases with an increase in the soil depth. Profile two haa d a sand particle fraction of 67.28% at 0-12 cm deep at the surface horizon and 65.34% at 12-50 cm deep in the sub-surface horizon and profile three had 63.37% sand fraction at the surface horizon at the depth of 0-26 cm and 59.25% sand content at 26-44 cm deep in the sub surface horizon. Profile one has the highest sand particle fraction (78.4%) in all three profiles in Lanlate . Profile one (upper slope) had a clay particle fraction of 11.35% at 0-5 cm deep at the surface horizon and 16.35% at 33-47 cm deep in the sub-surface horizon. Profile two (middle slope) had a clay particle fraction of 25.26% at 0-12 cm deep and 27.20% at 12-50 cm deep at the surface and sub-surface horizon respectively. Profile three lower slopes had a clay content of 30.53% at 0-26 cm deep at the surface horizon and 33.32% at 26-44 cm deep in the sub-surface.The clay particle fraction is low to moderate compared to the sand particle fraction and decrease with depth down the profile in all the pedon. The silt fraction of the soil of Lanlate increases with depth. Profile one (upper slope) had a silt particle fraction of 10.25% at 0-5 cm deep at the surface horizon and 10.24% at 33-47 cm deep in the sub –surface horizon. Profile two(middle slope) had a silt particle fraction of 7.46% at 0-12 cm deep in the sub –surface and 7.46% in the sub-surface at 12-50 cm deep. Profile three (lower slope) had particle fraction of 5.77% at the surface horizon at 0-26 cm deep and 7.43% at the depth of 26-44 cm at the sub-surface horizon. The silt particle fraction of the soil of Lanlate decreases with an increase in depth. The silt-to-clay ratio (Silt/Clay) decreases down the pedons. Profile one had silt- to-clay ratio of 0.90% at 0-5 cm deep at the surface horizon and 0.63% at the sub-surface horizon at the depth of 33-47 cm. Profile two had a silt to clay ratio of 0.30% at the surface and 0.27 at the sub-surface at the depth of 0-12 cm and 12-50 cm respectively. Profile three had a silt to clay ratio of 0.19 at the surface and 0.22at the sub –surface horizon .The silt to clay ratio of all the soil of Lanlate are >0.15. Profile one had Silt/(silt +clay) ratio of 0.47 and 0.39 at the surface and sub –surface horizon, respectively. The ratio is very low (<0.7) (Table 4) to moderate in all the horizons. Profile two had a Silt/(silt+ clay) ratio of 0.22 at the surface and 0.21 at the sub surface and profile three had 0.16 and 0.18 at the surface and sub-surface horizon, respectively.
Soil from Ewekoro profile one (upper slope) had a sand particle fraction of 75.35% at 0-8cm deep and 72.27% at 23-68cm deep in the surface and sub–surface horizon respectively. Profile two (middle slope) had a sand particle fraction of 59.00% at the surface horizon and 57.21% at the sub-surface at 0-18cm and 39-69cm deep respectively. Profile three (Lower slope) had a sand particle fraction of 56.35% at 0-18cm deep in the surface horizon and 55.93% at a depth of 35-55cm in the sub-surface horizon. Sand content decreases with increasing depth. The clay fraction of the soil particles of profile one is 10.27% at the surface horizon and 14.27% at the sub-surface layer. Profile two had a clay content of 16.35% and 16.82% at the surface and sub-surface layers, respectively. Profile three had a clay content of 18.87% at the surface layers and 27.32% at the sub-surface layers. The clay content increases with depth. Profile one had a silt content of 14.38% at the surface layer and 17.88% at the sub-surface layer. Profile two had a silt content of 24.65% at the surface layer and 25.97% at the sub –surface layer and profile three had 24.78% and 16.75% at the surface and sub –surface layers. The silt- to-clay-ratio was low to moderate in all the pedons and ranged from 0.20 to 1.68, with horizon four of pedon one in Ewekoro formation having the highest value (1.68) while the lowest value (0.20) was observed in horizon three of pedon three of basement complex. Generally, in all the geological Formations, the clay particle fraction is highest on the lower slope of pedon three of coastal plain sand (39.87) and lowest in the upper slope of pedon one of the Ewekoro Formation.
3.3. Chemical Properties of the Soils
The soil chemical properties of the three geological formations are presented in Table 5. The pH of the Coastal plain sand ranged in values between 4.87 and 6.75. The upper slope had the highest pH value while the lower slope had the least pH among other topographic positions. The medium of soil reaction was within the suitable range for crop production. The soil organic matter varied between 1.29 (< 2 low) in the lower slope to 5.47% (>3 high) in the upper slope (Table 5). The organic matter was high on all the diagnostic horizons of the upper slope (>3) while it was moderate on the middle slope (between 2-3%). The lower slope had moderate (between 2-3%) soil organic matter on the 0-40cm soil depth and subsequently had low values (<2%) with progression down the soil profile. Generally, there was a gradual decline in soil organic matter with an increase in the depth of sampling. The total nitrogen ranged from 0.07% (<0.1 very low) in the lower slope at 82-150 cm soil depth to 0.32% (between 0.2- 0.5% medium) in the upper slope at 0-33 cm soil depth while the available phosphorus varied between 2.88 mg kg-1 in the lower slope at 82-150 cm soil depth to 10.89 mg kg-1 in the upper slope at 0-33 cm soil depth (Table 5). Variations in the total nitrogen and available phosphorus along the soil profile and across the topographic positions followed the same trends as the soil organic matter.
The exchange site was dominated by calcium and magnesium ions. The exchangeable calcium varied between 1.45 cmol kg-1 in the lower slope and 1.99 cmol kg-1 in the upper slope whereas the exchangeable potassium and magnesium varied from the lower slope at the 82-150 cm depth to upper slope 0-33 cm soil depth with values that ranged from 0.10 cmol kg-1 to 0.48 cmol kg-1 and 1.11 to 1.75 cmol kg-1 respectively (Table 5). The exchangeable sodium also followed a similar pattern with values that ranged between 0.40 and 0.85 cmol kg-1. The exchangeable cations were low, consequently the low cation exchange capacity (CEC) that has values ranging from 3.17 cmol kg-1 in the lower slope 82-150 cm soil depth to 5.14 cmol kg-1 in the upper slope 0-33 cm soil depth.
| Location | Slope | Horizon(cm) |
pH
H 2 O |
O.C
g/kg |
T.N
g/kg |
AV.P
Mg/kg |
Ca 2+ | K + | Na + | Mg 2+ | H + | CEC |
| cmolkg -1 | ||||||||||||
| Coastal plain sand | U/S | 0-33 | 6.75 | 54.7 | 3.2 | 10.89 | 1.99 | 0.48 | 0.85 | 1.75 | 0.07 | 5.14 |
| U/S | 33 - 71 | 6.55 | 54.0 | 3.0 | 9.75 | 1.94 | 0.39 | 0.81 | 1.71 | 0.08 | 4.93 | |
| U/S | 71-145 | 6.05 | 49.2 | 2.9 | 7.57 | 1.87 | 0.34 | 0.77 | 1.66 | 0.11 | 4.75 | |
| M/S | 0-33 | 6.00 | 42.3 | 2.4 | 6.34 | 1.77 | 0. 30 | 0.73 | 1.58 | 0.11 | 4.49 | |
| M/S | 33-71 | 5.94 | 38.0 | 2.2 | 6.06 | 1.73 | 0.27 | 0.69 | 1.55 | 0.11 | 4.35 | |
| M/S | 71-145 | 5.84 | 30.1 | 1.6 | 5.54 | 1.68 | 0.21 | 0.65 | 1.47 | 0.12 | 4.13 | |
| L/S | 0 - 40 | 5.77 | 25.5 | 1.5 | 5.32 | 1.54 | 0.18 | 0.59 | 1.38 | 0.12 | 3.81 | |
| L/S | 40-55 | 5.56 | 21.0 | 1.2 | 5.09 | 1.49 | 0.16 | 0.48 | 1.35 | 0.13 | 3.61 | |
| L/S | 55 - 82 | 5.13 | 14.8 | 0.9 | 4.11 | 1.45 | 0.13 | 0.46 | 1.26 | 0.15 | 3.45 | |
| L/S | 82-150 | 4.87 | 12.9 | 0.7 | 2.88 | 1.39 | 0. 10 | 0. 40 | 1.11 | 0.17 | 3.17 | |
| - | Mean | 5.84 | 34.2 | 1.96 | 6.36 | 1.68 | 0.21 | 0.60 | 1.48 | 0.11 | 4.18 | |
| - |
SD ± |
0.57 | 15.6 | 0.90 | 2.45 | 0.41 | 0.15 | 0.24 | 0.20 | 0.03 | 0.66 | |
| Basement complex | U/S | 0-5 | 7.3 | 58.9 | 3.4 | 12.32 | 2.23 | 0.62 | 1.15 | 1.98 | 0.05 | 6.03 |
| U/S | 5-33 | 7.05 | 55.9 | 3.3 | 11.56 | 2.05 | 0.58 | 1.03 | 1. 90 | 0.06 | 5.62 | |
| U/S | 33-47 | 6.85 | 52.3 | 03 | 9.73 | 1.99 | 0.43 | 0.97 | 1.87 | 0.07 | 5.33 | |
| U/S | 47 -87 | 5.22 | 51.6 | 2.9 | 8.31 | 1.93 | 0.38 | 0.85 | 1.79 | 0.09 | 5.04 | |
| U/S | 87 - 126 | 5.97 | 47.6 | 2.8 | 8.03 | 1.88 | 0.31 | 0.8 | 1.67 | 0.11 | 4.77 | |
| M/S | 0-12 | 5.88 | 43.5 | 2.5 | 7.85 | 1. 80 | 0.25 | 0.75 | 1.53 | 0.12 | 4.45 | |
| M/S | 12-50 | 5.67 | 31.8 | 2.1 | 6.09 | 1.74 | 0.22 | 0.62 | 1.43 | 0.13 | 4.14 | |
| L/S | 0-26 | 5.35 | 28.0 | 1.6 | 5.73 | 1.67 | 0.18 | 0.58 | 1.37 | 0.14 | 3.94 | |
| L/S | 26 - 44 | 5.08 | 23.2 | 1.4 | 4.13 | 1.58 | 0.17 | 0.53 | 1. 30 | 0.16 | 3.74 | |
| L/S | 44 - 65 | 4.93 | 17.7 | 01 | 3.72 | 1.51 | 0.13 | 0.48 | 1.25 | 0.16 | 3.53 | |
| - | Mean | 5.90 | 41.0 | 2.40 | 7.74 | 1.65 | 0.32 | 0.77 | 1.28 | 0.10 | 4.65 | |
| - | SD ± | 0.85 | 14.7 | 0.83 | 2.90 | 0.62 | 0.17 | 0.22 | 0.71 | 0.04 | 0.84 | |
| Ewekoro Formation | U/S | 0-8 | 6.97 | 41.0 | 1.5 | 3.87 | 1.41 | 0.09 | 0. 40 | 1.27 | 0.17 | 3.34 |
| U/S | 8-23 | 6.73 | 39.4 | 3.2 | 10.25 | 2.01 | 0.51 | 0.91 | 1.88 | 0.06 | 5.43 | |
| U/S | 23-68 | 6.52 | 36.4 | 3.1 | 10.03 | 1.97 | 0.48 | 0.93 | 1.82 | 0.07 | 5.27 | |
| U/S | 68 – 74 | 6.23 | 48.3 | 2.9 | 9.86 | 1.92 | 0.43 | 0.89 | 1.74 | 0.08 | 5.04 | |
| U/S | 74-120 | 6.07 | 47.3 | 2.9 | 9.35 | 1.87 | 0.4 | 0.87 | 1. 70 | 0.1 | 5.02 | |
| M/S | 18 -38 | 5.86 | 34.0 | 2.5 | 7.85 | 1. 80 | 0.25 | 0.75 | 1.53 | 0.12 | 4.45 | |
| M/S | 38 - 69 | 5.8 | 33.4 | 2.1 | 6.09 | 1.74 | 0.22 | 0.62 | 1.43 | 0.13 | 4.14 | |
| M/S | 69-120 | 5.72 | 31.5 | 2.7 | 7.85 | 1.71 | 0.29 | 0.71 | 1.6 | 0.12 | 4.43 | |
| M/S | 120 - 150 | 5.63 | 31.2 | 2.5 | 6.58 | 1.61 | 0. 20 | 0.61 | 1.49 | 0.12 | 4.03 | |
| L/S | 0-18 | 5.25 | 26.3 | 2.3 | 6.15 | 1.55 | 0.19 | 0.57 | 1.48 | 0.13 | 3.92 | |
| L/S | 18-35 | 4.99 | 23.7 | 2.0 | 5.37 | 1. 50 | 0.16 | 0.51 | 1. 40 | 0.15 | 3.72 | |
| L/S | 35-55 | 4.83 | 21.0 | 1.9 | 4.87 | 1.49 | 0.12 | 0.47 | 1.31 | 0.16 | 3.56 | |
| L/S | 55 -110 | 4.76 | 18.7 | 1.7 | 4.05 | 1.43 | 0. 10 | 0.42 | 1.3 | 0.17 | 3.42 | |
| - | Mean | 5.70 | 33.2 | 2.40 | 7.09 | 1.43 | 0.24 | 0.63 | 1.29 | 0.12 | 4.29 | |
| - | SD ± | 0.70 | 9.3 | 0.54 | 2.27 | 0.66 | 0.17 | 0.25 | 0.60 | 0.03 | 0.71 | |
The pH of soil developed on the basement complex rock formation ranged in values between 5.08 in the lower slope and 7.3 at the upper slope, which was moderately acidic to slightly alkaline (Table 5). The upper slope had the highest pH value while the lower slope had the least pH values. The soil organic matter was low to very high and ranged in values from 1.77% in the lower slope at 44-65 cm soil depth to 5.89% at 0-5 cm soil depth in the upper slope. At all topographic positions, soil organic matter declined with an increase in depth of sampling. The soil organic matter of all the diagnostic horizons at the upper slope was exceptionally high. The total nitrogen ranged from 0.1% in the lower slope at 44-65 cm soil depth to 0.34% in the upper slope at 0-5 cm soil depth while the available phosphorus varied between 3.72 mg kg-1 in the lower slope at 44-65 cm soil depth to 12.32 mg kg-1 in the upper slope at 0-5 cm soil depth (Table 5). Variations in the total nitrogen and available phosphorus along the soil profile and across the topographic positions followed the same trends as observed with the soil organic matter content.
The exchangeable cations all followed the same pattern in terms of their variations with depth of sampling and topographic positions. In all cases, the highest values occurred on the upper slope at 0-5 cm soil depth while the lowest values occurred on the lower slope at 44-65 cm soil depth. Calcium values varied from 1.51 to 2.23 cmol kg-1 while potassium was from 0.13 to 0.62 cmol kg-1. Sodium and magnesium varied from 0.48 to 1.15 cmol kg-1 and 1.25 to 1.98 cmol kg-1. The CEC values ranged between 3.53 and 6.03 cmol kg-1 conforming to the variations in the exchangeable cations.
The medium of soil reaction of Ewekoro formation varied from moderately acidic to neutral with values ranging between 4.76 in the lower slope and 6.97 in the upper slope (Table 5). The upper slope had the highest pH value in all the diagnostic horizons. The soil organic matter content varied from being low to very high with values ranging from 18.7 g/kg in the lower slope at 55-110 cm depth to 48.3g/kg in the upper slope at 68-74 cm soil depth (Table 5). The total nitrogen content of the soil varied from 1.5g/kg in the 0-8 cm depth at the upper slope to 3.2g/kg in the 8-23 cm depth of the same topographic position. The lower slope had the lowest soil total nitrogen. Similarly, the available phosphorus ranged in values between 3.87 mg kg-1 in the 0-8 cm depth at the upper slope and 10.25 mg kg-1 in the 8-23 cm depth of the same topographic position.
The exchangeable cations also followed the same pattern in terms of their variations with depth of sampling and topographic positions. In all cases, the lowest values occurred on the upper slope at 0-8 cm soil depth while the highest values occurred on the same topographic position at 8-23 cm soil depth. The variations in values were: Ca, 1.31 to 2.01 cmol kg-1; K, 0.009 to 0.51 cmol kg-1; Na, 0.40 to 0.93 cmol kg-1; Mg, 1.27 to 1.88 cmol kg-1; and the CEC, 3.34 to 5.43 cmol kg-1, respectively.
4. DISCUSSION
The pedons differ from one another in each of the geological formations in terms of colour, texture, structure, consistency, boundary, number and depths of horizons though with high degree of similarities in some of these properties. The soils were generally deep, with no surface stone or rock outcrops. The different shades of the soil colour ranging from dark reddish brown to very dark brown when moist, suggest that the soils were well drained and an evidence of the relatively high soil organic matter content as observed in the study. The mottles colour was dark reddish brown loam sand top underlined by reddish brown sandy clay loam in the subsoil. The pedons textural class was predominantly loamy sand or sandy loam while the pedons had crumb subangular blocky as its dominant structure. The absence of iron and manganese concretions within the first 50 cm is advantageous for plant root developments [15]. Concretions can create physical barriers within the soil, restricting root penetration and elongation. In their absence, roots can freely explore the soil profile, allowing for better anchorage, improved nutrient exploration, and increased access to water resources.
The description of the physical properties of soil was based on the soil particle size distribution under each of the geological formations at three topographic positions, namely: the lower slope, middle slope and the upper slope. Generally, all the soils had high sand content and moderate clay content. The sand content decreased with increasing soil depths while the clay content increased down the soil profile notwithstanding the geological formation and the topographic positions. This could be a result of what Esu [16] described to be clay migration from the surface to the subsurface horizon and/or high rates of clay formation in subsoil horizons [17]. The rise in clay content within the subsoil horizon can be attributed to two main processes: the formation of secondary clay through synthesis and the weathering of primary minerals [18, 19]. In most cases, the upper slope had higher sand content than other topographic positions across the geological formations. The observed phenomenon can be partially ascribed to the presence of parent material abundant in quartz minerals, a crucial element found in granite. Furthermore, it can be attributed, in part, to geological mechanisms encompassing the segregation of soil substances due to biological or agricultural practices, the movement of clay particles through eluviation and illuviation, or the erosion of the land surface caused by runoff or a combination of these factors [20]. The arrangement of silt content within each horizon across different topographic positions in the geological formations did not exhibit a discernible pattern, suggesting that these soils were likely formed in their current location - in situ [17]. The lower slope, however, tended towards higher accumulation of clay than other topographic positions. This could be as a result of the erosion effect, which washes the fine particles away from the upper slope leaving behind coarse particles, subsequently leading to the accumulation of clay and fine soil particles in the lower slope and valley bottoms [21]. As we transition from the higher to the lower slope position, there is a noticeable decline in the silt/clay ratio with increasing depth. This decrease can be attributed to the migration of clay particles, suggesting the presence of sheet erosion in the upper soil horizons. The > 0.15 silt to clay ratio is an indication that the soil is young. A silt/clay ratio below 1.00 may indicate that these soils have undergone ferralitic pedogenesis.
The soil's physical condition at the sites does not present significant constraints to crop production.
The medium of soil reaction (pH) of soils developed on the three geological formations well within a sustainable range for crop production According to previous research conducted by Brady and Weil [22], it was reported that a pH range of 5.5 - 7.0 is considered optimal for ensuring overall satisfactory availability of plant nutrients. The upper slope had a higher pH relative to the lower slope pH values. This could be related to high rainfall received by the upper slope compared to the lower slope, which can result in increased leaching of alkaline compounds from the soil. This leaching process can raise the pH value of the upper slope. The average pH values recorded for the coastal plain, basement complex, and Ewekoro formation were 5.84, 5.90, and 5.70, respectively. These pH levels are conducive to nutrient availability for crop plants. It is worth noting that agricultural soils in Nigeria generally exhibit a pH range of 4.00 to 6.5, as reported by Hartly [23]. Therefore, the observed pH values in the mentioned regions are within the favorable range for crop cultivation, suggesting a potential for optimal nutrient uptake by plants.
The soil organic matter varied between low and very high ratings of tropical soil organic matter content [24]. SOM tends to be higher in the upper horizons relative to the other horizons, In most ecosystems, organic matter is primarily derived from plant residues, including leaves, roots, and other plant parts. When plant material decomposes, it contributes to the accumulation of organic matter in the soil. In general, the highest inputs of organic matter occur at the soil surface, where plant litter falls and accumulates. As organic matter undergoes decomposition, it gradually gets incorporated into the underlying soil horizons. Therefore, higher horizons tend to receive more organic matter inputs over time. The mean values of OC obtained for the coastal plain (34.2 g kg-1), basement complex (41.0 g kg-1) and Ewekoro formation (33.2 g kg-1) were all greater than the critical value recommended level of 10 - 14 g kg-1for agricultural land in Nigeria [24].
In most cases, the upper slope had the highest soil organic matter while the lower slope had the least. This might be because the upper slope can receive sediment deposition from the downslope due to erosion. This sediment often contains organic matter from the eroded soil, leading to the accumulation of SOM in the upper slope. Over time, this process can contribute to higher SOM levels in the upper portion of the slope. Furthermore, the upper slope often receives more sunlight and better drainage conditions compared to the lower slope. These favorable conditions can support higher plant productivity and the growth of vegetation. As plants grow and shed leaves or other organic materials, they contribute to the accumulation of SOM in the upper slope.
There was no considerable difference in the soil organic matter of the basement complex and the coastal plain, though soil developed over the basement complex was significantly higher in soil organic matter than those of the Ewekoro formation. The higher SOM level of Basic complex soil could be because the area is typically found in regions with more vegetation cover, which leads to a higher input of organic materials. The presence of plants and their residues, such as fallen leaves, roots, and decaying plant matter, contributes to the accumulation of SOM over time.
The surface had higher soil organic matter than the subsurface soil. There was a gradual decline in soil organic matter with an increase in the depth of sampling across the geological formations and topographic positions. The importance of soil organic matter in agriculture and land management practices has been studied in recent times [25].
Variations in the total nitrogen and available phosphorus along the soil profile and across the topographic positions followed the same trends as the soil organic matter. Although the lower slopes offer the advantage of receiving soluble nutrients from the upper slopes, their lower nitrogen (N) content may be attributed to a higher water table. This elevated water table could contribute significantly to the leaching of nitrogen, particularly in the nitrate form [17]. The variation in total nitrogen between the upper and lower slopes could be attributed to the movement of organic material by water and the differences in clay content [26].
The soil's total nitrogen (N) content was generally adequate in all formations, exceeding the critical value of >1.5 g kg-1 recommended by [24]. Consequently, to achieve optimum yield, the production of any crop in these areas would require a minimum input of supplementary nitrogen fertilizer for the first one or two cropping seasons.
However, P mean values 6.36 mg kg-1, 7.74 mg kg-1 and 7.09 mg kg-1 for coastal plain, basement complex and Ewekoro formation respectively were low compared with the critical value of 10 mg kg-1 suggested for crop production in Nigeria [27]. So P in form of fertilizer or organic manure is necessary for satisfactory crop production in these areas.
Exchangeable cations tend to reduce with depth of the profile, this could be due to the fact that in the upper horizons, the organic matter and clay minerals act as cation exchange sites, reducing leaching and promoting the retention of these basic cations.
The exchange site was dominated by calcium and magnesium ions. The values of the exchangeable cations were unusually low compared to the soil organic matter content. The exchangeable cations followed similar patterns in their variations along the horizon depth and across the topographic positions and geological formations, though, with differences in their concentrations. The low concentrations of the exchangeable cations contributed to the low cation exchange capacity of the pedons. The soils' Cation Exchange Capacity (CEC) varied from low to medium [28], specifically ranging from 3.17 to 6.03 cmol kg−1 of soil. Furthermore, there was noticeable diversity in CEC values across different soil profiles, indicating variations in the clay mineral composition of the pedons [29]. The mean K values for all the geological formation were adequate compared to the recommended critical value of K for most crops ranged between 0.21 and 0.30 cmol kg-1 [24]. Due to the above K would not be a hindrance to crop production in these areas. The mean values of exchangeable calcium (1.68 cmol kg-1) in the coastal plain sand and 1.65 cmol kg-1 for basement complex is within the range (1.50–2.0 cmol kg-1) suggested critical value for most arable crops grown in the gro-ecological zone of Nigeria [27]. The value of 1.43 cmol kg-1 recorded for Ewekoro formation is moderately ok. This means that the Ca2+ supply should not limit crop production in these soils. Exchangeable sodium (Na+) and Mg2+ contents of the soils were high and will not constitute any hindrance to crop production on these soils.
All the pedons had good to moderate soil chemical properties that made them potentially viable for agriculture but improved management techniques and farming systems are required to ensure sustainable use of these soils. These soils necessitate fertilizers that are deficient in nitrogen and potassium, while rich in phosphorus. To maintain their fertility, a comprehensive soil management approach should incorporate both organic and inorganic amendments. It is crucial to implement effective practices for handling organic residue and promote cropping systems like crop rotation and intercropping, which specifically involve legumes. By adopting these strategies, the sustenance of soil fertility can be ensured.
CONCLUSION
The evaluation of the morphological and physical properties of soils in the lower, middle, and upper slopes of each of the geological formations showed that there was no physical barrier to crop production and sustainable management of soil resources. Using the means across geological formations, the pH, total nitrogen and soil organic matter, and exchangeable cations of the soils were favourable for crop production. Available P was inadequate. The favourableness of the chemical properties of the pedons for agriculture were in the order of basement complex > coastal plain sand > Ewekoro formation and upper slope > middle slope > lower slope. These soils necessitate fertilizers that are deficient in nitrogen and potassium while rich in phosphorus. To maintain their fertility, a comprehensive soil management approach should incorporate both organic and inorganic amendments. It is crucial to implement effective practices for handling organic residue and promote cropping systems like crop rotation and intercropping, which specifically involve legumes. By adopting these strategies, the sustenance of soil fertility can be ensured. Soil tests for fertility evaluation should be carried out every two years after continuous cropping.
LIST OF ABBREVIATIONS
| CO2 | = Carbon dioxide |
| CuSO4 | = Copper sulphate |
| H2SO4 | = Sulphuric acid |
| Na+ | = Sodium |
| K+ | = Potassium |
CONSENT FOR PUBLICATION
Not applicable.
AVAILABILITY OF DATA AND MATERIALS
The data supporting the findings of the article is available in this manuscript.
FUNDING
None.
CONFLICT OF INTEREST
The authors declare no conflict of interest, financial or otherwise.
ACKNOWLEDGEMENTS
Declared none.

