All published articles of this journal are available on ScienceDirect.

Seasonal Effects of Non-selective Grazing on Soil Infiltration, Compaction, and Vegetation Structure in a Semi-arid Grassland of Northeast Mexico
 iD
Josué Israel García López2
iD
Martín Cadena-Zapata3
iD
Juan Antonio Encina-Domínguez1
iD
José Javier Ochoa-Espinoza1
iD
iD
Josué Israel García López2
iD
Martín Cadena-Zapata3
iD
Juan Antonio Encina-Domínguez1
iD
José Javier Ochoa-Espinoza1
iD
Authors Info & Affiliations
Abstract
Introduction
Addressing the scarcity of national studies, this research evaluated seasonal effects of non-selective grazing on infiltration, soil compaction, soil moisture, and vegetation structure in an Amelichloa clandestina pasture in northeastern Mexico across four seasons.
Methods
Using a randomized block design (4 seasons, 3 replicates), non-selective grazing was evaluated pre- and post-grazing (333 LU ha-1,where 1 LU = 450 kg live weight) in 600 m2 plots. Infiltration (Kostiakov-Lewis), compaction (0-10 cm), and vegetation (dry matter, height, cover) were assessed before and after grazing. Analyses included ANOVA/Tukey for the seasons, Student's t-test for grazing (p < 0.05), and Spearman's correlation.
Results
Seasonality varied post-grazing cumulative infiltration by 52% (spring: 14.8 cm vs. autumn: 7.1 cm) and the instantaneous infiltration rate by 68% (47.5 to 15.2 cm h-1). Grazing effects on infiltration were non-significant in three seasons (p ≥ 0.05), yet it consistently increased subsoil compaction (>1800 kPa at 7.5-10 cm) and reduced dry matter by up to 89% (3347 to 218 kg DM ha-1). Vegetation correlated with infiltration (r = 0.38).
Discussion
While seasonality significantly influenced soil infiltration and moisture, non-selective grazing increased subsoil compaction (7.5-10 cm), degrading vegetation and reducing infiltration. Adaptive grazing, adjusted to seasonal moisture, is required to maintain productivity.
Conclusion
Seasonality drove infiltration 2-4 times more than grazing; adaptive management aligned with seasonal conditions is essential for grassland resilience.
1. INTRODUCTION
The water cycle, including infiltration, runoff, and evaporation, is an integral part of the hydrological cycle that occurs within the edaphic-vegetative system [1]. Water is theprimary factor in the productivity, diversity, stability, and functioning of ecosystems in semi-arid and arid areas, as it determines nutrient availability, plant growth, drought resilience, and resource use efficiency [2]. In recent years, climate change has altered spatiotemporal water availability, reducing productivity in arid and semi-arid areas; in addition, population growth and overexploitation of water and soil have decreased grassland productivity [3]. This situation has contributed to many arid and semi-arid grasslands around the world experiencing a shift in dominant plant composition, from grasses to shrubs and bare soil [4]. Grazing has played an important role, and it is believed that the deterioration of their biological and economic potential is irreversible [5], as few studies have reported significant recovery of perennial grasses in desertified sites after the removal of livestock [6]. In addition, soil compaction is an important factor influencing water infiltration and is a major contributor to soil degradation, as it is mainly caused by livestock trampling. Compacting the soil significantly reduces water infiltration [6].
Uncompacted soil has a water infiltration rate 4 to 5 times higher than compacted soil [7]. However, the effects of grazing on infiltration are not uniform. Sharrow [8] documented that trampling increases bulk density and penetration resistance, limiting water movement. Lai and Kumar [9], in a global meta-analysis, found that moderate free-ranging grazing can enhance infiltration by maintaining vegetation cover and biological activity. This contradiction suggests that grazing effects are highly context-dependent, varying with management intensity, soil type, and season. Compaction recovery cycles are influenced by grazing management and seasonal fluctuations in soil moisture [10].
Despite this evidence, most studies evaluate grazing effects within a single season, without isolating the relative contributions of seasonality and grazing pressure to soil-water dynamics [11]. No experimental study has simultaneously compared infiltration and compaction under non-selective grazing across all four seasons in a semi-arid Amelichloa clandestina grassland of northeastern Mexico [12]. Therefore, the objective of this study was to determine compaction, moisture, water infiltration, and plant structure at various times of year in an Amelichloa clandestina grassland following non-selective grazing, and to compare seasonal effects with grazing effects on these variables.
2. MATERIALS AND METHODS
2.1. Study Area
The study was conducted in a 32-hectare experimental area dominated by A. clandestina in north-eastern Mexico, located at the “Los Ángeles” Experimental Ranch. The coordinates are 25° 06' 30”N and 100° 59' 18” W, at an altitude of 2,162 meters (Fig. 1). According to the Köppen classification, modified by Peel, [13], the climate is BSokw(e'), dry, with a precipitation/temperature ratio of 22.9 mm/16°C, warm summers, and an average temperature of 7 to 14°C. The average annual rainfall is 350 mm, divided into two periods: May to October (87%) and November to April (13%) (Fig. 2). Historical records (1971-2010) reflect the high interannual variability typical of semi-arid climates in northeastern Mexico. Annual precipitation ranges from 200 to 550 mm (x̄ = 345 mm), with extreme temperatures ranging from -12.5 to 40°C. In addition, a regional warming trend of +3.4°C has been observed over the last three decades, and the basic soil properties include a fine clayey-sandy texture and a shallow soil type [14].
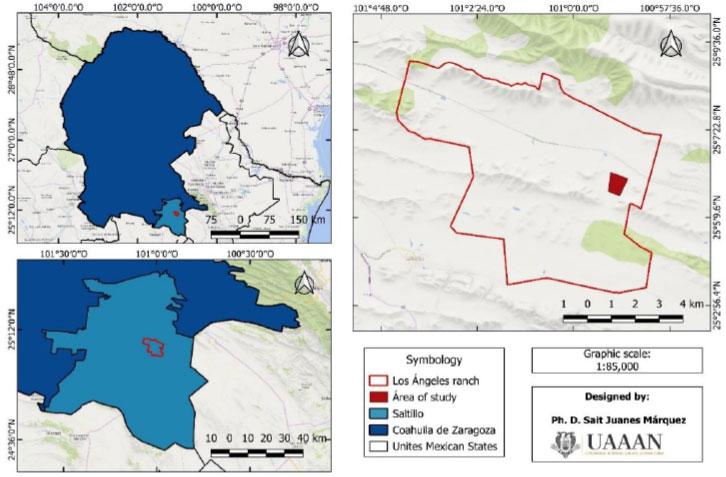
Location geography of the study area at Rancho “Los Ángeles”, Saltillo, Coahuila, Mexico.
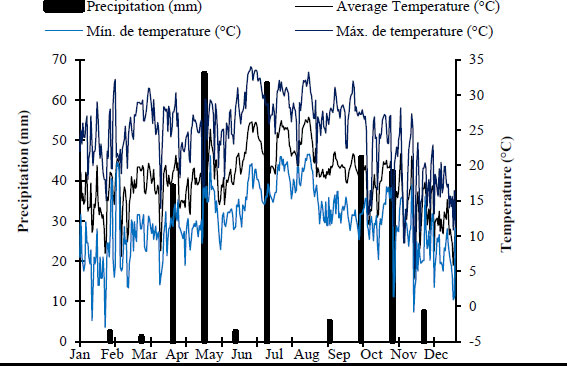
Average daily maximum, average, and minimum temperatures and accumulated precipitation from January to December 2023.
2.2. Methodology
A randomized complete block design was employed, with the four seasons of the year serving as blocks and three replicates per season, providing sufficient statistical power for seasonal block comparisons. The experimental units consisted of 600 m2 plots (10 x 60 m), spatially distributed in a randomized block array within the 32-hectare area. Grazing was carried out at the beginning of each season using non-selective grazing [15] (operationally defined as short-duration, high-density grazing designed to non-selectively consume all available biomass), with an instantaneous stocking rate of 333 livestock units (LU ha-1) (where 1 LU is defined as 450 kg live weight) at full forage availability [16] (quantified as >3,000 kg DM ha-1). This stocking rate represents an instantaneous, high-intensity grazing event applied over a single day per season (winter: January 29, spring: March 31, summer: June 23, autumn: September 23, 2023), following the non-selective grazing protocol established by Acocks [15]. Measurements were conducted immediately before (0-5 hours prior) and immediately after (0-5 hours post) each grazing event.
2.3. Variables Evaluated
2.3.1. Infiltration
Using a Turf-Tec IN2 W double ring infiltrometer, the water infiltration rate (cm h-1) was determined following the methodology of Khaerudin et al. [17] (Turf-Tec International, Florida, USA). Measurements were taken on bare soil plots at each site, with three randomly distributed measurement points established (one per replicate plot) to address spatial variability. Infiltration measurements were taken pre- and post-grazing (5 hours before animal entry and immediately after removal) at each season of the year, giving a total of 24 measurements (12 pre-grazing and 12 post-grazing). To calculate the instantaneous infiltration rate and cumulative infiltration, changes in water level were recorded in time increments until the infiltration rate stabilised using the Kostiakov-Lewis model, adjusted by power function fitting.
2.3.2. Soil Resistance to Penetration (Compaction kPa)
This was determined using a Field Scout SC 900 digital penetrometer (Spectrum Technologies, IL, USA) at four depths (0-2.5, -5.0, -7.5 and -10.0 cm). Measurements were taken along 10 m transects in plots before and after non-selective grazing (5 hours before entry and immediately after removal). Since penetration resistance is highly dependent on water content, these readings were taken simultaneously with the soil moisture measurements to precisely record the moisture conditions at the time of evaluation. A total of 18 penetration resistance measurements were taken at the four depth intervals, and these measurements were repeated during each season of the year.
2.3.3. Soil Moisture
A FieldScout TDR 300 meter was used to quantify moisture content [18]. Before and after grazing (evaluated 5 hours before and immediately after animal removal), six separate points were sampled at 10 m intervals within each of the three grazing replicates, giving a total of 18 sampling points. The measurement depth was 15 cm, because in grassland grasses, 44-79% of daily water uptake occurs within the 0-15 cm layer, even when water is more available at deeper levels [19]. The same methodology was followed in each evaluation period to obtain representative data on soil moisture percentage based on grazing dynamics.
2.3.4. Vegetation Structure
During each pre- and post-grazing season (measured 5 hours before and immediately after grazing), the basal cover, which is the percentage of soil directly occupied by the base of the plants, and the aerial cover of A. clandestina, which is the percentage of soil covered by the upper part of the plants when viewed vertically from above, were determined [12]. In each plot, five 1 m2 quadrats were selected and randomly relocated to avoid previously sampled areas during the pre- and post-grazing evaluations, measuring aerial projection and crown diameter using the line intercept method [20]. For quadrats he average plant height, 12 measurements were taken with a 100 cm ruler, ensuring contact with the ground [12]. Forage yield was estimated pre- and post-grazing, harvesting five 1 m2 quadrats per experimental unit. The samples were dried at 70°C for 72 h to determine dry matter yield per hectare (kg DM ha-1).
2.4. Statistical Analysis
The instantaneous and cumulative infiltration rates were modelled using the Kostiakov-Lewis equation, and model fit was evaluated based on the coefficient of determination (R2 > 0.90), indicating adequate predictive capacity for seasonal variation in infiltration. Prior to inferential analyses, the normality of residuals was assessed using the Shapiro-Wilk test, and homogeneity of variances was verified with Levene's test. When both assumptions were met, ANOVA was applied to evaluate differences in infiltration, compaction, and soil moisture between sites and seasons [21]. The separation of means was performed using Tukey's HSD test for seasonal comparisons [22] and Student's t-test for grazing condition contrasts (p < 0.05). To estimate the magnitude and precision of the observed differences, effect sizes and 95% confidence intervals were calculated and reported alongside all p-values. For variables that did not meet the normality assumption, including basal cover and soil moisture percentage, a nonparametric approach was adopted. Associations between physical and productive variables were therefore analysed using Spearman's rank correlation, which does not assume normality or linearity and is robust to the presence of outliers [23]. All analyses were performed in R (R Core Team, 2025) using RStudio (version 2025.05.1+513).
3. RESULTS
3.1. Instantaneous Infiltration Rate and Accumulated Infiltration
The seasonal values of cumulative and instantaneous infiltration in response to grazing management are summarized in Figs. (3 and 4), demonstrating a hydrological dynamic with defined temporal variations. Under pre-grazing conditions, cumulative infiltration ranged from 9.0 cm (autumn) to 13.5 cm (winter), while the instantaneous infiltration rate ranged from 32.4 cm h-1 (autumn) to 58.5 cm h-1 (winter). After grazing, the highest cumulative infiltration was recorded in spring (14.8 cm) and the lowest in autumn (7.1 cm); the instantaneous infiltration rate followed a similar pattern, reaching its maximum in spring (47.5 cm h-1) and decreasing significantly in autumn (15.2 cm h-1).
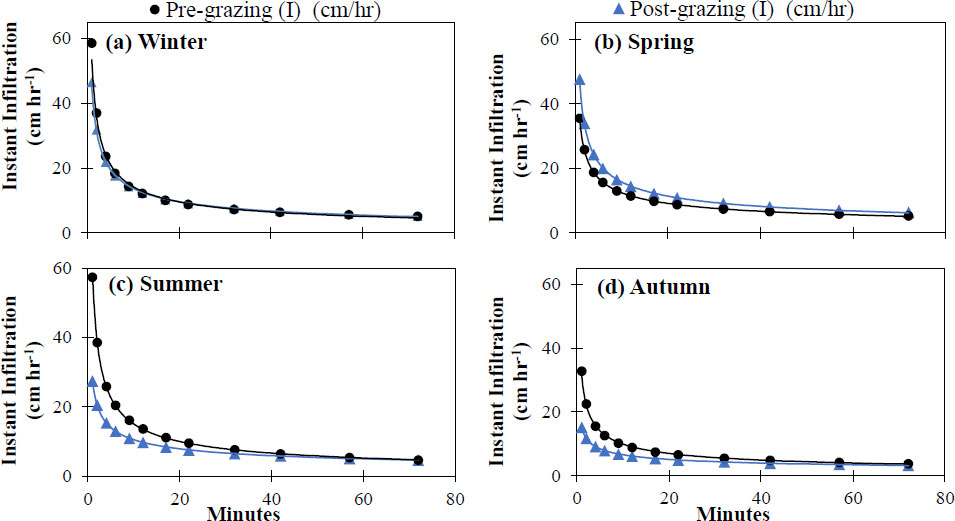
Instantaneous infiltration rate before and after grazing in the four seasons of the year in an Amelichloa clandestina grassland using the Kostiakov-Lewis model, at non-selective grazing sites established in (a) winter, (b) spring, (c) summer, (d) autumn.
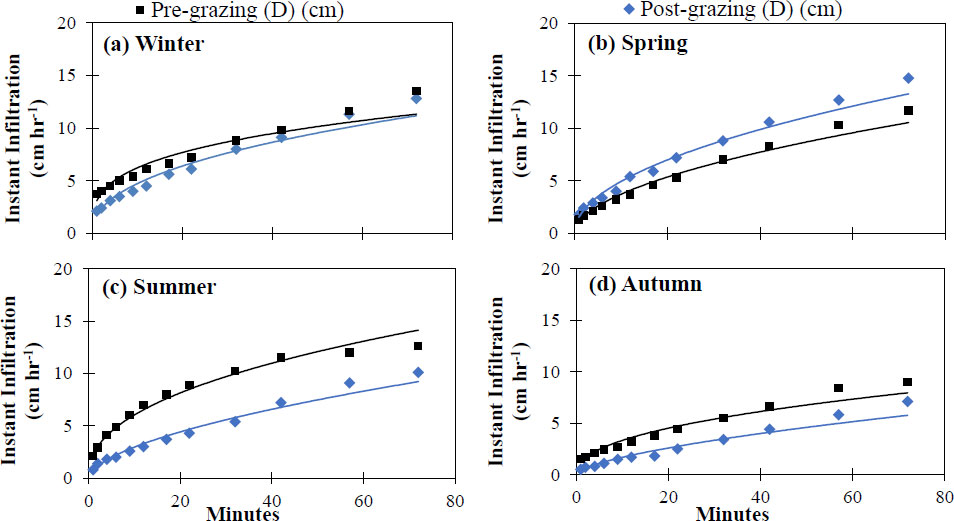
Cumulative infiltration rate before and after grazing in the four seasons of the year in an Amelichloa clandestina grassland using the Kostiakov-Lewis model at non-selective grazing sites established in (a) winter, (b) spring, (c) summer, and (d) autumn.
The Kostiakov-Lewis model provided a robust fit across all seasons and treatments (R2 > 0.90; Table 1), confirming its high predictive capacity despite seasonal variability in infiltration. This behaviour indicates that the dynamics of water infiltration in the soil can be adequately described by power functions, which accurately model the progressive decrease in the infiltration rate over time (Figs. 3 and 4).
| Station | Treatment |
Cumulative Infiltration I(t)=Kta+f0t |
Instant Infiltration f(t)=Kata-1+f0 |
R2 |
|---|---|---|---|---|
| Winter | Pre-grazing | I(t) = 3.104t0.302 + 0.036t | f(t) = 0.939t-0.697 + 0.036 | 0.90 |
| Post-grazing | I(t) = 1.736t0.435 + 0.018t | f(t) = 0.756t-0.564 + 0.018 | 0.97 | |
| Spring | Pre-grazing | I(t) = 1.100t0.528 + 0.009t | f(t) = 0.581t-0.471 + 0.009 | 0.98 |
| Post-grazing | I(t) = 1.554t0.501 + 0.012t | f(t) = 0.779t-0.498 + 0.012 | 0.98 | |
| Summer | Pre-grazing | I(t) = 2.237t0.430 +-0.007t | f(t) = 0.964t-0.569 + -0.007 | 0.98 |
| Post-grazing | I(t) = 0.789t0.574 + 0.004t | f(t) = 0.453t-0.425 + 0.004 | 0.98 | |
| Autumn | Pre-grazing | I(t) = 1.200t0.441 + 0.015t | f(t) = 0.530t-0.558 + 0.015 | 0.96 |
| Post-grazing | I(t) = 0.398t0.624 + 0.005t | f(t) = 0.248t-0.375 + 0.005 | 0.96 |
3.2. Infiltration Rate
Figure 5 shows that, when comparing infiltration rates across seasons (inter-seasonal comparison), water infiltration rates did not show significant differences ( p ≥ 0.05) between pre- and post-grazing conditions, except for the summer season. In contrast, when comparing pre- and post-grazing infiltration within each season (intra-seasonal comparison), only the summer season showed a significant difference ( p < 0.05). This distinction is important: seasonality, not grazing pressure, was the primary driver of inter-seasonal variation in infiltration rates.
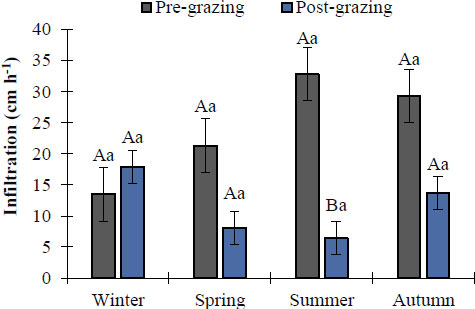
Average seasonal infiltration rate in an Amelichloa clandestina grassland under conditions of pre- and post-non-selective grazing. Means with different lowercase letters indicate significant differences between seasons for the events (pre vs post) (Tukey's HSD, p < 0.05). Means with different capital letters indicate significant differences between grazing events within the same season (Student's t, p < 0.05). Vertical bars represent standard error.
3.3. Soil Moisture
In all seasons evaluated, statistically significant differences (p < 0.05) were observed in soil moisture before and after non-selective grazing (Fig. 6). The autumn season recorded the highest percentage of post-grazing moisture (59%), while the lowest moisture corresponded to the winter season with 21% in grazed areas. On the other hand, before grazing, statistically significant differences (p < 0.05) were detected in moisture content. Under these initial conditions, the autumn season again had the highest moisture content (50%), followed by summer (30%), spring (23%), and winter (10%). In contrast, when comparing soil moisture before and after grazing by season, there was a significant difference (p < 0.05) only in winter between the two events.
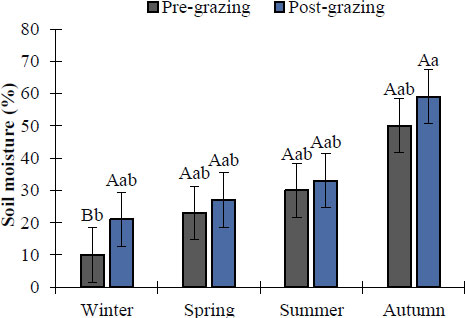
Seasonal soil moisture percentage before and after non-selective grazing in an Amelichloa clandestina grassland. Means with different lowercase letters indicate significant differences between seasons for the events (pre vs post) (Tukey's HSD, p < 0.05). Means with different capital letters indicate significant differences between grazing events within the same season (Student's t, p < 0.05). Vertical bars represent standard error.
3.4. Soil Resistance to Penetration
Figure 7a shows that the winter season showed a statistically significant difference (p < 0.05) at all four depths (2.5, 5.0, 7.5 and 10 cm); the highest compaction was recorded at 10.0 cm pre-grazing, with a penetration resistance exceeding 3096 kPa, while post-grazing highest values were 2360 and 2270 kPa at 10.0 and 7.5 cm, respectively. During spring (Fig. 7b), post-grazing compaction showed significant differences (p < 0.05) at all depths, with the highest post-grazing compaction at 10.0 and 7.5 cm, reaching 2,495 and 1,926 kPa, respectively. The lowest pre-grazing penetration resistance was recorded at 2.5 cm, with 179 kPa.
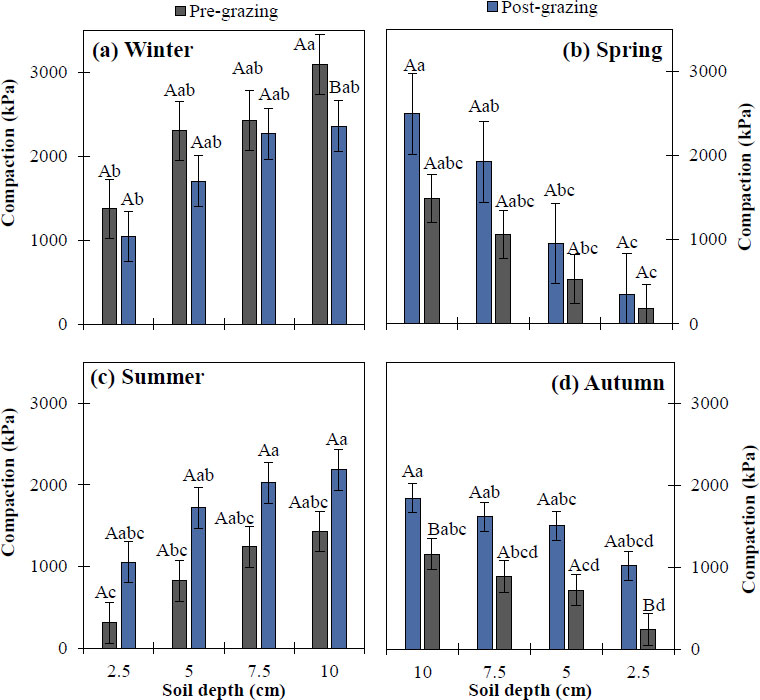
Soil compaction in the four seasons of the year in an Amelichloa clandestina grassland at four soil depths (2.5, 5.0, 7.5 and 10 cm) in pre- and post-non-selective grazing sites, established in (a) winter, (b) spring, (c) summer, and (d) autumn. Means with different lowercase letters indicate significant differences between depths for the events (pre vs post) (Tukey's HSD, p < 0.05). Means with different uppercase letters indicate significant differences between grazing events within the same soil depth (Student's t, p < 0.05). Vertical bars represent standard error.
In the summer season (Fig. 7c), statistical differences (p < 0.05) were recorded in soil compaction at all four depths. However, before the impact of grazing, the highest compaction was recorded at 10.0 and 7.5 cm, with 1429 and 1240 kPa, respectively, while the highest post-grazing compaction was also recorded at 10.0 and 7.5 cm, with 2183 and 2027 kPa, respectively. Finally, in autumn (Fig. 7d), compaction after grazing showed significant differences (p < 0.05) between depths. Post-grazing, there was a statistical difference, with the highest compaction at 10 cm (penetration resistance of 1844 kPa) and the lowest at 2.5 cm pre-grazing (243 kPa). Regarding soil compaction between pre- and post-grazing conditions at the same depth, a significant difference was detected in autumn at 2.5 and 10 cm. In contrast, no significant differences (p ≥ 0.05) were observed in winter, spring, and summer.
3.5. Vegetation Structure
Figure 8a shows the kg DM ha-1 present in each season before each grazing event, where the highest dry matter production was recorded in spring with 3347 kg DM ha-1, followed by winter, summer, and autumn with 3307, 3010, and 1907 kg DM ha-1, respectively. However, significant differences (p < 0.05) were recorded between pre- and post-grazing within each season. Post-grazing dry matter production showed a decrease, with the highest amount of dry matter recorded in summer, followed by spring, winter, and autumn, with values of 661, 437, 398, and 218 kg DM ha-1, respectively. In contrast, when comparing kg DM ha-1 between pre- and post-grazing conditions within the same season, significant differences (p < 0.05) were found in all four seasons, with pre-grazing dry matter being higher than post-grazing dry matter in all cases.
Plant height is shown in Fig. (8b), which recorded a statistically significant difference (p < 0.05) between pre- and post-grazing. However, the pre-grazing winter season showed the highest grass height at 53 cm, followed by spring, summer, and autumn, with values of 50, 46, and 37 cm, respectively. Post-grazing, height showed significant differences (p < 0.05) between seasons, with the highest post-grazing grass height occurring in spring at 16 cm, followed by winter, autumn, and summer at 14, 13, and 11 cm, respectively. In contrast, the comparison of height between pre- and post-grazing within a season showed significant differences (p < 0.05) in all seasons, with higher values in pre-grazing.
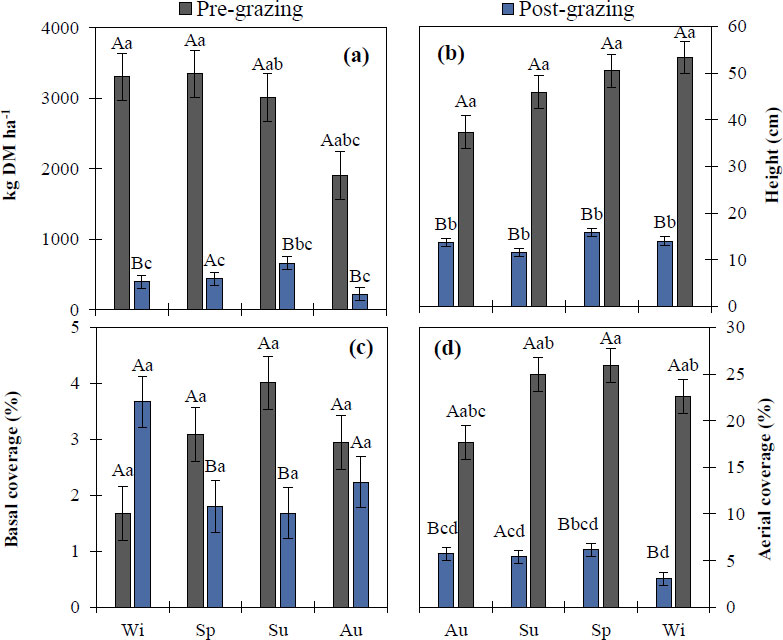
Comparison of means of kg DM ha-1, height, basal cover, and aerial cover between the four seasons of the year, pre- and post-non-selective grazing, in an Amelichloa clandestina grassland in north-eastern Mexico. Wi = winter, Sp = spring, Su = summer, Au = autumn. Means with different lowercase letters indicate significant differences between seasons for the events (pre vs post) (Tukey's HSD, p < 0.05). Means with different uppercase letters indicate significant differences between grazing events within the same season (Student's t, p < 0.05). Vertical bars represent standard error.
On the other hand, basal cover (Fig. 8c) in each season before and after grazing showed no significant difference (p ≥ 0.05). However, the highest basal cover was recorded before grazing in summer at 4%, followed by spring and autumn at 3.1% and 2.9%, respectively. The lowest value was recorded in winter with 1.7% basal cover. Post-grazing basal cover did not show a statistically significant difference (p ≥ 0.05); however, winter had the highest cover at 3.7%, followed by autumn, spring, and summer at 2.2, 1.8, and 1.7%, respectively. The comparison of basal cover between pre- and post-grazing within a season showed significant differences (p < 0.05) in all seasons, with higher values in pre-grazing. Aerial coverage (Fig. 8d) pre- and post-grazing showed a statistical difference (p < 0.05) between seasons, with spring showing the highest aerial coverage at 26%, followed by summer (25%), winter (23%), and autumn (18%). On the other hand, post-grazing aerial coverage in the winter season recorded the highest percentage at 11%, followed by autumn, summer, and winter at 6, 5, and 3%, respectively. The comparison of aerial coverage between pre- and post-grazing in the same season showed significant differences (p < 0.05) in all seasons, with higher values in pre-grazing.
3.6. Correlation
Correlation analysis (Table 2) revealed positive relationships between dry matter production (DMP) and the following variables. Strong associations with height and above-ground cover (0.86 and 0.85, respectively) stood out, while the correlations with basal cover (0.50) and infiltration (0.38) were low to moderate. On the other hand, height (HEI) showed a positive association with aerial cover (AC) (0.80), whereas it showed negative associations with basal cover (BC) and infiltration (INF) (0.36 and 0.23, respectively). Basal cover correlated moderately with both aerial cover and infiltration (0.44 in both cases) and weakly with soil moisture percentage (SMP) (0.22).
| DMP | HEI | BC | AC | INF | SMP | 2.5 | 5 | 7.5 | 10 | |
|---|---|---|---|---|---|---|---|---|---|---|
| DMP | 1 | - | - | - | - | - | - | - | - | - |
| HEI | 0.86*** | 1 | - | - | - | - | - | - | - | - |
| BC | 0.50** | 0.36* | 1 | - | - | - | - | - | - | - |
| AC | 0.85*** | 0.80*** | 0.44** | 1 | - | - | - | - | - | - |
| INF | 0.38* | 0.23 | 0.44** | 0.36* | 1 | - | - | - | - | - |
| SMP | -0.27 | -0.31 | 0.22 | -0.12 | -0.06 | 1 | - | - | - | - |
| 2.5 | -0.29 | -0.25 | -0.40 | -0.41 | -0.30 | 0.05 | 1 | - | - | - |
| 5 | -0.39 | -0.31 | -0.47 | -0.50 | -0.38 | -0.02 | 0.92*** | 1 | - | - |
| 7.5 | -0.45 | -0.37 | -0.57 | -0.57 | -0.41 | -0.36 | 0.64*** | 0.79*** | 1 | - |
| 10 | -0.30 | -0.21 | -0.59 | -0.39 | -0.54 | -0.43 | 0.49** | 0.61*** | 0.91*** | 1 |
Finally, the relationship between aerial cover and infiltration had a coefficient of 0.36. Positive correlations in soil compaction were observed across all depths. The 2.5 cm stratum was strongly associated with the 5.0 cm stratum (0.92), with the relationship decreasing in the 7.5 and 10 cm layers (0.64 and 0.49, respectively). In turn, the 5 cm depth correlated with the 7.5 and 10 cm depths (0.79 and 0.61), highlighting the strong association between the deep 7.5 and 10 cm strata (0.91).
4. DISCUSSION
4.1. Instantaneous and Cumulative Infiltration
The pattern of water infiltration into the soil depends closely on factors such as porosity and external factors, including vegetation cover, seasonal rainfall, and management practices [24]. The highest cumulative infiltration was in spring, followed by winter, which can be attributed to lower soil compaction in the top 2.5 cm (Fig. 7) after grazing, as well as to initial soil moisture conditions, where lower water content was observed in the winter and spring seasons (Fig. 6). In addition, greater aerial cover was recorded in these seasons (Fig. 8). In contrast, lower values were recorded in summer and autumn, due to lower structural resistance and higher soil moisture associated with high precipitation (Fig. 2), which reduces infiltration [25]. In this context, the instantaneous infiltration rate exhibits typical behaviour across all seasons, starting with high values during the first 20 minutes followed by a progressive decline towards an asymptote. This pattern is consistent with Kostiakov's law [26] and other potential models that describe the decrease in infiltration as the soil becomes saturated [27]. In particular, the higher initial rate present in spring and winter could be associated with a looser soil structure and macropores formed by biological activity and wetting-drying cycles [28]. Additionally, the potential adjustment for cumulative infiltration (Table 1, Fig. 4) yields high R2 values across all seasons, indicating a robust representation of the phenomenon [29].
4.2. Infiltration Rate
When comparing instantaneous infiltration rates within each season, no statistically significant differences due to grazing were found, except in the summer season. However, seasonal variation was observed, suggesting that factors such as initial soil moisture, vegetation cover, and precipitation have a greater influence than grazing pressure [17]. Nevertheless, the lower water infiltration rate (Fig. 5) indicates that cattle trampling compacts the soil, increasing its apparent density and resistance to the penetrometer, thereby limiting infiltration [30]. This compaction reduces infiltration by up to 81% due to lower soil porosity and higher density [8]. In semi-arid climates, spring infiltration may be increased by vegetation cover, which protects the soil surface from direct compaction [31].
In summer, heavy rainfall favours initial infiltration, except when extreme drought forms crusts that limit water absorption [32]. In addition, the interaction between temperature and humidity alters the soil structure and influences its microporosity [33]. In winter, low evaporation and reduced biological activity favour structural conservation and, with it, infiltration [34]. Therefore, the results show that seasonality is the main determinant of infiltration, even though grazing did not produce significant changes. It should therefore be considered that the interaction between livestock and the ecosystem is complex and can manifest itself cumulatively and in the long term [17]. In this context, the claim that non-selective grazing can improve infiltration [9] should be interpreted with caution. This effect has been documented primarily with low to moderate stocking rates or on soils with very pronounced crusts, where hoof action alters surface sealing and increases microporosity. However, field studies in Mediterranean silvopastoral systems of the Iberian Peninsula [10], tallgrass prairies of the United States [11], and global meta-analyses [9] consistently report that non-selective grazing reduces infiltration due to surface sealing and subsurface compaction, particularly when applied under high soil moisture conditions, findings that are consistent with those of the present study. Internationally, comparable reductions in infiltration have been documented with high livestock loads in semi-arid systems in Australia, Sub-Saharan Africa, and South America [9], which reinforces the conclusion that the grazing-infiltration relationship is not linear and is mediated by the intensity of the livestock load, soil texture, and previous moisture conditions.
4.3. Soil Moisture
The results obtained show variations in soil moisture before and after grazing, influenced by vegetation type, grazing intensity, and climatic factors [35]. The higher moisture content in the autumn season after grazing may be associated with more frequent rainfall and moderate temperatures, conditions that favour water retention in the soil [36]. In this context, compaction and water infiltration are influenced by soil moisture, as shown in Fig. (6). The autumn season had the highest moisture content; however, there was no significant relationship with compaction. It should be noted that in the spring season, torrential rains were recorded where the cattle were grazing, and therefore compaction was greater than in the other seasons. In this sense, an increase in water content can lead to higher bulk density and soil resistance, especially in clayey and silty soils [37].
4.4. Soil Resistance to Penetration
Wet-dry cycles can reduce soil compaction by increasing microporosity, especially in soils with lower grazing intensity [38]. These cycles facilitate soil structure recovery by allowing soil expansion and compaction, which helps reduce hardness [39]. Freeze-thaw cycles promote soil recovery by generating cracks and volumetric expansion, reducing compaction. Their effectiveness depends on soil type and climatic conditions [40]. In addition to physical processes, the presence of roots and macrofauna activity contribute significantly to soil recovery. Roots break down compacted layers, and macrofauna generate micropores that promote infiltration [39]. These mechanisms in arid ecosystems are significantly influenced by precipitation, and the processes can persist for decades. However, there is a contrasting perspective that suggests that non-selective grazing results in vegetation recovery, as the action of hooves associated with short-term, high-intensity grazing becomes an alternative mechanism for increasing and maintaining the productivity of arid grasslands by incorporating seeds into the soil [41]. On the other hand, vegetation cover such as grasslands and shrubs significantly affects infiltration and runoff during heavy rainfall events (4-6 mm min-1) [42]. These compaction patterns are consistent with results reported in comparable ecosystems internationally. In the montane Mediterranean grasslands of Portugal, [10] a study recorded penetration resistance values exceeding 2000 kPa at depths of 5-10 cm following intensive livestock trampling under wet conditions, which closely resembles the fall results of the present study. In tallgrass prairies of the southern United States, [11] another study documented persistent subsurface compaction under continuous intensive grazing, with structural recovery observed only after prolonged rest periods. In contrast, [9] a global meta-analysis demonstrated that light to moderate grazing can maintain or reduce compaction relative to ungrazed controls, highlighting grazing intensity as the critical variable across diverse grassland ecosystems.
4.5. Vegetation Structure
During this study, dry matter production prior to grazing was highest in spring, followed by summer, winter, and autumn, coinciding with higher levels of solar radiation and precipitation [43]. Post-grazing, the reduction in forage was clearly noticeable and attributed to the high intensity of grazing by animals on the biomass present [44]. At the same time, pre-grazing plant height showed differences between seasons, with winter standing out, as seasonal phenology either favours or hinders plant development [45]. After grazing, the greatest height was recorded in spring, coinciding with studies that indicate rapid plant recovery in seasons with better temperature conditions and water availability [46]. No differences (p ≥ 0.05) were observed in basal cover between seasons, either before or after grazing. However, it was higher in winter, due to the strategy of certain species to concentrate their basal growth in response to defoliation or stress [47].
Nevertheless, after grazing, the highest aerial cover was observed in winter, followed by autumn, summer and spring, suggesting greater structural resilience in the season with less extreme climatic conditions [48]. The results show the influence of seasonality and grazing on grassland dynamics, highlighting the importance of regulating grazing intensity and frequency to maintain species productivity and persistence throughout the year [43].
4.6. Correlation
Several studies show that plant height and density are positively correlated with total biomass; taller and denser species have higher aerial and forage productivity [49]. The results show that soil compaction is negatively correlated with productivity and water infiltration, leading to lower biomass production. Mora and Lázaro [50] describe how a high apparent density negatively affects plant growth by reducing root growth and water uptake. This is why compaction promotes small species or those with shallow roots, thus reducing dry matter. Research also indicates that soil organic matter improves water infiltration and retention [51]. Although these studies focus on crops, the principle applies to grasslands: well-nourished, aerated soils under natural vegetation infiltrate better than bare or eroded soils [52].
4.7. Limitations, Practical Implications, and Future Perspectives
It is important to acknowledge several limitations of this study. The low number of replicates, the single annual cycle, and the spatial heterogeneity inherent in semi-arid grasslands limit the generalizability of the results and prevent the assessment of long-term cumulative effects. Despite these limitations, the seasonal patterns documented here have direct practical implications: grazing during spring, when soil moisture is low and vegetation cover provides surface protection, had the least impact on infiltration capacity, whereas grazing in autumn under conditions of maximum soil moisture intensified subsurface compaction more markedly [9]. These findings suggest that reducing stocking rates and postponing grazing events during periods of high moisture, combined with minimum recovery intervals of a full growing season, could mitigate structural soil degradation [49]. Furthermore, rotational, adaptive multi-pasture systems and non-selective grazing distribute grazing pressure more evenly across space and time and have proven effective in reducing compaction and maintaining infiltration capacity in semi-arid grasslands [11], representing a viable alternative for grasslands in northeastern Mexico.
Future research should prioritize the integration of precision livestock management technologies, such as GPS tracking, wireless soil sensors, and drone-based remote sensing, to facilitate real-time adjustments in grazing pressure [53]. This integration is essential to prevent soil compaction from exceeding irreversible thresholds, thereby strengthening adaptive management responses to climate variability in the semi-arid grasslands of northeastern Mexico. Likewise, the development of multi-year monitoring programs that incorporate these digital tools will help elucidate the relative contributions of stocking rates, grazing chronology, and seasonal climate fluctuations to long-term soil structural recovery and primary productivity [54].
CONCLUSION
The results show that seasonality is the determining factor in soil infiltration and moisture dynamics, outweighing the immediate effects of animal trampling. Autumn consistently recorded the highest moisture levels (59% post-grazing), which coincided with the highest risk of deep compaction, reaching penetration resistance values of 1844 kPa in the 10.0 cm layer, while spring exceeded the 2400 kPa threshold. In contrast, spring and winter conditions were more conducive to the preservation of soil structure. Although non-selective grazing significantly increased subsurface compaction and reduced all plant productivity variables, the infiltration rate did not show significant short-term changes. However, this finding should not be interpreted as an absence of risk, but rather as a cumulative degradation process whose effects on soil hydrology could manifest after recurring grazing cycles.
The correlation between vegetation and infiltration highlights the importance of vegetation cover in hydrological function. Adaptive management is suggested, involving exclusion during wet periods and adequate rest periods to prevent irreversible degradation. However, the annual design (n=3) limits the identification of cumulative effects and the extrapolation of results. Multi-year studies with physicochemical analyses are essential to discern the impact of grazing against seasonal variability.
AUTHORS’ CONTRIBUTIONS
The authors confirm contribution to the paper as follows: S.J.M. and P.A.V.: Study conception and design; S.J.M. and P.A.V.: Data collection; J.I.G.L., M.C.Z., J.A.E.D., J.J.O.E., and P.A.V.: Analysis and interpretation of results; S.J.M. and P.A.V: Draft manuscript. All authors reviewed the results and approved the final version of the manuscript.
LIST OF ABBREVIATIONS
| LU | = Livestock Units |
| kPa | = Kilopascals |
| kg DM | = Dry Matter |
| DMP | = Dry Matter Production |
| HEI | = Height |
| AC | = Aerial Cover |
| BC | = Basal Cover |
| INF | = Infiltration |
| SMP | = Soil Moisture Percentage |
| Wi | = Winter |
| Sp | = Spring |
| Su | = Summer |
| Au | = Autumn |
AVAILABILITY OF DATA AND MATERIALS
The data supporting the findings of this study are available at reasonable request to the corresponding author (P.A.V.).
FUNDING
This research was supported by the Universidad Autónoma Agraria Antonio Narro, Mexico through the Scientific Research Support Program of the Research Centre Directorate (Project No. 2201) and Project “Uso de la ganadería regenerativa en el aprovechamiento de un pastizal de Amelichloa clandestina en el rancho ganadero experimental “Los Ángeles” (Key 30-32400-425202001 -7519), Funded by Terra Habitus, A.C.
ACKNOWLEDGEMENTS
The authors express their gratitude to the Universidad Autónoma Agraria Antonio Narro (UAAAN), Mexico and the Departamento de Recursos Naturales Renovables, Mexico for their support. Special recognition is extended to the staff and managers of Rancho “Los Ángeles” for their logistical assistance, as well as to the thesis students and social service students for their valuable collaboration in the fieldwork.