All published articles of this journal are available on ScienceDirect.

Identification, Characterization, and Expression Analysis of the IMPβ Nuclear Transport Protein Gene Family in Taraxacum kok-saghyz

Abstract
Introduction
Taraxacum kok-saghyz (TKS), a perennial member of the Compositae family, is one of the three most important rubber-producing plants globally, alongside Hevea brasiliensis and Parthenium hysterophorus. Natural rubber is a vital industrial raw material with significant economic and daily-life implications. The importin β (IMPβ) gene family in H. brasiliensis has been implicated in the transport of ethylene-induced proteins associated with rubber biosynthesis. However, the role of the IMPβ gene family in TKS remains unexplored.
Methods
In this study, we identified 27 TKS importin β (TkIMPβ) gene family members. These members contain conserved domains and were classified into 12 subfamilies using multiple sequence alignment, phylogenetic analysis, and protein motif characterization.
Results
Bioinformatics analysis revealed replication-based relationships among four groups of TkIMPβ members: TkIMPβ1/TkIMPβ2, TkIMPβ9/TkIMPβ14, TkIMPβ17/TkIMPβ18, and TkIMPβ22/TkIMPβ23. Expression analysis indicated that certain TkIMPβ genes are associated with rubber biosynthesis, suggesting their regulatory role in natural rubber production.
Discussion
Subcellular localization and yeast two-hybrid assays (Y2H) confirmed that TkIMPβ proteins function as nuclear transport proteins rather than transcription factors, facilitating nuclear material transport and signal transduction. Additionally, exposure to NaCl stress, methyl jasmonate (MeJA), and ethylene (Eth) further demonstrated the involvement of TkIMPβ genes in rubber biosynthesis and stress responses.
Conclusion
Therefore, these findings not only improve our understanding of the evolution and expression patterns of the IMPβ family in TKS but also identify potential gene targets for molecular breeding strategies to enhance rubber yield in TKS.
1. INTRODUCTION
Natural rubber (NR), or cis-1,4-polyisoprene, is an essential raw material in various industries, distinguished from synthetic rubber by its unique chemical properties [1]. Hevea brasiliensis, native to the Amazon rainforest, is currently the only natural rubber crop cultivated on a large scale. However, its high production costs and long cultivation cycles contribute to significant environmental impacts on tropical rainforests [2]. Taraxacum kok-saghyz (TKS), commonly known as Russian dandelion, is a perennial herb of the Compositae family [3]. Originating from inland Kazakhstan, the Junggar Basin, and the Tarim–Tex River Basin in Xinjiang, China, it is now widely distributed across the Northeast Plain, North China Plain, and Northwest China [3, 4]. TKS is ranked among the world's top three rubber-producing plants, along with H. brasiliensis and Parthenium hysterophorus. Its roots contain a hydrocarbon polymer that is structurally and functionally similar to the NR polymer found in the latex tubes of H. brasiliensis [5]. The short growth cycle, ease of cultivation, and relatively simple genetic transformation make it an ideal model for studying plant-based rubber production. Since its discovery in the 1930s, researchers in China, the United States, and the Soviet Union have investigated its rubber content, chemical properties, agronomic requirements, and morphology. However, following the end of the Cold War and shifts in the global political landscape, major natural rubber producers in Southeast Asia and South America re-entered the market, leading to an oversupply of NR and a decline in TKS research [4-7].
Since the 21st century, the global automotive industry has expanded considerably, driving a sharp increase in NR demand. However, rubber trees thrive only in specific tropical climates, resulting in severe NR shortages in many countries. China, for instance, imports about 80% of its supply [8]. To mitigate these shortages, identifying alternative rubber-producing plants that can grow outside tropical regions is crucial. Since 2000, interest in TKS has been renewed among Chinese researchers. Unlike H. brasiliensis, TKS offers comparable rubber production along with several advantages, including a sevenfold faster production rate, a highly mechanized cultivation process, adaptability to temperate zones, and tolerance to poor soil fertility. Therefore, TKS is considered a promising alternative source of NR.
The primary distinction between eukaryotic and prokaryotic cells is that eukaryotic cells possess a nucleus enclosed by a double membrane [9]. The nucleus serves as the central hub for genetic material storage, replication, transmission, selective expression, and cellular metabolism [10]. The exchange of materials and information between the nucleus and cytoplasm is crucial for regulating cellular activities [11]. The nuclear transport system consists of two main components: nuclear transport receptors and nuclear pore proteins, whose interaction facilitates nuclear transport [12]. While small molecules diffuse passively across the nuclear envelope, macromolecules such as proteins require active transport mediated by nuclear transport receptors [12, 13]. Nucleocytoplasmic transport is a highly dynamic process involving the assembly, translocation, and disassembly of the import complex in a continuous cycle. Proteins such as importins, exportins, nucleoporins (Nups), and the cellular apoptosis susceptibility (CAS) protein participate in this process [14, 15], each playing distinct roles to ensure efficient transport [16]. Most biomacromolecules with molecular weights exceeding 50 kDa are actively transported by karyopherins [17-19]. Nuclear transport receptors, primarily belonging to the RanGTP-binding protein family, include importin α (IMPα) and importinβ (IMPβ), which share a conserved structural framework. IMPα acts as an adaptor, linking cargo proteins at one end while interacting with IMPβ or its homologs at the other. In plants, the function of IMPβ proteins extends far beyond basic nucleocytoplasmic shuttling. Studies have shown that IMPβ, as a core member of nuclear transport receptors, precisely regulates plant growth, development, environmental adaptation, and immune responses by specifically recognizing and transporting key transcription factors involved in various hormone signaling pathways and stress responses [20, 21]. For example, in Arabidopsis, the Importin β protein SAD2 has been shown to play a crucial role in stomatal immunity and abscisic acid (ABA) signal transduction by mediating the nuclear import of the protein phosphatase ABI1 [22]. In potato, an IMPβ gene induced by salicylic acid and hydrogen peroxide has been proven to be essential for plant responses to abiotic stress [21].
The pathways and regulatory mechanisms governing rubber biosynthesis pose significant theoretical challenges [1]. NR synthesis involves membrane proteins embedded in rubber particles within rubber-producing plants. These plants store and biosynthesize NR in their lactiferous ducts, with small rubber particles in laticifer cells serving as key organelles for both processes [1]. Unlike the nuclear-cytoplasmic transport of macromolecules, small molecular hormones regulate cellular signaling by binding to hormone receptors located either inside or outside the nucleus. This interaction modulates cell proliferation and immune responses. Extensive studies have explored the nuclear-cytoplasmic transport of hormone-receptor protein complexes, which initially assemble in the cytoplasm. Using yeast-based screening, Li et al. identified the AtJAT1 transporter as a key component in jasmonic acid (JA) transport. Functional analysis in Arabidopsis thaliana revealed that AtJAT1 mediates the nuclear import of extracellular JA and JA-Ile, significantly enhancing JA metabolism, particularly the cytoplasm interactions of JA-Ile [23]. However, the mechanism by which AtJAT1 facilitates JA-Ile transport across the nuclear double membrane remains unclear.
IMPβ binds to nuclear pore complex (NPC) proteins and plays a crucial role in nuclear protein transport. Based on the direction of cargo movement, IMPβ nuclear transport proteins are classified as exportins (mediating nuclear export) and importins (mediating nuclear import) [17-19]. At least 16 IMPβ subfamily members have been identified in eukaryotes, where the entire IMPβ family is expressed. In plants such as Zea, the IMPβ gene family exhibits significant expansion, with as many as 27 members identified, suggesting broad functional diversification [20].
This study presents the first comprehensive genome-wide analysis and characterization of the IMPβ nuclear transport protein gene family in TKS, using publicly available genome and transcriptome data. Bioinformatics analysis revealed replication-based relationships among four groups of IMPβ gene members: TkIMPβ1/TkIMPβ2, TkIMPβ9/TkIMPβ14, TkIMPβ17/TkIMPβ18, and TkIMPβ22/TkIMPβ23. Phylogenetic analysis classified 27 IMPβs into 12 subfamilies. Expression analysis further showed that TkIMPβ3 and TkIMPβ16 exhibited the highest expression levels in TKS roots. Moreover, IMPβs in TKS appear to play multiple roles in natural rubber biosynthesis.
2. MATERIALS AND METHODS
2.1. Identification of IMPβ Gene Family Members in TKS
The genomic data for TKS (BioProject: PRJNA792143) were retrieved from the National Center for Biotechnology Information (NCBI). Protein sequences of the IMPβ gene family members from Arabidopsis thaliana and Oryza sativa served as query sequences, and candidate IMPβ genes in TKS (e-value < 1e-5) were identified through local BlastP analysis. The conserved domains of IMPβ, including the N-terminal Ran-binding domain, intermediate HEAT repeat domain, and C-terminal substrate / adapter-binding domain, were predicted using InterProScan (http://www.ebi. ac.uk/interpro). To improve confidence, these predictions were cross-validated with the Pfam. All candidate sequences were manually inspected; those lacking complete open reading frames or exhibiting fragmented domain architectures were discarded. Finally, 27 non-redundant TkIMPβ gene family members were identified. The isoelectric point and molecular weight of the corresponding proteins were predicted using the “Calculate” tool in the Expasy online database of the Swiss Center for Protein Bioinformatics (http://web.expasy.org/compute_pi/) [24].
2.2. Chromosome Localization and Replication Analysis
MapInspect software was used to analyze the chromosomal distribution of IMPβ genes based on genome annotation data. DAMAN software was used to compare the genetic relationships among the 27 IMPβ genes, with nucleic acid sequences showing >90% homology defined as duplicated genes [25]. Subcellular localization was predicted using the WoLF-PSORT online server [26].
2.3. Motif Analysis
The MEME online software was used to analyze amino acid sequences and identify conserved motifs in IMPβ proteins [27].
2.4. Phylogenetic Tree Construction and Exon-intron Structure Analysis
The Clustal W program in the molecular evolution analysis software MEGA6.0 was used to compare IMPβ protein sequences from TKS, Arabidopsis thaliana, Hevea brasiliensis, and Oryza sativa. The neighbor-joining (NJ) method with a bootstrap test of 1000 replicates was used to construct phylogenetic trees, which were then evaluated [28]. Gene structure analysis was performed using the online tool GSDS by comparing the coding DNA sequences (CDS) of rubber grass IMPβ genes with their corresponding genomic sequences [29].
2.5. Distribution of Cis-acting Elements in Promoter Regions
To study cis-acting elements in the promoter region of IMPβ genes in TKS, sequences 2000 bp upstream of each IMPβ initiation codon were retrieved from the TKS genome database. These sequences were analyzed using the online tool PlantCARE to predict cis-acting elements [30].
2.6. Gene-specific Expression Analysis
IMPβ gene expression levels were analyzed using RNA-sequencing data from different tissues and developmental stages of TKS; the raw sequencing data analyzed in this study were sourced from the NCBI BioProject database (accession: PRJNA539838) [31]. Briefly, clean reads were obtained after filtering raw data to remove low-quality sequences and were aligned to the TKS reference genome using HISAT2. Gene expression levels were normalized using the FPKM (Fragments per Kilobase of transcript per Million mapped reads) method. Differential expression between samples was statistically assessed with the DESeq2 package, where genes with |log2(fold change)|≥1 and an adjusted p-value<0.05 were considered significant. For visualization, the FPKM values were log-transformed as ln (X+1) and subsequently used to generate a heatmap. The final heatmap of IMPβ expression was created using Multi-Experiment Viewer (MeV) software [32].
2.7. Subcellular Localization
The coding sequences of TkIMPβ10, TkIMPβ11, and TkIMPβ27, excluding the stop codons, were independently cloned into the pCAMBIA Super 1300-GFP vector at the Hind III and Kpn I restriction sites to construct 35S::GFP-TkIMPβ10, 35S::GFP-TkIMPβ11 and 35S::GFP-TkIMPβ27. The primer sequences for these constructs were designed using Primer Premier 5 (Table 1). For transient expression analysis, Nicotiana benthamiana leaves were infiltrated with Agrobacterium tumefaciens (GV3101) carrying 35S::GFP-TkIMPβ10, 35S::GFP-TkIMPβ11, 35S::GFP-TkIMPβ27, or a control vector. The infiltrated plants were grown for three days, stained with DAPI, and observed under an LSM710 microscope (Zeiss, Germany) to detect green fluorescent protein (GFP) fluorescence signals.
| Primer Name | Sequence(5' to 3') | For experiment |
|---|---|---|
| GFP-TkIMPβ10 F | ATCGACTCTAGAAAGCTTCAACCAAAGGAAGAAGGCCTG | Subcellular Localization |
| GFP-TkIMPβ10 R | CTTGCTCACCATGGTACCCAATAGGCAGCGTTCCCATGA | |
| GFP-TkIMPβ11 F | ATCGACTCTAGAAAGCTTGCGTAAACATGCAGAAGAAAG | |
| GFP-TkIMPβ11 R | CTTGCTCACCATGGTACCAGAAATTGCACGACTTATGGC | |
| GFP-TkIMPβ27 F | ATCGACTCTAGAAAGCTTATGGACGATTCAACTCAGCAA | |
| GFP-TkIMPβ27 R | CTTGCTCACCATGGTACCCACAACATTTAGTCTCGAAAG | |
| Y2H-TkIMPβ10 F | GCCATGGAGGCCGAATTCCAACCAAAGGAAGAAGGCCTG | Transcriptional Activation Assay |
| Y2H-TkIMPβ10 R | CGGCCGCTGCAGGTCGACCAATAGGCAGCGTTCCCATGA | |
| Y2H-TkIMPβ11 F | GCCATGGAGGCCGAATTCGCGTAAACATGCAGAAGAAAG | |
| Y2H-TkIMPβ11 R | CGGCCGCTGCAGGTCGACAGAAATTGCACGACTTATGGC | |
| Y2H-TkIMPβ27 F | GCCATGGAGGCCGAATTCATGGACGATTCAACTCAGCAA | |
| Y2H-TkIMPβ27 R | CGGCCGCTGCAGGTCGACCACAACATTTAGTCTCGAAAG | |
| q-TkIMPβ10 F | CTAAACTCCCACATCAATC | RTq-PCR |
| q-TkIMPβ10 R | ATACTCATCCCACTAACAA | |
| q-TkIMPβ11 F | CTTAAAACAGTTCCAGGAGCA | |
| q-TkIMPβ11 R | TCTATGTTGTTCCTTGGCATC | |
| q-TkIMPβ27 F | GTAGCTCATCGGATCGGGATA | |
| q-TkIMPβ27 R | CTCTGTACCTGCCAACTCGAT | |
| GADPH F | AGTTGGTTTCGTGGTATGAC | |
| GADPHR | ACATGTCAGTGAACAGGTAGAC |
2.8 Transcriptional Activation Assay
The corresponding vectors were also transformed into yeast strains. The full-length sequences of TkIMPβ10, TkIMPβ11, and TkIMPβ27 (primers listed in Table 1) were cloned into the EcoR I and Sal I sites of the pGBKT7 vector (TaKaRa, Nanjing, China, Cat. No. 630489). Synthetic plasmids expressing each protein were then transformed into yeast. The interaction between pGBKT7-53 and pGADT7-T (TaKaRa, Cat. No. 630442) served as a positive control. Transcriptional activation was analyzed as described previously [33]. Transformed cells were cultured on SD/-Trp and SD/-Trp/-His/-Ade plates, and recombinant colonies were visualized after 3–5 days of incubation at 30 °C.
2.9. Plants Sowing and Treatments
The experiment was conducted in 2021–2022 using well-grown, uniformly sized, sterile TKS seedlings 20 days after sowing. The selected plants underwent the following treatments:
2.10. NaCl Stress Treatment
The plants were removed from the medium, and their roots were thoroughly washed with tap water to eliminate any residual medium. They were then quickly immersed in a solution containing 200 mM NaCl. Root samples were collected at 6, 12, and 24 h after treatment to analyze gene expression responses to salt stress. Three biological replicates were conducted at each time point. The control group was treated with distilled water containing 2.2% anhydrous ethanol.
2.11. Methyl Jasmonate and Ethylene Spraying Treatment
For hormone treatments, TKS leaves were sprayed with either 100 mg/L ethylene (Eth) or 0.8 mM methyl jasmonate (MeJA). Plants treated with distilled water containing 2.2% anhydrous ethanol served as controls. Root samples were collected at 6, 12, and 24 h after treatment to assess gene expression responses to hormones. Each treatment included three replicates.
2.12. Rtq-pcr of Impβ Gene after Nacl and Hormone Treatment
After treatment, root samples, including those from control plants, were collected at 6, 12, and 24 h. To ensure result reliability and reproducibility, samples for each treatment condition were collected from three different individuals to analyze gene responses to salt stress and hormone application (primers used are listed in Table 1). GAPDH (Genebank: DY821911) was selected as the reference gene for normalization in this study. It has been previously validated as a stable reference gene in TKS roots under various abiotic stress and hormone treatment conditions [34]. The SYBR Green qRT-PCR reaction mixture contained 5 μl of 2× SYBR Green PCR buffer, 0.5 μl of primers, and 5 ng of template DNA, with the total volume adjusted to 10 μl using double-distilled H2O. The PCR program comprised an initial step at 50 °C for 2 min, followed by 10 min at 95 °C, then 40 cycles of 95 °C for 15 s and 60 °C for 1 min. Data were analyzed using the 2−ΔΔCt method [35].
3. RESULTS
3.1. Identification of IMPβ Family Members of TKS
IMPβ gene family members from model organisms such as Arabidopsis thaliana and Oryza sativa were retrieved from NCBI and used to identify IMPβ gene family members in TKS through local BLAST analysis. The BLASTP program identified 43 TkIMPβ candidate genes (e-value < 1e-5). Pfam analysis was then conducted to confirm the presence of the protein kinase domain and the conserved IMPβ active center sequence, leading to the identification of 27 TkIMPβ gene family members. These genes were distributed across 26 distinct scaffold fragments within the assembled genome. Gene names were assigned based on scaffold size and chromosomal position, resulting in designations from TkIMPβ1 to TkIMPβ27 (Fig. 1). The open reading frames (ORFs) of TkIMPβ genes in TKS varied in length, with TkIMPβ12 being the shortest (276 bp) and TkIMPβ27 the longest (3531 bp). The encoded proteins ranged from 91 to 1176 aa in length, with relative molecular masses between 10.38 kD and 130.22 kD. TkIMPβ24 had the lowest isoelectric point (4.60), while TkIMPβ11 had the highest (6.26). Chromosome location analysis revealed that TkIMPB1, TkIMPB5, TkIMPB8, TkIMPB10, TkIMPB13, TkIMPB18, TkIMPB22, TkIMPB23, TkIMPB24, and TkIMPB26 were located in the cytoplasm. Furthermore, TkIMPB3 and TkIMPB20 were located in both the cytoplasm and nucleus, while TkIMPB15 and TkIMPB21 were present in both the cytoplasm and mitochondria. TkIMPβ14 was located in the vacuole, whereas the remaining gene family members were localized in the nucleus (Table 2).
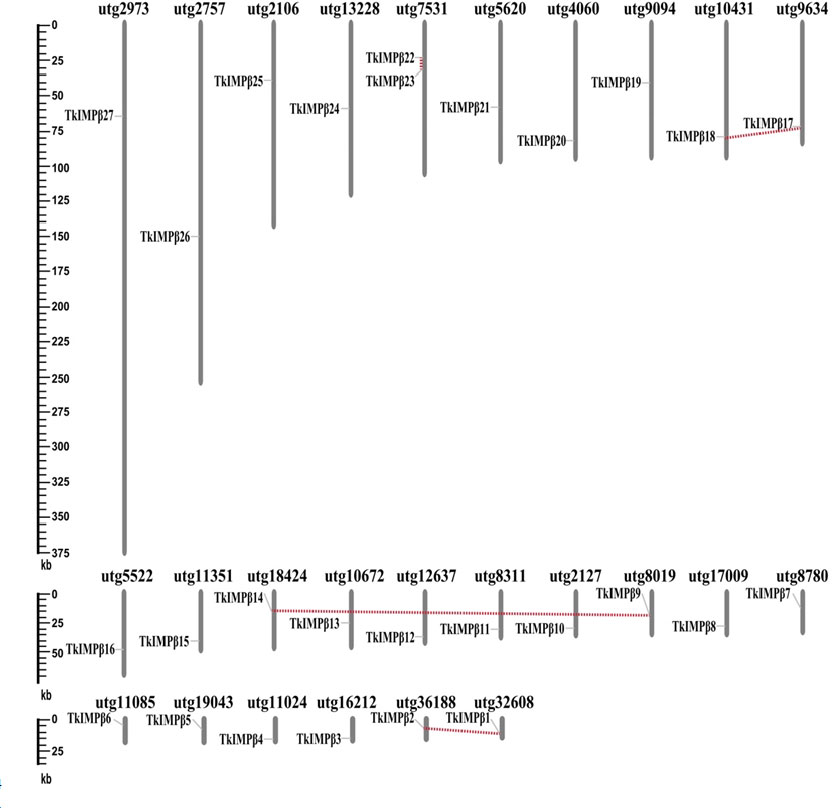
Location of IMPβ genes on chromosomes in TKS. Twenty-seven TkIMPβ genes were located on 26 different genomic scaffolds. The naming order of IMPβ members was based on the scaffold length, and four groups of replicators were indicated by a red dotted line (nucleic acid homology > 90%). The scale on the left represents the chromosome length (kb), the Utg number at the top represents the chromosome name, and the solid line on the scaffold of 26 genomes indicates the position of the corresponding gene on the chromosome.
| Gene | Gene ID | ORF/bp | Protein | |||
|---|---|---|---|---|---|---|
| Size/aa | (MW/kD) | pI | Subcellular Localization | |||
| TkIMPB1 | evm. TU. utg32608.5 | 3024 | 1007 | 112.33 | 4.84 | Cytoplasmic |
| TkIMPB2 | evm. TU. utg36188.3 | 3126 | 1041 | 116.07 | 4.87 | Nuclear |
| TkIMPB3 | evm. TU. utg16212.6 | 2913 | 970 | 108.78 | 5.42 | Cytoplasmic, Nuclear |
| TkIMPB4 | evm. TU. utg11024.4 | 1623 | 540 | 61.43 | 5.92 | Nuclear |
| TkIMPB5 | evm. TU. utg19043.5 | 3369 | 1122 | 123.71 | 4.82 | Cytoplasmic |
| TkIMPB6 | evm. TU. utg11085.1 | 2970 | 989 | 113.63 | 5.53 | Nuclear |
| TkIMPB7 | evm. TU. utg8780.5 | 2610 | 869 | 97.00 | 4.98 | Nuclear |
| TkIMPB8 | evm. TU. utg17009.9 | 3216 | 1071 | 123.23 | 5.44 | Cytoplasmic |
| TkIMPB9 | evm. TU. utg8019.8 | 3096 | 1031 | 113.94 | 4.76 | Nuclear |
| TkIMPB10 | evm. TU. utg2127.5 | 2892 | 963 | 107.01 | 5.33 | Cytoplasmic |
| TkIMPB11 | evm.TU. utg8311.5 | 3162 | 1053 | 119.11 | 6.26 | Nuclear |
| TkIMPB12 | evm. TU. utg12637.8 | 276 | 91 | 10.38 | 5.26 | Nuclear |
| TkIMPB13 | evm. TU. utg10672.2 | 3186 | 1061 | 122.08 | 5.94 | Cytoplasmic |
| TkIMPB14 | evm. TU. utg18424.4 | 3096 | 1031 | 113.97 | 4.78 | Vacuolar |
| TkIMPB15 | evm. TU. utg11351.9 | 3375 | 1124 | 125.00 | 5.96 | Mitochondrial, Cytoplasmic |
| TkIMPB16 | evm. TU. utg5522.8 | 3342 | 1113 | 123.15 | 4.76 | Nuclear |
| TkIMPB17 | evm. TU. utg9634.17 | 3336 | 1111 | 122.89 | 4.72 | Nuclear |
| TkIMPB18 | evm. TU. utg10431.21 | 3207 | 1068 | 118.20 | 4.71 | Cytoplasmic |
| TkIMPB19 | evm. TU. utg9094.7 | 3219 | 1072 | 119.89 | 5.55 | Nuclear |
| TkIMPB20 | evm. TU. utg4060.12 | 2667 | 888 | 98.07 | 4.63 | Cytoplasmic, Nuclear |
| TkIMPB21 | evm.TU. utg5620.9 | 2703 | 900 | 101.95 | 5.98 | Mitochondrial, Cytoplasmic |
| TkIMPB22 | evm. TU. utg7531.4 | 3078 | 1025 | 117.39 | 4.85 | Cytoplasmic |
| TkIMPB23 | evm.TU. utg7531.5 | 3081 | 1026 | 117.53 | 4.91 | Cytoplasmic |
| TkIMPB24 | evm. TU. utg13228.6 | 2619 | 872 | 96.93 | 4.60 | Cytoplasmic |
| TkIMPB25 | evm. TU. utg2106.11 | 3162 | 1053 | 115.29 | 4.82 | Nuclear |
| TkIMPB26 | evm. TU. utg2757.32 | 2592 | 863 | 96.03 | 4.68 | Cytoplasmic |
| TkIMPB27 | evm. TU. utg2973.12 | 3531 | 1176 | 130.22 | 5.62 | Nuclear |
3.2. Analysis of Conserved Motif Distribution of IMPβ Gene Family Members in TKS
Motifs 3, 5, 9, 10, 11, 12, 17, 18, 19, 20, 21, 22, 23, 24, 25, 26, 29, 30, 31, 32, 33, 34, 35, 36, 37, and 38 were found in the IBN-N domain. Motifs 2, 6, 7, 8, 9, 13, 14, 15, 27, 31, and 37 were present in the HEAT domain. Motifs 33 and 38 were identified in the Cse1 domain, while Motif 37 was found in the CAS-Cse1 domain. Motifs 1, 20, 34, 37, 38, 39, and 40 were associated with the Xpo1 domain.
Additionally, motifs 4, 16, and 28 were present in the CRM1-C domain.
To investigate the evolutionary conservation of IMPβ sequences in TKS, we analyzed the distribution of conserved motifs across 27 IMPβ gene family members using MEME. A total of 40 conserved motifs were predicted. Phylogenetic analysis revealed that members with close genetic relationships exhibited similar conserved motif distributions (Fig. 2).
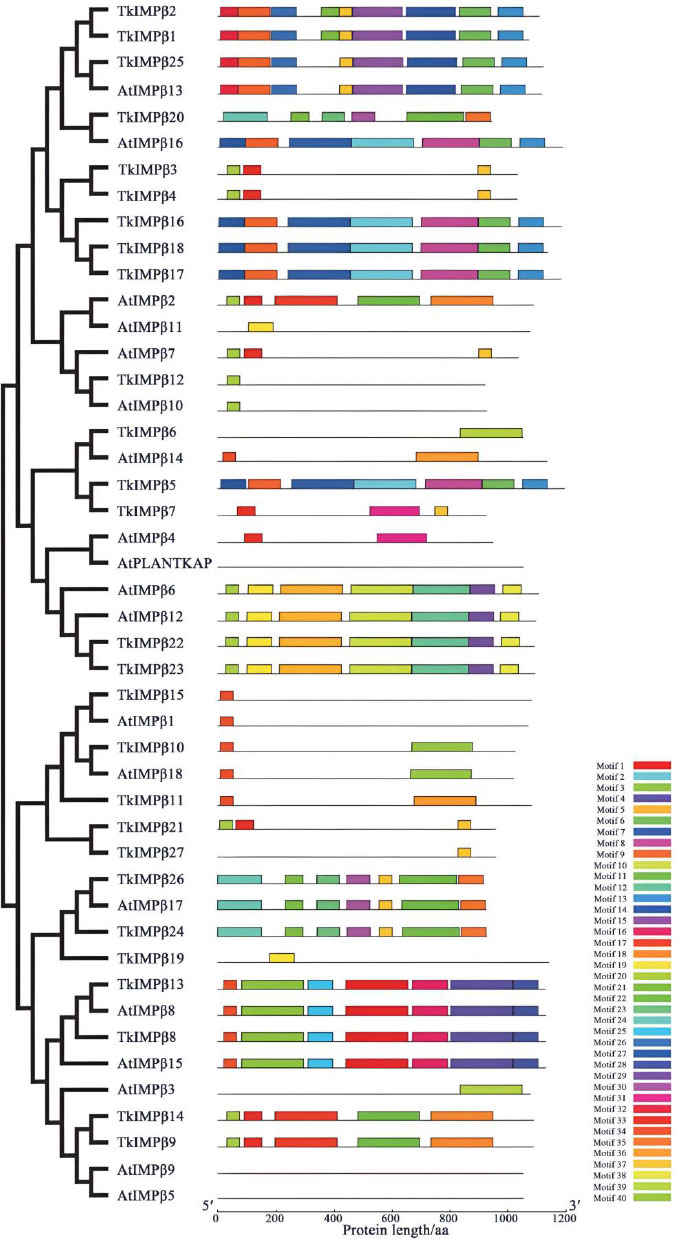
Conserved motifs in IMPβ proteins were identified using the MEME online software based on amino acid sequence analysis.
The number of motifs in each TkIMPβ ranged from 0 to 9. Identical motif patterns were observed in TkIMPβ1 and TkIMPβ2; TkIMPβ3 and TkIMPβ4; TkIMPβ16, TkIMPβ17, and TkIMPβ18; TkIMPβ22 and TkIMPβ23; TkIMPβ24 and TkIMPβ26; TkIMPβ8 and TkIMPβ13; and TkIMPβ9 and TkIMPβ14. Some motifs were unique to specific genes: Motif 31 to TkIMPβ7, Motif 36 to TkIMPβ11, Motif 39 to TkIMPβ6, and Motif 40 to TkIMPβ10. Additionally, Motifs 1, 3, 4, 16, 25, and 28 were unique to TkIMPβ8 and TkIMPβ13; Motifs 5, 10, 12, 29, and 38 were unique to TkIMPβ22 and TkIMPβ23; Motifs 17, 18, and 22 were unique to TkIMPβ9 and TkIMPβ14; and Motifs 15, 26, and 32 were unique to TkIMPβ2.
The motif distribution patterns described above elucidate the functional and structural basis of the TKS IMPβ family. The conserved motifs enriched in domains such as HEAT and IBN-N constitute HEAT repeat units composed of α-helical pairs. The superhelical skeleton assembled from these units serves as the core structural basis for the interaction of IMPβ proteins with the nuclear pore complex (NPC), RanGTPase, and cargo proteins [36, 37]. Furthermore, the compositional differences in motifs between importins (e.g., those containing the IBN-N domain) and exportins (e.g., those containing the Xpo1 or CRM1-C domains) directly determine the specificity of their nucleocytoplasmic transport direction. It is noteworthy that some member-specific motifs (e.g., Motif 31 in TkIMPβ7) are likely located in the variable loop regions responsible for substrate recognition [38]. This structural diversity enables different TkIMPβ members to precisely transport specific “cargoes,” including hormone and stress-response factors, thereby underpinning their broad functional diversity in TKS.
3.3. Evolution Analysis of the IMPβ Gene Family in TKS
To better understand the evolutionary relationship between the IMPβ gene families of TKS and various species, we constructed a phylogenetic tree including Arabidopsis thaliana (19 IMPβs), Hevea brasiliensis (29 IMPβs), Oryza sativa (8 IMPβs), and TKS (27 IMPβs) (Fig. 3).
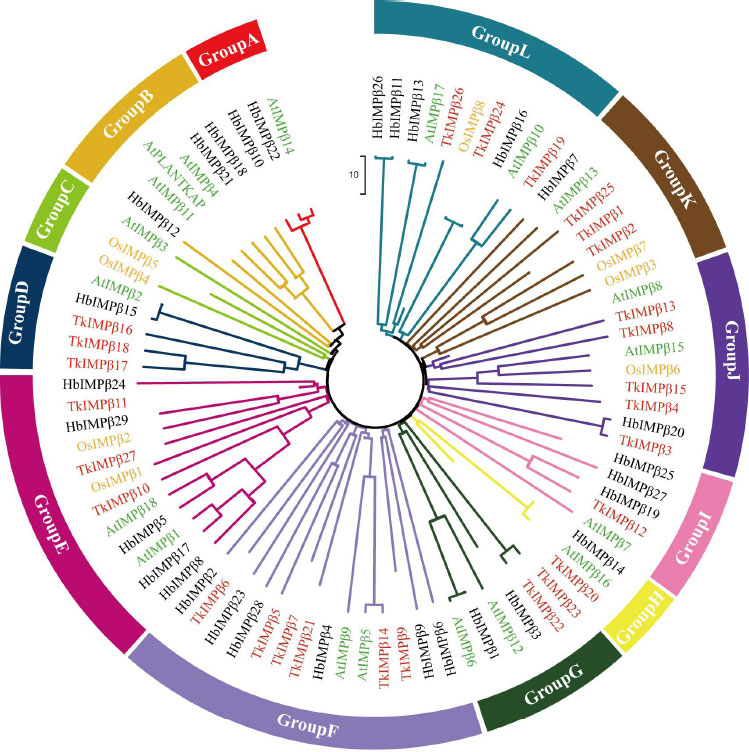
Phylogenetic tree of IMPβ families in TKS and other plants. Proteins of Tk. Taraxacum kok-saghyz; At. Arabidopsis thaliana; Os. Oryza sativa; Hb. Hevea brasiliensis (in colour according to their respective classes).
Based on the phylogenetic tree structure, IMPβs were classified into 12 subfamilies. TkIMPβ16, TkIMPβ17, and TkIMPβ18 clustered in subgroup D; TkIMPβ10, TkIMPβ11, and TkIMPβ27 in subgroup E; TkIMPβ5, TkIMPβ6, TkIMPβ7, TkIMPβ9, TkIMPβ14, and TkIMPβ21 in subgroup F; TkIMPβ22 and TkIMPβ23 in subgroup G; TkIMPβ20 in subgroup H; TkIMPβ12 in subgroup I; TkIMPβ3, TkIMPβ4, TkIMPβ8, TkIMPβ13, and TkIMPβ25 in subgroup K; and TkIMPβ19, TkIMPβ24, and TkIMPβ26 in subgroup G. Subgroups A, B, and C contained no TKS IMPβ genes, possibly due to functional differentiation over long-term evolution. Analysis of conserved domains within these 12 TkIMPβ subfamilies revealed that subgroup D members exclusively possessed the HEAT domain. While TkIMPβ11, resembling HbIMPβ29 in the rubber tree, contained only the IBN-N domain, other subgroup E members exhibited either the IBN-N and Xpo1 domains or only the Xpo1 domain. In group J, TkIMPβ15 possessed only the Xpo1 domain, whereas other members contained either the IBN-N, Cse1, and CAS-Cse1 domains or the IBN-N, Xpo1, and CRM1-C domains.
Group K members contained both the IBN-N and HEAT domains, whereas the remaining subgroup members possessed only the IBN-N domain. These findings indicate notable evolutionary differences within the IMPβ gene family in TKS, with members sharing close evolutionary relationships exhibiting similar domain compositions. For example, TkIMPβ8 and TkIMPβ13 in subgroup J contained the IBN-N, Xpo1, and CRM1-C domains, which facilitate the export of proteins carrying leucine-rich nuclear export signals. Based on this, we can infer the functions of TKS IMPβ family members by drawing comparisons with IMPβ homologs in Arabidopsis and other species. This insight provides a valuable foundation for further research into the functions of the IMPβ family in TKS.
3.4. Exon-intron Structure Analysis of the IMPβ Gene Family in TKS
Figure 4 illustrates the complex gene structure of the IMPβ family in TKS. Notably, TkIMPβ3, TkIMPβ12, and TkIMPβ21 have a simple structure comprised of a single exon and no introns. In contrast, most TkIMPβs exhibit a more complex organization, containing over 15 exons and introns (Fig. 4). The number of exons across all TkIMPβs ranges from 1 to 31, with closely related members displaying similar exon-intron patterns, as observed in TkIMPβ24 and TkIMPβ26. The intron-exon structures of the identified paralogs-TkIMPβ1/TkIMPβ2, TkIMPβ9/TkIMPβ14, TkIMPβ17/TkIMPβ18, and TkIMPβ22/TkIMPβ23-were nearly identical. Protein motif and amino acid length analyses further highlight the functional diversification of the 27 TkIMPβ family members. These findings suggest that TkIMPβ family members may have diverse roles in nuclear-cytoplasmic transport.
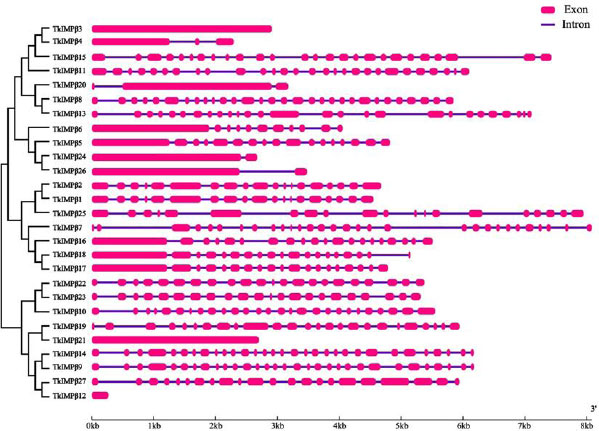
Phylogenetic relationships, domain composition, and intron-exon structures of TKS HMTs and HDMs.
3.5. Distribution of Cis-acting Elements in the Promoter Regions of the IMPβ Gene Family in TKS
The upstream nucleic acid sequences (2000 bp) preceding the transcription start sites of IMPβ genes were obtained to examine the distribution of cis-acting elements in the promoter regions. The results were organized according to the phylogenetic tree sequence and represented using different colors or shapes in Fig. (5). By integrating these findings with the statistics in Table 3, it was possible to demonstrate that the promoter regions of TkIMPβ genes contain various cis-acting elements. Specifically, these include three elements related to transcription initiation, five associated with growth, 11 linked to hormone responses, four involved in stress responses, and 18 responsive to light. These findings suggest that the expression of TkIMPβ genes is regulated by different stress factors and hormones. Notably, the promoter regions of TkIMPβ17 and TkIMPβ18, which are involved in replication, exhibit similar distributions of cis-acting elements.
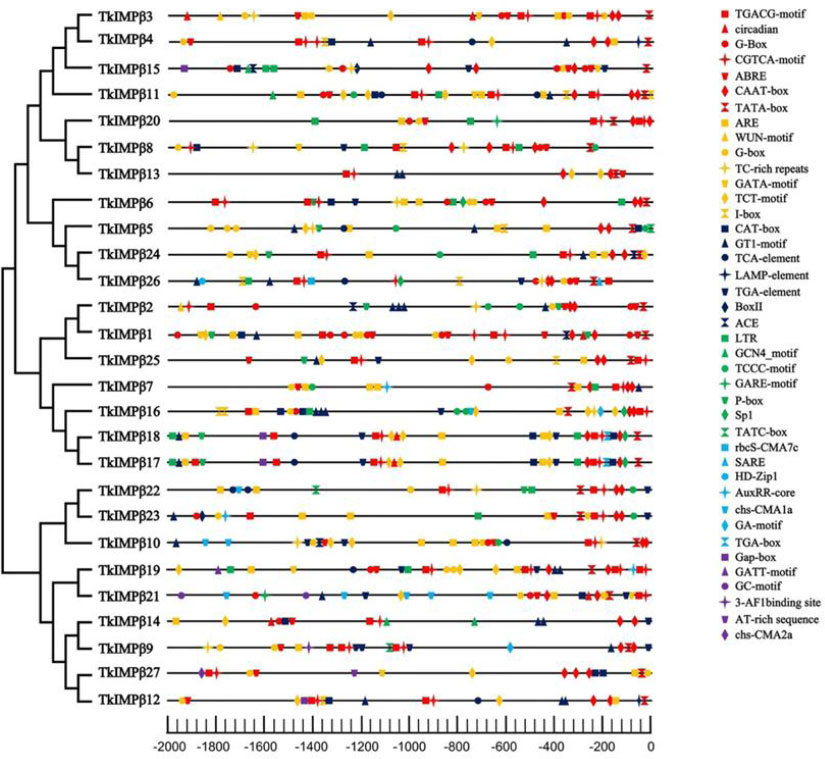
Distribution of cis-elements in the promoter regions of TkIMPβ genes.
| Element Properties | Name |
|---|---|
| Transcription initiation-related cis-elements | CAAT-box, TATA-box, AT-rich sequence |
| Growth-related cis-elements | ARE, circadian, CAT-box, GCN4_motif, HD-Zip1 |
| Hormone responsive cis-elements | TGA-element, TATC-box, TCA-element, SARE, ABRE, AuxRR-core, TGACG-motif, CGTCA-motif, P-box, GARE-motif, TGA-box |
| Stress response-related cis-elements | TC-rich repeats, LTR, GC-motif, WUN-motif |
| The optical response-related cis-elements | ACE, G-Box, G-box, GT1-motif, Sp1, 3-AF1binding site, GATA-motif, TCT-motif, I-box, LAMP-element, BoxII, Gap-box, TCCC-motif, rbcS-CMA7c, chs-CMA1a, GA-motif, GATT-motif, chs-CMA2a |
3.6. Expression Pattern Analysis of IMPβ Gene Family Members in TKS
To further assess the functions of IMPβ gene family members in TKS and their role in regulating the synthesis of natural rubber biosynthetic proteins, transcriptome data were used to analyze the expression profiles of 27 TkIMPβ genes. Root and mature leaf samples were selected for this analysis at growth stages of 1, 2, 6, 12, and 18 months (M). Expression analysis of the 27 TkIMPβ genes revealed that TkIMPβ3, TkIMPβ5, TkIMPβ7, TkIMPβ13, TkIMPβ16, TkIMPβ23, and TkIMPβ24 maintained stable expression in both roots and leaves, suggesting that these genes may have essential functions in these tissues, particularly in nuclear transport. In contrast, TkIMPβ1, TkIMPβ2, TkIMPβ4, TkIMPβ12, TkIMPβ14, and TkIMPβ21 exhibited lower expression levels, indicating that their roles may be less significant under normal growth conditions.
In the roots from 2M to 6M, except for TkIMPβ10, TkIMPβ15, TkIMPβ19, and TkIMPβ26, the expression levels of other genes remained largely unchanged. The expression levels of TkIMPβ19 initially decreased and then increased, whereas those of TkIMPβ10, TkIMPβ15, and TkIMPβ26 exhibited the opposite trend. Compared with 6-month-old roots, only the expression levels of TkIMPβ3, TkIMPβ4, TkIMPβ5, TkIMPβ12, TkIMPβ16, TkIMPβ20, TkIMPβ21, and TkIMPβ24 remained relatively stable in 12-month-old roots, while the remaining genes showed a decreasing trend. Compared with 12-month-old roots, TkIMPβ3, TkIMPβ5, TkIMPβ16, and TkIMPβ25 maintained high expression levels in 18-month-old roots, whereas TkIMPβ20 showed a decline. The expression levels of all other genes increased.
Furthermore, Fig. 6 illustrates the growth stage-dependent peak expression levels of the 27 TkIMPβ genes in roots. Analysis of genes expressed at high and moderate levels showed that TkIMPβ13, TkIMPβ23, and TkIMPβ24 exhibited the highest expression at the 1M stage, while TkIMPβ3, TkIMPβ5, TkIMPβ7, and TkIMPβ16 peaked at the 18 M stage. The remaining genes had their highest expression at either the 2M or 6M stages. Thus, the expression levels of TkIMPβ1, TkIMPβ2, TkIMPβ4, TkIMPβ12, TkIMPβ14, and TkIMPβ21 peaked at specific stages of root development but remained consistent throughout growth and development.
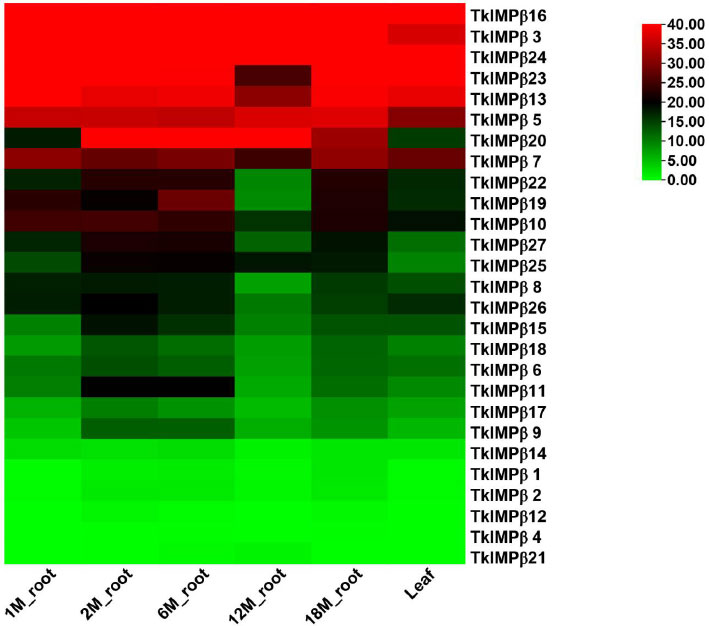
Expression profiles of TkIMPβ genes with hierarchical clustering in roots and mature leaves from 1M to 18M. The heatmap color scale on the right indicates expression levels: red represents high transcript abundance, and green represents low transcript abundance.
Within the TkIMPβ family of 27 members, TkIMPβ3, TkIMPβ5, TkIMPβ7, TkIMPβ13, TkIMPβ16, TkIMPβ23, and TkIMPβ24 exhibited high expression levels in mature TKS leaves, with TkIMPβ16 showing the highest expression. In contrast, the remaining members displayed minimal, barely detectable expression. A comparative analysis of expression levels between roots and mature leaves at 18 M revealed significant differences in TkIMPβ10, TkIMPβ19, TkIMPβ20, TkIMPβ22, TkIMPβ25, and TkIMPβ27, indicating that these genes are primarily expressed in roots rather than leaves.
3.7. Subcellular Localization
To explore the potential functions of TkIMPβ10, TkIMPβ11, and TkIMPβ27, we performed subcellular localization studies by injecting Agrobacterium cultures containing 35S::GFP-TkIMPβ10, 35S::GFP-TkIMPβ11, and 35S::GFP-TkIMPβ27 vectors into Nicotiana benthamiana leaves. As shown in Fig. (7), the GFP fluorescence signal mainly appeared in the nucleus. Compared with the 35S::GFP empty vector control, fluorescence signals of 35S::GFP- TkIMPβ10, 35S::GFP- TkIMPβ11, and 35S::GFP- TkIMPβ27 were also detected in the nucleus.
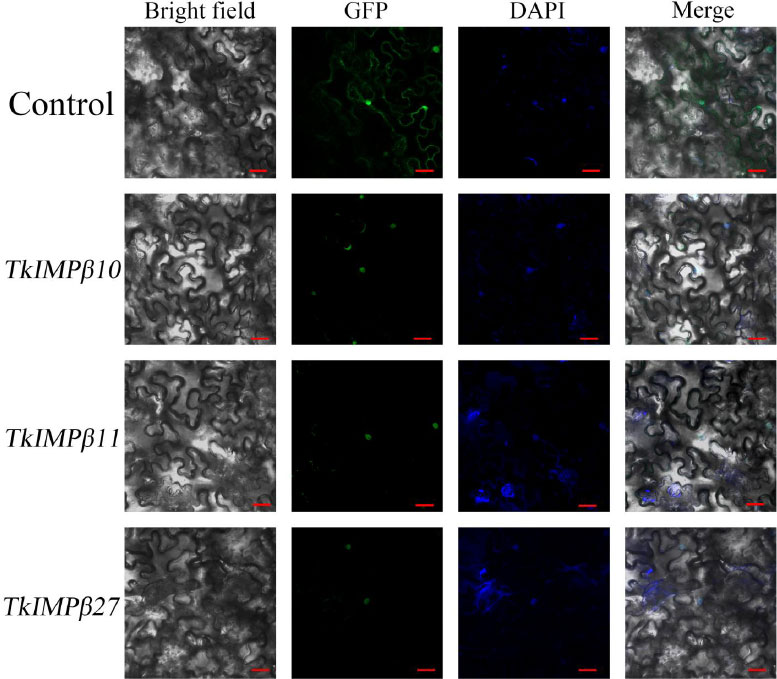
Subcellular localization of TkIMPβ10, TkIMPβ11, and TkIMPβ27. Nicotiana benthamiana leaves transformed with 35S::GFP served as controls. Green represents the fluorescent signal of green fluorescent protein (GFP), blue indicates the nucleus visualized by DAPI staining, and “Merge” shows the merged images.
3.8. Yeast Two-hybrid Transcriptional Activation Analysis
In this study, the Y2HGold-GAL4 system was used to test whether TkIMPβ10, TkIMPβ11, and TkIMPβ27 exhibit autoactivating transcriptional activity, with the empty pGBKT7 vector as a negative control. BD-p53 and AD-SV40 large T antigen served as positive controls (Fig. 8). All transformed yeast cells grew normally on SD/Trp medium. However, on SD/Trp-/His-/Ade- medium, only the positive control showed normal growth, while the negative control and yeast cells transformed with TkIMPβ10, TkIMPβ11, and TkIMPβ27 recombinant vectors failed to grow. This indicates that TkIMPβ10, TkIMPβ11, and TkIMPβ27 lack transcriptional activity in yeast cells.
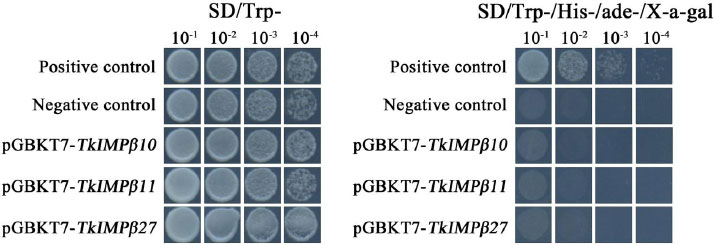
Transcriptional activity analysis of TkIMPβ10, TkIMPβ11, and TkIMPβ27. Ad-SV40 large T-antigen was used as a positive control, and the pGBKT7 empty vector served as a negative control.
3.9. The Expression Levels of TkIMPβ10, TkIMPβ11 and TkIMPβ27 Genes After NaCl and Hormone Treatment
In this study, we analyzed the mRNA expression levels of TkIMPβ10, TkIMPβ11, and TkIMPβ27 in TKS under NaCl salt stress and methyl jasmonate (MeJA) and ethylene (Eth) treatments for 6, 12, and 24 h. As shown in Fig. (9A), TkIMPβ10 expression remained unchanged after 6 and 12 hours of MeJA treatment compared with the control (CK). However, TkIMPβ11 and TkIMPβ27 were significantly downregulated at 6 h (p < 0.05, LSD test). By 24 hours, all three genes showed their lowest expression levels (p < 0.05, LSD test). In Fig. (9B), under Eth treatment, the expression of TkIMPβ10, TkIMPβ11, and TkIMPβ27 significantly decreased at 6 and 12 h compared with CK but rebounded by 24 h. In Fig. (9C), under NaCl stress, none of the genes showed significant expression changes at 6 hours. However, their expression levels significantly decreased at 12 h. By 24 h, expression partially recovered but remained significantly lower than CK (p < 0.05, LSD test).
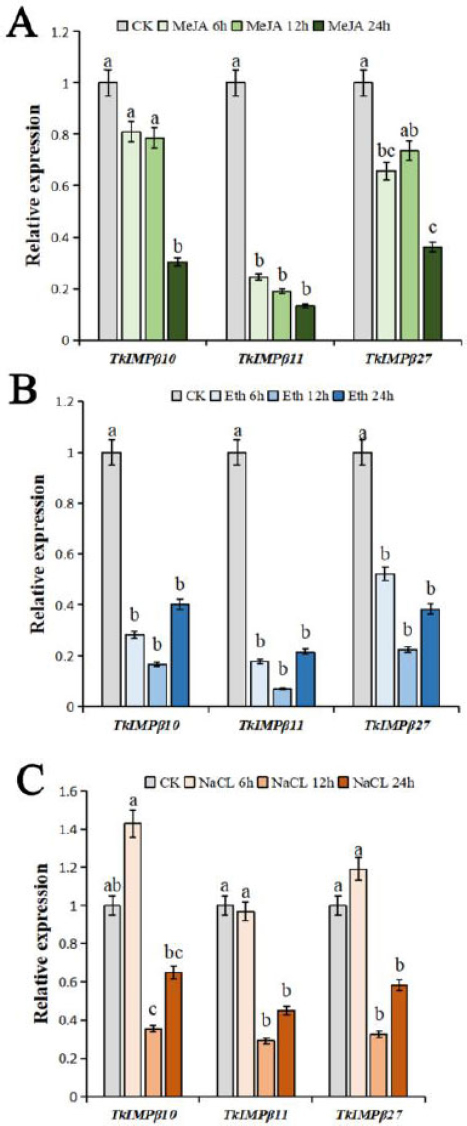
The expression levels of TkIMPβ10, TkIMPβ11, and TkIMPβ27 in TKS under NaCl stress and treatment with methyl jasmonate (MeJA) and ethylene (Eth) for 6, 12, and 24 hours. (A) Expression changes of TkIMPβ10, TkIMPβ11, and TkIMPβ27 in response to MeJA treatment. (B) Expression changes of TkIMPβ10, TkIMPβ11, and TkIMPβ27 in response to Eth treatment. (C) Expression changes of TkIMPβ10, TkIMPβ11, and TkIMPβ27 under NaCl stress. The error bar represents the mean ± standard error (Mean ± SE) of the three biological replicates. Different letters indicate significant differences (p < 0.05, LSD).
4. DISCUSSION
The organization of life-sustaining processes and the precise regulation of cellular functions depend on the controlled movement of biological macromolecules between the nucleus and cytoplasm [39]. Disruptions in the nuclear transport regulation can lead to substrate transport irregularities, potentially contributing to disease development and progression. In eukaryotic cells, DNA transcription occurs in the nucleus, while protein synthesis takes place in the cytoplasm. The nuclear membrane serves as a barrier, separating these compartments [40], making the transport of molecules across it essential for cell function [41]. While ions, metabolites, and some small neutral proteins diffuse passively, molecules larger than 40 kDa require active transport mechanisms, utilizing transport factors within the nuclear pore complex for import and export [42]. In plant cells, this selective bidirectional transport regulates diverse cellular activities, maintains physiological balance, controls differentiation, and enables responses to environmental signals and stress through processes like signal transduction and gene expression [43].
Importin-β (IMPβ) family members are nuclear transporters widely distributed in eukaryotes. They function as nuclear transport receptors, forming complexes with cargo in the cytoplasm (where RanGTP levels are low) and releasing them in the nucleus upon RanGTP binding [44]. Typically weighing 95–145 kDa with low sequence similarity, IMPβ members share a conserved structure: an N-terminal Ran-binding domain, a central HEAT repeat domain, and a C-terminal domain for substrate or adaptor protein binding [45]. In plants, the IMPβ family regulates crucial processes such as hormone signaling, flowering, pathogen resistance, and stress tolerance [20]. This study identified 27 members of the TkIMPβ gene family in TKS. Chromosome location indicated that most are nuclear-localized.
Evolutionary analysis across Arabidopsis thaliana, Hevea brasiliensis, Oryza sativa, and TKS classified the IMPβ genes into 12 distinct families based on sequence conservation. The expansion to 27 members in TKS, compared to approximately 17 in Arabidopsis but similar to 27 in Zea [20], suggests a complex and potentially specialized nuclear transport network in TKS. This expansion may underpin its need to integrate precise developmental and environmental signals, particularly those related to rubber biosynthesis and adaptation to temperate climates. Notably, homologs such as AtIMPβ1 /AtKPNB1 in Arabidopsis are positive regulators of growth, and OsIMPβ1 in Oryza sativa is pollen-specific [46]. The identification of TKS homologs within these conserved subfamilies allows for functional predictions. For instance, TkIMPβ10, TkIMPβ11, and TkIMPβ27 cluster in the same phylogenetic subgroup (E) as OsIMPβ1, OsIMPβ2, and AtIMPβ1, suggesting conserved roles in growth and development.
Gene structure analysis revealed that while TkIMPβ3, TkIMPβ12, and TkIMPβ21 are intronless, most members contain over 15 introns and exons. Duplicated gene pairs TkIMPβ1/TkIMPβ2, TkIMPβ9/TkIMPβ14, TkIMPβ17/TKIMPβ18, and TkIMPβ22/TkIMPβ23 exhibit nearly identical intron-exon structures, a pattern often linked to tandem duplication and the emergence of new genes with specialized functions [47]. Motif analysis further supports functional diversification. The conserved motifs enriched in HEAT and IBN-N domains form the superhelical skeleton essential for interactions with the NPC, RanGTPase, and cargo proteins [36, 37]. The distinct motif composition between importins (e.g., IBN-N-containing) and exportins (e.g., Xpo1-containing) underlies their transport direction specificity. Member-specific motifs, such as Motif 31 in TkIMPβ7, likely reside in variable loop regions critical for substrate recognition [38, 39], potentially enabling the transport of unique cargoes, including transcription factors specific to rubber biosynthesis or stress responses.
Expression analysis revealed distinct patterns among TkIMPβ members. TkIMPβ10, TkIMPβ19, TkIMPβ20, and TkIMPβ22 were preferentially expressed in roots, the primary site of natural rubber biosynthesis (NRB) in TKS, implying a critical role in this process. In contrast, TkIMPβ1, TkIMPβ2, TkIMPβ4, TkIMPβ12, TkIMPβ14, and TkIMPβ21 remained largely unchanged, indicating their potential function as housekeeping genes, which requires more in-depth investigation. Our findings collectively demonstrate the essential role of TkIMPβ family members in natural rubber production and suggest that these genes could serve as valuable resources for investigating rapid changes in NRB-related protein content following exposure to heavy metals in future studies. Recently, a total of 102 NRB-related gene and protein members were identified, including 10 cis-isoprene transferases (CPT), 8 small rubber particle proteins (SRPP), 2 rubber elongation factors (REF), and one HRT1-REF bridging protein (HRBP). Among these, CPT7, SRPP5, SRPP6, and SRPP9 might play more important roles in NRB within TKS roots [35]. Given this, it would be valuable to prioritize research on the relationships between IMPβ gene family members and genes and proteins involved in natural rubber biosynthesis (NRB).
Based on the phylogenetic tree and expression patterns of IMPβ gene family members in TKS, we selected TkIMPβ10, TkIMPβ11, and TkIMPβ27 for subcellular localization analysis. In the phylogenetic tree, these genes belong to the E subgroup, where their Arabidopsis and rubber tree counterparts are associated with growth and development. Therefore, we speculate that TkIMPβ10, TkIMPβ11, and TkIMPβ27 belong to the same subfamily as OsIMPβ1, OsIMPβ2, and AtIMPβ1 and may have similar functions. Subcellular localization analysis revealed that TkIMPβ10, TkIMPβ11, and TkIMPβ27 were primarily expressed in the nucleus, suggesting their potential roles in nuclear material transport or signal transduction. Additionally, latex cell development is the most active before 6M. The expression patterns of these genes in TKS showed peak expression in roots at 2M and 6M, followed by a significant decline at 12M, with little to no expression in leaves. Further yeast two-hybrid assays confirmed that they lack intrinsic transcriptional activation, indicating that they function not as transcription factors but likely as transporters facilitating the nuclear import of cargo proteins. This aligns with the canonical role of IMPβ family members.
To further investigate the specific roles of TkIMPβ10, TkIMPβ11, and TkIMPβ27 in rubber biosynthesis and plant responses to environmental stress, we conducted NaCl stress and MeJA and Eth hormone treatments. In the NaCl stress experiment, the expression of these genes decreased at 12 h but increased by 24 hours, a biphasic response common in stress-adaptive genes [48, 49].
In the MeJA treatment experiment, TkIMPβ11 and TkIMPβ27 showed a rapid downregulation at 6h, indicating a role in the early MeJA response. TkIMPβ10 responded later, suggesting differential regulation within the family for fine-tuning JA-mediated processes, which are central to induced defense and rubber biosynthesis [50]. In the Eth treatment experiment, the expression levels of TkIMPβ10, TkIMPβ11, and TkIMPβ27 significantly decreased after 6 and 12 h of treatment but increased after 24 h. These findings suggest that these genes may be involved in ethylene signal transduction. Previous studies reported a similar response in Synechocystis, where Eth treatment caused a rapid but transient decrease in transcript levels of etr1, slr1213, and slr1214 during phototaxis [51]. Hence, we conclude that a comprehensive analysis of the IMPβ family in additional rubber-producing plants, such as Parthenium hysterophorus and Eucommia ulmoides, could provide deeper insights into the role of IMPβ genes in regulating natural rubber biosynthesis.
Notably, three nuclear localization genes-TkIMPβ10, TkIMPβ11, and TkIMPβ27 (Fig. 7)-are preferentially expressed during development but show a significant negative correlation under salt stress, MeJA, and Eth treatments. Similarly, previous research has demonstrated that cis-acting elements play a crucial role in plant responses to abiotic stress as well as growth and development [52, 53]. Our analysis of TkIMPβ cis-elements revealed numerous stress- and hormone-responsive cis-elements in the promoter regions of TkIMPβ10, TkIMPβ11, and TkIMPβ27 (Fig. 5). For example, all three contain MeJA response elements (TGACG-motif, CGTCA-motif) and the abiotic stress response element ABRE, which are key regulators of plant defense against biotic and abiotic stresses. Additionally, most TkIMPβ members contain Tc-rich repeats and MBS [54], which are essential for plant stress response and defense. These findings align with previous research, indicating that SAPs are closely associated with stress responses [55].
5. STUDY LIMITATIONS
Several limitations of this study should be acknowledged. First, functional characterization was performed only for TkIMPβ10, TkIMPβ11, and TkIMPβ27, while the remaining 24 family members await experimental validation through stable transgenic approaches or CRISPR/Cas9-based mutagenesis in future work. Second, the subcellular localization and Y2H assays were conducted in heterologous systems (Nicotiana benthamiana and yeast), which cannot fully recapitulate the native physiological environment of TKS cells—particularly the RanGTP nuclear-cytoplasmic gradient that dynamically regulates the conformation of nuclear pore complexes and the cargo-binding affinity of importin β proteins. Consequently, the in vivo transport efficiency and spatiotemporal specificity of TkIMPβ proteins remain to be verified in their endogenous context. Third, although transcriptomic data revealed distinct expression patterns, the destructive nature of rubber yield quantification precluded simultaneous measurement of gene expression and rubber accumulation in the same individuals across developmental time courses, leaving the direct causal relationship between TkIMPβ expression and natural rubber biosynthesis to be established. Despite these limitations, this study provides the first systematic characterization of the IMPβ family in TKS and establishes a foundational resource for future functional investigations.
CONCLUSION
In conclusion, the analysis of the IMPβ gene family in TKS provides valuable insights into its functions and regulatory mechanisms. Genomic data acquisition and subsequent analysis identified 27 TkIMPβ family members, a number comparable to that in other plant species. Gene structure analysis revealed both similarities and variations among members with replication-based relationships, indicating evolutionary differentiation. Phylogenetic analysis classified the TkIMPβ family into subfamilies and identified four groups of replication factors. Additionally, expression analysis indicated that some TkIMPβ genes are closely linked to rubber production-related functions, suggesting their role in regulating natural rubber synthesis. Subcellular localization and yeast two-hybrid experiments confirmed that TkIMPβ10, TkIMPβ11, and TkIMPβ27 are not transcription factors but function as nuclear transport proteins involved in the transport or signal transduction of nuclear substances. Further experiments involving NaCl stress and MeJA and Eth hormone treatments explored the specific roles of TkIMPβ10, TkIMPβ11, and TkIMPβ27 in rubber biosynthesis and plant responses to environmental stress. These findings provide a comprehensive understanding of the evolution and expression patterns of the IMPβ family in TKS and offer potential gene targets for molecular breeding strategies aimed at enhancing rubber production. Overall, this study expands our knowledge of the IMPβ gene family in TKS, paving the way for further research and practical applications in the field.
AUTHORS’ CONTRIBUTIONS
The authors confirm contribution to the paper as follows: Q.Y. and W.M.: Contributed to the study conception and design, and data acquisition; W.M. and X.Z..: Performed the data analysis; Q.Y. and W.M.: The first draft of the manuscript was written by, and all authors commented on previous versions. X.Z.: Critically reviewed and edited the manuscript with supervision. All authors read and approved the final manuscript.
LIST OF ABBREVIATIONS
| TKS | = Taraxacum Kok-Saghyz |
| IMPβ | = ImportinΒ |
| TkIMPβ | = TKS importin β |
| MeJA | = Methyl Jasmonate |
| NR | = Natural Rubber |
| CAS | = Cellular Apoptosis Susceptibility |
AVAILABILITY OF DATA AND MATERIALS
The data supporting the findings of the article is available in the NCBI BioProject database at https://www.ncbi.nlm.nih.gov/bioproject/, reference numbers PRJNA792143 and PRJNA539838.
FUNDING
This study was supported by the Natural Science Foundation of Hainan Province, China (Grant No. 320RC597; Funder ID: https://doi.org/10.13039/501100 004761).
ACKNOWLEDGEMENTS
We particularly thank Dr. Lingling Wang and Dr. Qi Yao from Hainan Normal University, China for their generous support.