All published articles of this journal are available on ScienceDirect.

Effect of Leaf Drying and Collection Site on the Yield and Spectral Fingerprint of Cinnamomum zeylanicum Blume Leaf Essential Oil from Two Ecuadorian Localities
 iD
Edmundo Danilo Guilcapi Pacheco1
iD
Katherine Michelle Torres Gallegos1
iD
Authors Info & Affiliations
Abstract
Introduction/Objective
Essential oils from Cinnamomum zeylanicum Blume show relevant bioactive properties; however, their yield and chemical profile are sensitive to biomass conditioning and collection site. This study evaluated the effect of leaf state (fresh vs. dried) and collection site in Ecuador — Puyo (928 m a.s.l.) and Santo Domingo de los Tsáchilas (705 m a.s.l.) — on the yield and spectral fingerprint of hydrodistilled leaf essential oil.
Methods
A balanced 22 factorial design was applied (n = 3 independent distillations per cell). Essential oil was extracted by Clevenger-type hydrodistillation adapted from ISO 6571, with NaCl salting-out and Na2SO4 dehydration. Yield was expressed both on an as-distilled basis and on a dry-matter basis, so that fresh and dried leaves could be compared on the same mass reference. FTIR (4000–550 cm-1, 4 cm-1 resolution) and UV–Vis spectroscopy (200–400 nm) were used as qualitative fingerprinting tools. Yield data were analyzed by two-way ANOVA with interaction, followed by Tukey's HSD (α = 0.05).
Results
When expressed on an as-distilled basis, drying increased the apparent yield at both sites: Puyo from 1.01 ± 0.03% to 1.57 ± 0.05% and Santo Domingo from 1.20 ± 0.04% to 1.35 ± 0.04%. When yields were recalculated on a dry-matter basis (moisture loss on drying = 61.47%), the direction reversed: fresh leaves gave more oil per unit dry matter (Puyo 2.62 ± 0.08%; Santo Domingo 3.11 ± 0.10%) than dried leaves (1.57% and 1.35%, respectively). This shows that the apparent increase with drying reflects moisture concentration rather than a real gain in recoverable oil. In the as-distilled data, leaf state explained ~73% of the variability, with a significant site × condition interaction (~24%). FTIR and UV–Vis fingerprints differed qualitatively between fresh and dried leaves and between sites, mainly in the oxygenated and conjugated regions.
Discussion
Expressed on a dry-matter basis, oven drying at 60°C was associated with a net reduction in recoverable oil per unit of dry matter, consistent with the loss of volatile constituents during thermal conditioning. The site × condition interaction indicates that this reduction differed between provenances. FTIR and UV–Vis provided complementary fingerprints but do not identify or quantify individual constituents.
Conclusion
Leaf state is the main driver of the measured yield, while collection site modulates its magnitude. Reporting yield on a dry-matter basis is needed to avoid misreading the effect of drying, and both parameters should be stated when comparing extracts.
1. INTRODUCTION
Leaf essential oils are complex mixtures dominated by terpenoids and other secondary metabolites of technological interest for their aromatic and bioactive properties, and compatible with plant biomass valorization approaches [1, 2]. From an ecological perspective, leaf terpenoids fulfill defense and chemical communication functions that contribute to the plant's fitness in its environment [3, 4]. They act as barriers against herbivores through repellency, toxicity, or feeding interference, participate in pathogen inhibition with antifungal and antibacterial activity, and modulate plant–plant and plant–microbiota interactions through volatile emissions that function as signals under biotic or abiotic stress [5]. Their accumulation and emission patterns usually respond to environmental conditions such as radiation, temperature, and water availability [6], so differences associated with the collection site may reflect a combination of environmental and population factors that translate into measurable variation in the yield and profile of volatile extractives [7-9].
Within this group, Cinnamomum zeylanicum Blume (Lauraceae) occupies a particular position, since the species yields two essential oils with distinct chemical characters and commercial standing. The oil distilled from the bark is dominated by cinnamaldehyde and has been characterized across producing regions [10], whereas the oil distilled from the leaf is dominated by eugenol [11] and supports different applications, including antimicrobial and antioxidant uses in food systems [12]. The two oils are not interchangeable, and results obtained for one do not transfer to the other. The leaf fraction also differs in how it is obtained: bark extraction removes tissue that takes years to replace, whereas leaves can be harvested by pruning at intervals compatible with the tree's growth. Leaf biomass is therefore the renewable fraction of the plant, and it is frequently available as a residue of bark and spice production rather than as a dedicated crop, which places it within the scope of biomass valorization [1, 2]. Extraction techniques for cinnamon oils have been reviewed in this context [14, 15] and steam-distillation conditions for the leaf oil have been optimized by response surface methodology [16], yet the leaf remains the less-examined of the two sources.
In practice, the quality of essential oils does not depend only on the species: it varies with plant organ, provenance, phenology and, markedly, with biomass conditioning and the extraction method, which complicates comparison between studies and traceability of the starting material when heterogeneous plant matrices are involved [17, 18]. These sources of variation are recognized as a cross-cutting challenge for the use of essential oils in food, pharmacy, and other fields, and they justify the development of accessible analytical strategies to characterize profiles and detect changes associated with process and origin [13, 19].
Among the process variables, drying prior to hydrodistillation is relevant because it simultaneously modifies the aqueous fraction, the leaf microstructure, and the mass-transfer kinetics of volatile compounds from secretory compartments into the steam [20]. The literature does not always coincide: increases in apparent yield have been reported through water reduction and greater permeability or rupture of secretory structures [10], but also decreases or compositional changes through loss of more volatile compounds or through oxidative and thermochemical transformations during conditioning [20-24]. Even in comparative designs, the distillation method and drying treatment can affect yield and the relative proportions of terpenoids differently, which leads to divergent views on whether drying facilitates release or selectively degrades aromatic fractions [25, 26].
In parallel, collection site co-varies with elevation, temperature, radiation, water availability, soil and plant population, all of which can alter terpenoid biosynthesis and accumulation, as well as leaf anatomy (density of secretory structures, tissue thickness), with final effects on yield and chemotype [12, 27]. In Cinnamomum, associations between yield or composition and environmental variables have been documented, including relationships with elevation for yield and for some major leaf terpenoids, although interpretation is not unequivocal: part of the variation can be attributed to phenotypic plasticity induced by the environment, and part to genetic or chemotypic differences between populations that co-vary with geography [28, 29]. In Andean–Amazonian ecosystems, marked variability has been described for essential oils of Lauraceae collected in Ecuador, which supports the need to report provenance and botanical identity clearly when comparing profiles [30, 31].
Two gaps follow from the preceding. First, the effect of drying on C. zeylanicum leaf biomass has been examined mainly in terms of drying kinetics and colour, with volatile composition reported at fixed conditions rather than compared against the fresh material on an equivalent mass reference [11]; consequently, it remains unsettled whether drying this species increases the oil that can be recovered or merely concentrates it by removing water. Second, the influence of collection site on the leaf oil of this species has been little examined in Andean–Amazonian settings, where the same introduced species is cultivated across contrasting environments within short geographical distances [30, 31]. The practical relevance of both questions is direct. Drying determines whether leaf biomass can be stored and transported before distillation instead of being processed at the point of harvest, and the decision to dry is justified only if the oil recovered per unit of dry matter is not reduced by the treatment. The collection site determines whether biomass from different origins can be pooled and processed under one protocol, or whether provenance must be recorded and treated separately when extracts are standardized.
In this context, the combination of spectroscopic fingerprints (FTIR and UV–Vis) offers an accessible way to contrast treatments without depending on chromatographic techniques, and can support traceability and comparison of terpenoid-rich fractions, a need underlined by reports of essential oils adulterated with cinnamon oil [32]; the value of FTIR as a fingerprinting tool to differentiate oils and capture intraspecific variation has been supported in methodological studies [33-35]. This work therefore evaluates the effects of leaf state (fresh vs. dried) and collection site (Puyo vs. Santo Domingo de los Tsáchilas, Ecuador) on the yield of the leaf essential oil obtained by hydrodistillation, together with its FTIR and UV–Vis fingerprints. We tested the hypothesis that leaf state and collection site modify the measured yield and the spectral fingerprint of the oil, and we report yield both on an as-distilled basis and on a dry-matter basis so that fresh and dried leaves are compared.
2. MATERIALS AND METHODS
2.1. Study Area, Collection Design and Taxonomic Identification
The study was carried out in Ecuador at two contrasting localities to evaluate how collection site and leaf state influence the release of essential oil from the leaves of Cinnamomum zeylanicum Blume. Collection took place in June 2025, and coordinates and elevation were recorded in situ by GPS. The first locality was Santo Domingo de los Tsáchilas (0°21′45″ S, 79°10′30″ W) at 705 m a.s.l.; the second was Puyo, Pastaza (1°30′44″ S, 77°58′43″ W) at 928 m a.s.l. Both localities have warm–humid climates typical of tropical zones but differ in biogeographic context (western piedmont vs. Amazonian foothills), as well as in soil, climate, and plant populations, so the site factor encompasses several co-varying conditions and is treated here as a collection site rather than as an isolated elevation effect.
No collection permit was required for this study. Cinnamomum zeylanicum Blume is not a native element of the Ecuadorian wild flora but an introduced species maintained under cultivation, and both localities correspond to privately owned agricultural land where the sampled trees were deliberately planted. Sampling was limited to leaf material taken from cultivated individuals and did not involve wild populations, natural protected areas, or threatened taxa. Because the material was neither collected from wild native biodiversity nor used for access to genetic resources, the sampling falls outside the scope of the research collection permits established for those cases under Ecuadorian regulations.
Leaf material was collected in the field from cultivated trees on privately owned agricultural land, and at each site leaves were pooled to form a composite sample per site before processing. The sampling was designed to represent the leaf biomass of each locality as it would be obtained under on-farm conditions, that is, as a provenance batch, rather than to characterize individual trees. Consistent with this objective, the number of individual trees contributing to each composite sample, tree age, and phenological stage were not recorded at the time of collection. In farm plantings without establishment records, tree age cannot be reliably documented, and both localities were sampled in the same month (June 2025) to minimize seasonal differences between sites. These variables are therefore not reported, and their absence is considered among the limitations of the study. Taxonomic identification was performed at the Herbarium of the Escuela Superior Politécnica de Chimborazo (CHEP–ESPOCH) by the herbarium curator through evaluation of morphological characters and comparison with specialized descriptions and records in the Tropicos® database, which confirmed the material as Cinnamomum zeylanicum Blume (family Lauraceae; common name cinnamon). The analyzed samples were not incorporated as voucher specimens into the CHEP collection; the identification is therefore supported by a taxonomic identification certificate issued by the herbarium for the submitted plant material. The absence of a deposited voucher and the pooling of leaves per site are among the limitations of the study.
2.2. Pretreatment and Biomass Conditioning (Fresh vs. Dried Leaves)
After collection, leaves were manually selected to reduce variability in the starting material. Intact leaf blades were chosen, without mechanical damage, without visible signs of fungal or insect attack, and free of foreign material (dust, soil, or other plant parts). The batch was then divided into two fractions: fresh and dried.
For the fresh condition, a fraction of selected leaves was processed immediately and taken directly to extraction, without prior drying.
For the dried condition, another fraction was dried by forced convection in an oven (UN110/UN75, Memmert GmbH, Schwabach, Germany) at 60°C until a constant mass was reached. This temperature was selected as a moderate, reproducible drying condition that shortens processing time and standardizes moisture removal, while remaining below the range in which the most severe thermal losses of volatiles are expected [9]. Leaves were arranged in a single layer on inert trays, and mass loss was monitored by repeated weighing every 1 h on an analytical balance (Ohaus Corp.). Constant mass was reached at 8 hours, with a moisture loss of 61.47% (m/m relative to the initial fresh mass), corresponding to a dry-matter fraction of 38.53%. This value was later used to express oil yield on a dry-matter basis. After drying, leaves were cooled to room temperature in a desiccator (DWK Life Sciences, Germany) to limit moisture re-adsorption and stored in amber screw-cap bottles until processing.
2.3. Essential Oil Extraction by Hydrodistillation and Refining
Essential oil was extracted by Clevenger-type hydrodistillation, following the methodological principle of ISO 6571 for volatile oil determination in aromatic matrices, with operational adaptations for leaves [35, 36].
A borosilicate glass assembly with ground-glass joints was used (2 L round-bottom flask, head with graduated Clevenger trap, Liebig condenser and adapters; DWK Life Sciences GmbH, Mainz, Germany). Heating was performed using a 2 L heating mantle with power control (Electrothermal, Staffordshire, United Kingdom), and the condenser was supplied with recirculating cooling water via a thermostatic circulator (Julabo F12-ED, Julabo GmbH, Seelbach, Germany). Extraction was performed in Riobamba (≈2754 m a.s.l.); under the local atmospheric pressure, water boils near 90 °C, and this value was recorded at the still head with a thermometer (Testo 925, Testo SE & Co. KGaA, Lenzkirch, Germany). The 90°C reading therefore corresponds to the boiling temperature of water at the working elevation and not to an imposed set point [37].
For each trial, 50.0 grams of leaves (fresh or dried) and 1000 mL of distilled water (water-to-biomass ratio 20:1, v/w) were loaded, without exceeding two-thirds of the flask capacity. Hydrodistillation was maintained at a steady boil for 5 hours, timed from the first condensate drop. Each site × condition combination was processed as three independent distillations (n = 3), each starting from a separate portion of the pooled leaf material.
The distillate (hydrosol plus oil fraction) was transferred to a 1000 mL separatory funnel with a PTFE stopcock (Pyrex®, Corning Inc., Corning, NY, USA) and left to stand for 2 hours for gravitational separation, after which the oil phase was recovered. To reduce losses through fine emulsion or partial solubilization in the hydrosol, a salting-out step was applied: saturated aqueous NaCl solution (prepared at 20–25°C; NaCl a.r., Merck KGaA, Darmstadt, Germany) was added to the separated hydrosol in an approximate 1:1 volume ratio, homogenized by gentle inversion without foaming, and left to settle until a defined interface formed; the additional oil fraction was collected and combined with the main fraction. The same procedure was applied to every replicate [38].
The combined oil was dehydrated with anhydrous Na2SO4 (analytical grade; Merck KGaA, Darmstadt, Germany) until a transparent phase free of microdroplets was obtained; the desiccant was removed by filtration with Whatman™ No. 1 paper (GE Healthcare Life Sciences, Maidstone, United Kingdom). The oil was stored in hermetically sealed amber screw-cap bottles at 4°C, protected from light, until analysis.
2.4. FTIR and UV–Vis Spectroscopy
FTIR and UV–Vis were used as qualitative fingerprinting techniques to compare treatments at the level of functional groups and chromophores, not to identify or quantify individual constituents.
Infrared spectra were recorded on an FT/IR-4100 Type A (JASCO Corporation, Tokyo, Japan) with a deuterated L-alanine-doped triglycine sulfate DLATGS detector under thermoelectric (Peltier) regulation, over 4000–550 cm-1, acquiring 32 scans per spectrum at 4 cm-1 resolution. A background was acquired between measurements, and the sampling system was cleaned between replicates to avoid carry-over. Because the broad O–H region can include contributions from residual moisture, ethanol traces, or hydrosol carry-over, bands in this region are reported as fingerprint features and are not assigned exclusively to terpene alcohols or phenols. Spectra were exported and processed in Origin/OriginPro (OriginLab Corporation, Northampton, MA, USA), with individual baseline correction for each replicate before band comparison.
UV–Vis spectra were obtained on a UV-Visible C-7200 spectrophotometer (PEAK Instruments) in absorbance mode, scanning 200.0–400.0 nm at 1 nm intervals and a slow scan rate. For sample preparation, one drop of essential oil was dissolved in absolute ethanol until an optically clear solution was obtained, and readings were taken in 10 mm quartz cuvettes against an absolute-ethanol blank. Because the dilution was not adjusted to a fixed oil concentration and absorbance values above roughly 2 fall outside the reliable quantitative range of the instrument, UV–Vis results are interpreted qualitatively (spectral shape and absorption-edge position) rather than as quantitative absorbance values. The individual wavelength scans recorded for each extract are provided as Supplementary Material (Figs. S1–S4)
2.5. Statistical Analysis
The design was a balanced 22 factorial with two fixed factors: collection site (Puyo vs. Santo Domingo de los Tsáchilas) and leaf state (fresh vs. dried). Each combination was evaluated as three independent distillations (n = 3). The adequacy of three distillations per cell was examined by a sensitivity power analysis for the 2 × 2 design (N = 12; numerator df = 1; error df = 8; α = 0.05) based on the noncentral F distribution. With this replication, the design detects effects with Cohen’s f ≥ 0.92 (ηp2 ≥ 0.46) with 80% power. Using the pooled residual standard deviation of the yield data (0.041 percentage points on the as-distilled basis and 0.072 on the dry-matter basis), the minimum difference between two treatment means detectable with 80% power in a two-sided pairwise contrast was 0.11 and 0.19 percentage points, respectively. The effects of interest exceeded these thresholds (leaf state, ηp2 = 0.966 and 0.993; site × condition, ηp2 = 0.905 and 0.901; Tables 2 and 4), and the coefficient of variation among replicate distillations ranged from 3.0% to 3.3%. Conversely, the site main effect on the as-distilled basis (ηp2 = 0.049) lies well below the detectable threshold, so its non-significance is interpreted as absence of evidence rather than evidence of no effect. Because these replicates came from a composite leaf sample per site, they represent extraction-level replication rather than independent biological sampling of trees; this limits generalization at the site level and is noted as a limitation.
| Collection Site | Leaf State | Yield, as-distilled Basis (%) | Tukey Group | Yield on Dry-matter Basis (%) | Tukey Group (Dry-matter Basis) |
|---|---|---|---|---|---|
| Puyo | Fresh | 1.01 ± 0.03 | d | 2.62 ± 0.08 | b |
| Puyo | Dried | 1.57 ± 0.05 | a | 1.57 ± 0.05 | c |
| Santo Domingo | Fresh | 1.20 ± 0.04 | c | 3.11 ± 0.10 | a |
| Santo Domingo | Dried | 1.35 ± 0.04 | b | 1.35 ± 0.04 | d |
| Source | SS | df | MS | F | p | ηp2 | %Var (SS/SST) |
|---|---|---|---|---|---|---|---|
| Site | 0.0007 | 1 | 0.0007 | 0.409 | 0.54 | 0.049 | 0.13 |
| Condition | 0.3781 | 1 | 0.3781 | 229.136 | 3.59×10⁻⁷ | 0.966 | 72.98 |
| Site × Condition | 0.1261 | 1 | 0.1261 | 76.409 | 2.30×10⁻⁵ | 0.905 | 24.34 |
| Error | 0.0132 | 8 | 0.0017 | 2.55 |
| Comparison | Δ Means (Percentage Points) | 95% CI | p-adjusted |
|---|---|---|---|
| Puyo-Dried vs. Puyo-Fresh | 0.56 | 0.452 to 0.668 | <0.001 |
| Santo Domingo-Dried vs. Santo Domingo-Fresh | 0.15 | 0.042 to 0.258 | 0.008 |
| Santo Domingo-Fresh vs. Puyo-Fresh | 0.19 | 0.082 to 0.298 | 0.002 |
| Santo Domingo-Dried vs. Puyo-Fresh | 0.34 | 0.232 to 0.448 | <0.001 |
| Puyo-Dried vs. Santo Domingo-Fresh | 0.37 | 0.262 to 0.478 | <0.001 |
| Puyo-Dried vs. Santo Domingo-Dried | 0.22 | 0.112 to 0.328 | 0.001 |
| Source | SS | df | MS | F 6.0 x 10⁻¹⁰ | p | ηp2 | %Var (SS/SST) |
|---|---|---|---|---|---|---|---|
| Site | 0.056 | 1 | 0.056 | 10.69 | 0.011 | 0.572 | 0.87 |
| Condition | 5.9466 | 1 | 5.9466 | 1135.63 | 6.0x10⁻¹⁰ | 0.993 | 92.54 |
| Site $\times$ Condition | 0.3815 | 1 | 0.3815 | 72.86 | 2.78×10⁻⁵ | 0.901 | 5.94 |
| Error | 0.0419 | 8 | 0.0052 | 0.65 |
The same two-way model was fitted to yields expressed on a dry-matter basis, so that the comparison between fresh and dried leaves rests on a test rather than on the arithmetic transformation alone. Dry-matter values were obtained by dividing the measured yield of fresh leaves by the dry-matter fraction (0.3853), the values for dried leaves being already referred to dry matter; the moisture fraction was treated as a fixed constant, and its own measurement uncertainty is not propagated into the analysis.
For oil yield, a two-way ANOVA with interaction term (site × condition) was fitted. Normality of residuals was assessed using the Shapiro–Wilk test, and homogeneity of variances was assessed using the Levene test. When effects were significant (α = 0.05), pairwise comparisons used Tukey's HSD to control the familywise error. Yields on a dry-matter basis were obtained from the measured yields using the dry-matter fraction (38.53%); for dried leaves, the as-distilled and dry-matter values coincide, whereas for fresh leaves, the measured yield was divided by the dry-matter fraction. FTIR and UV–Vis descriptors were treated as qualitative fingerprints and were not subjected to compound-level quantification. Spectral processing was performed in Origin/OriginPro (OriginLab Corporation, Northampton, MA, USA) and inferential analysis in RStudio (R Foundation for Statistical Computing, Vienna, Austria)
3. RESULTS
3.1. Essential Oil Yield from Leaves of C. zeylanicum (Fresh vs. Dried)
Yield was expressed both on an as-distilled basis, that is, as a percentage of the leaf mass loaded into the still (fresh weight for fresh leaves and oven-dry weight for dried leaves), and on a dry-matter basis. Trials were run in triplicate and reported as mean ± SD (Table 1).
Expressed on an as-distilled basis, drying increased the apparent yield at both sites (Puyo +0.56 percentage points; Santo Domingo +0.15 percentage points). However, because drying removed 61.47% of the leaf mass as water, part of this increase is a concentration effect: the same oil is referred to a smaller residual mass. When yields are expressed on a dry-matter basis, the direction reverses. Fresh leaves gave more oil per unit dry matter than dried leaves at both sites (Puyo 2.62% vs. 1.57%; Santo Domingo 3.11% vs. 1.35%), which indicates that oven drying at 60°C did not increase the recoverable oil and was instead associated with a net loss per unit dry matter, compatible with volatilization of part of the oil during thermal conditioning. The magnitude of this loss varied across sites, indicating a site × condition interaction, which is analyzed in the following section.
3.2. Statistical Analysis of the Results
A two-way ANOVA with interaction (site × condition) was fitted to the as-distilled yields, in a balanced design with independent triplicates per cell. The assumptions of normality of residuals and homogeneity of variances were satisfied for parametric inference (α = 0.05), as shown in Table 2
In the as-distilled data, leaf state accounts for most of the variation (~73%; p = 3.59×10⁻⁷), followed by a site × condition interaction (~24%; p = 2.30×10⁻⁵), while site alone is not significant (p = 0.540). This ANOVA describes the measured (as-distilled) yields; as shown in Section 3.1, the dominant condition effect is largely explained by moisture concentration, so the significance of leaf state here should be read together with the dry-matter recalculation rather than as evidence that drying increases recoverable oil. The significant interaction indicates that the effect of drying on the measured yield was not the same at both sites.
3.2.1. Multiple Comparisons (Tukey HSD)
Because the interaction was significant, comparisons focus on the four site × condition combinations and on the simple effect of drying within each site (Table 3).
On the as-distilled basis, the fresh-to-dried change was +0.56 percentage points in Puyo (p < 0.001) and +0.15 in Santo Domingo (p = 0.008); the difference between these two changes (the interaction) was 0.41 percentage points, meaning the apparent gain with drying was larger in Puyo than in Santo Domingo. As noted in Section 3.1, these positive changes on the as-distilled basis are driven by moisture removal; on a dry-matter basis the fresh leaves rank highest at both sites, so the interaction is better described as a site-dependent difference in the loss of oil during drying rather than a site-dependent gain [6].
3.2.2. Analysis on a Dry-matter Basis
The two-way model was refitted to the yields expressed per unit dry matter, so that the difference between fresh and dried leaves is evaluated by test rather than by inspection of the transformed values (Table 4).
On a dry-matter basis, leaf state accounts for 92.5% of the variation (F = 1135.63; p = 6.0×10⁻¹⁰), with fresh leaves above dried leaves at both localities. The reduction associated with drying is therefore supported by the test and not only by the transformation of the values. The interaction remains significant (F = 72.86; p = 2.78×10⁻⁵) and accounts for 5.9% of the variation, while the site effect, not significant on the as-distilled basis, reaches significance here (F = 10.69; p = 0.011).
Pairwise comparisons separate the four treatments into four distinct groups (Table 5).
| Comparison | Δ Means (Percentage Points) | 95% CI | p-adjusted |
|---|---|---|---|
| Santo Domingo-Fresh vs. Santo Domingo-Dried | 1.76 | 1.575 to 1.954 | <0.001 |
| Puyo-Fresh vs. Puyo-Dried | 1.05 | 0.862 to 1.241 | <0.001 |
| Santo Domingo-Fresh vs. Puyo-Dried | 1.54 | 1.355 to 1.734 | <0.001 |
| Puyo-Fresh vs. Santo Domingo-Dried | 1.27 | 1.082 to 1.461 | <0.001 |
| Santo Domingo-Fresh vs. Puyo-Fresh | 0.49 | 0.304 to 0.682 | <0.001 |
| Puyo-Dried vs. Santo Domingo-Dried | 0.22 | 0.031 to 0.409 | 0.024 |
The reduction associated with drying was 1.76 percentage points at Santo Domingo and 1.05 at Puyo, both significant, and the difference between these two reductions corresponds to the interaction term. Since the dry-matter values for fresh leaves are derived from measured yields using a fixed moisture fraction, this analysis re-expresses the same measurements rather than providing independent replication, and the two ANOVAs should be read as complementary views of a single dataset. Its outcome is nevertheless not determined by the transformation reversing the direction of the effect at Puyo would require the moisture loss to have been 35.7% rather than the 61.47% measured, and at Santo Domingo 11.1%, differences far beyond the precision of the gravimetric determination.
3.3. UV–Vis Analysis of the Extracts
The comparative UV–Vis spectra (Fig. 1) show a dominant absorption in the UV region (200–320 nm) and a variable tail toward the UVA region (320–400 nm), with differences attributable to both collection site (Puyo vs. Santo Domingo) and leaf state (fresh vs. dried). Scans were recorded from 200 to 400 nm at 1 nm intervals and at a slow rate, allowing evaluation of spectral shape and absorption-edge shifts [39]. Because the dilution was not fixed to a known concentration, the absorbance values below are used only to describe spectral shape and are not treated as quantitative measurements.
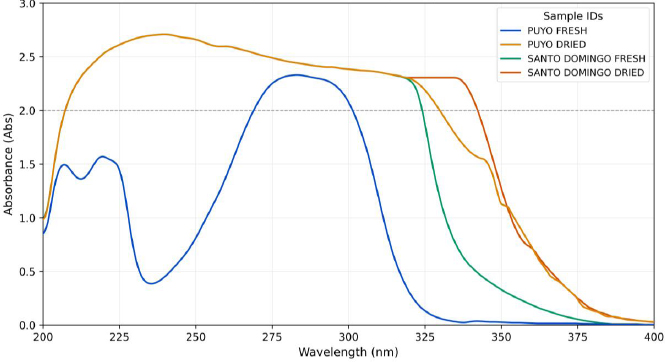
UV–Vis absorption spectra (200–400 nm) of the four Cinnamomum zeylanicum leaf essential oils.
Traces correspond to Puyo–Fresh, Puyo–Dried, Santo Domingo–Fresh and Santo Domingo–Dried. The dashed horizontal line at 2.0 absorbance units marks the upper limit of the reliable quantitative range of the instrument; readings above this line describe spectral shape only.
In matrices rich in phenylpropanoids, and in the extracts studied here, an intense band near 200–240 nm can be associated with π→π* transitions of aromatic rings and conjugated C=C systems, and signals near 270–310 nm with substituted aromatic chromophores and conjugated carbonyls. Absorbance near 280 nm is often used as a general indicator of phenolic/aromatic content. In cinnamon matrices, absorption near 280 nm has been related to eugenol and near 290 nm to trans-cinnamaldehyde; these associations are tentative here, because UV–Vis cannot confirm individual compounds in a complex oil without chromatographic support [40].
The fresh Puyo extract shows a valley near 235 nm and a broad band with a maximum near 284 nm, with absorbance falling below 0.1 above ~327 nm, that is, a short UVA tail (Fig. S1). This is consistent with an aromatic fraction (band near 280 nm) and a lower relative contribution of highly conjugated species, which would extend absorption toward 330–380 nm [14]. The dried Puyo extract shows a more continuous profile from ~200 to ~320 nm and a more evident UVA tail (edge near ~366 nm, Fig. S2), so the relative contribution of chromophores absorbing at longer wavelengths increases compared with the fresh Puyo sample [41].
The fresh Santo Domingo extract shows a maximum near 238 nm and a moderate UVA tail (edge near ~369 nm, Fig. S3), retaining a relatively marked tail even without drying. A greater relative contribution of chromophores absorbing at longer wavelengths would account for this tail, but the observation itself is limited to the position of the absorption edge [42]. The dried Santo Domingo extract shows a maximum near 240 nm and still high values at long wavelengths (edge near ~387 nm, Fig. S4); this shift of the edge and the larger tail point to a greater relative contribution of π-conjugated systems, tentatively linked to conjugated phenylpropanoids and/or oxidation products formed during drying, without confirmation of specific molecules [27].
UV–Vis therefore establishes that drying and collection site modify the optical fingerprint of the extracts, and that the modification is concentrated in the region of extended UVA absorption. The observation is restricted to spectral shape and to the position of the absorption edge. Changes in the relative proportion of conjugated constituents, or transformations occurring during conditioning, would be consistent with the spectra, but neither is demonstrated by them [9].
3.4. FTIR Analysis of the Obtained Extract
The FTIR spectrum of the fresh Puyo extract (4000–550 cm-1) shows a profile in Fig. (2), typical of a complex mixture of volatile and semi-volatile metabolites, with signals compatible with oxygenated groups (O–H, C=O, C–O) and unsaturated/aromatic structures (C=C; =C–H deformations). The broad band near 3343.96 cm-1 (%T ≈ 54.99) corresponds to O–H stretching; because this region can include residual moisture, it is read as a fingerprint feature rather than assigned only to alcohols/phenols. The band at 1735.62 cm-1 (%T ≈ 86.61) is compatible with C=O of ester-type carbonyls, lactones, or aldehydes, common in extracts with oxygenated terpenes [35].
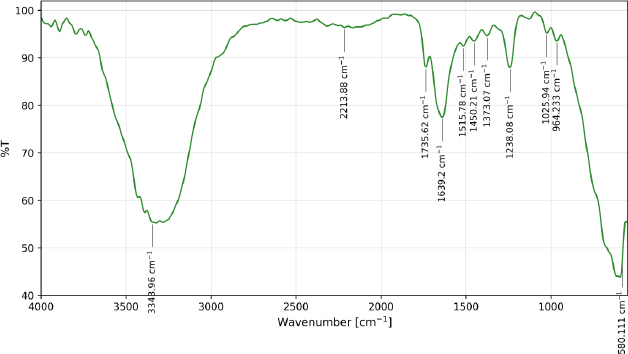
FTIR spectrum of the essential oil obtained from fresh leaves collected at Puyo.
The band at 1639.20 cm-1 (%T ≈ 77.09) is assignable to C=C of conjugated alkenes and/or aromatic C=C; and 1515.78 cm-1 (%T ≈ 92.27) to aromatic C=C skeletal vibrations. The presence of an aromatic ring is supported by this band; whether it belongs to a phenylpropanoid or to another aromatic constituent is not determined by the spectrum. The bands at 1450.21 cm-1 (%T ≈ 93.26) and 1373.07 cm-1 (%T ≈ 94.65) correspond to δ(CH2) and δₛ(CH3) deformations. The region at 1238.08 cm-1 (%T ≈ 87.80) and 1025.94 cm-1 (%T ≈ 94.89) is dominated by C–O (alcohols, ethers, esters) and possibly C–O–C contributions [19]. The band at 964.233 cm-1 (%T ≈ 92.97) corresponds to out-of-plane =C–H deformation of alkenes, and 590.111 cm-1 (%T ≈ 43.21) to skeletal vibrations that mainly provide fingerprint features. The weak signal at 2213.88 cm-1 (%T ≈ 96.28) is non-diagnostic [10]. The overall fingerprint is consistent with a plant extract containing oxygenated and unsaturated secondary metabolites [34].
The dried Puyo extract exhibits a pattern typical of a complex mixture, with oxygenated and unsaturated/ aromatic contributions, as shown in Fig. (3). The broad band at 3316.96 cm-1 (%T ≈ 58.11) corresponds to O–H stretching (read as a fingerprint feature). A carbonyl signal at 1735.62 cm-1 (%T ≈ 83.36) is compatible with C=O (esters/lactones and/or aldehydes), with C=C contributions at 1639.20 cm-1 (%T ≈ 78.54) and a band at 1511.92 cm-1 (%T ≈ 92.28) associated with aromatic or conjugated C=C [13]. The signal at 2163.74 cm-1 (%T ≈ 96.32) is non-diagnostic. In the fingerprint region, 1450.21 and 1376.93 cm-1 (%T ≈ 92.78–93.76) correspond to δ(CH2)/δ(CH3); the bands at 1238.08, 1122.37 and 1025.94 cm-1 (%T ≈ 83.20–96.58) to C–O and/or C–O–C vibrations; and 968.09 cm-1 (%T ≈ 91.50) to γ(=C–H) of alkenes. Low-frequency bands at 686.534 and 582.397 cm-1 add fingerprint features. The spectrum shows the simultaneous presence of O–H, C=O, and C–O together with unsaturation/aromaticity signals [42].
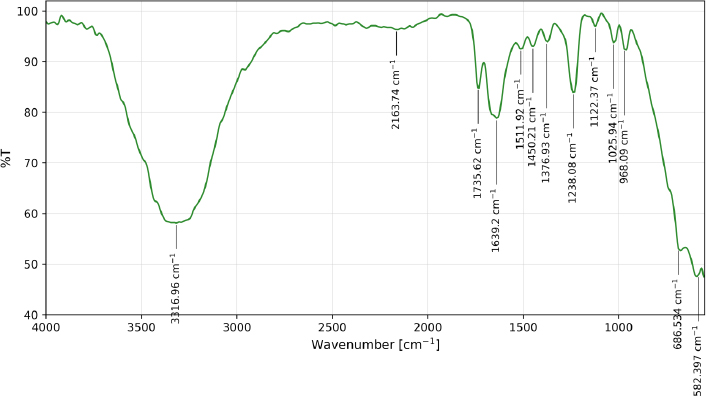
FTIR spectrum of the essential oil obtained from oven-dried leaves collected at Puyo.
The fresh Santo Domingo extract shows a fingerprint with oxygenated functionalities and signals from unsaturated bonds in Fig. (4). The broad band at 3347.82 cm-1 (%T ≈ 54.13) corresponds to O–H stretching (with a possible contribution of residual moisture from fresh material, so it is read as a fingerprint feature). At 1635.34 cm-1 (%T ≈ 74.88), a signal is compatible mainly with C=C of unsaturated systems and/or aromatic contributions. The signal at 2163.74 cm-1 (%T ≈ 94.66) is non-diagnostic [6]. Bands at 1241.93 cm-1 (%T ≈ 94.28) and 1126.22 cm-1 (%T ≈ 98.18) are consistent with C–O / C–O–C vibrations; low-frequency signals at 609.396 and 570.826 cm-1 (%T ≈ 41.06 and 34.21) correspond to skeletal modes contributing to the fingerprint. The spectrum combines O–H (~3348 cm-1), a contribution near 1635 cm-1 related to unsaturation/aromaticity, and a C–O region (1242–1126 cm-1).
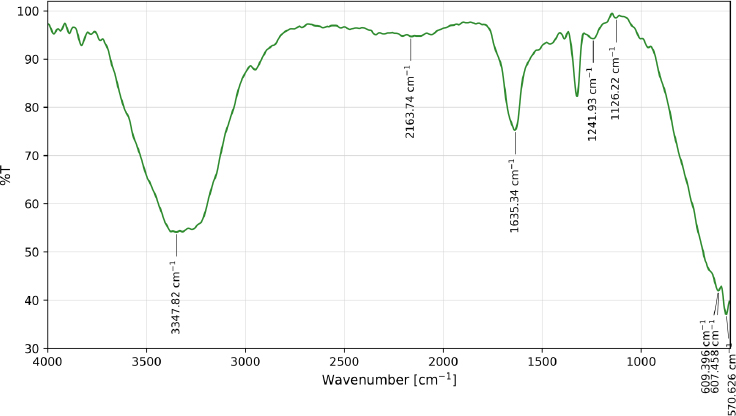
FTIR spectrum of the essential oil obtained from fresh leaves collected at Santo Domingo de los Tsáchilas.
The dried Santo Domingo extract shows a signature with contributions from hydroxylated and aliphatic groups, and a relatively simple fingerprint region in Fig. (5). Two bands at 3386.39 and 3313.11 cm-1 (%T ≈ 90.42–91.51) correspond to O–H stretching in different hydrogen-bonding environments (read as fingerprint features). The aliphatic contribution appears at 2946.7 and 2865.7 cm-1 (%T ≈ 95.80–96.64), assignable to C–H stretching of CH2/CH3. The signal at 2348.87 cm-1 (%T ≈ 97.13) reflects CO2/environmental contributions and is non-diagnostic [38]. In the mid and fingerprint region, 1631.48 cm-1 (%T ≈ 94.97) can be associated with C=C/conjugated contributions, and 1095.37 cm-1 (%T ≈ 95.62) with C–O vibrations. Bands at 717.39, 644.108 and 601.682 cm-1 (%T ≈ 94.45–91.74) correspond to out-of-plane modes and skeletal vibrations. The spectrum combines O–H (3386–3313 cm-1), aliphatic C–H (2947–2866 cm-1), and a C–O contribution (~1095 cm-1) [15].
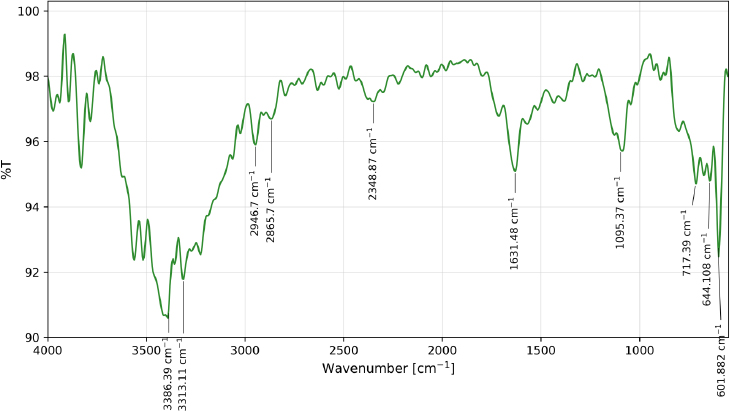
FTIR spectrum of the essential oil obtained from oven-dried leaves collected at Santo Domingo de los Tsáchilas.
It should be considered that a distinction is maintained between two levels of interpretation. Assignments at the level of functional groups and chromophores (O–H, C=O, C–O, C=C) stretching regions in the infrared, and (π→π*) absorption ranges in the ultraviolet are supported directly by the spectra and are reported as observations. Any statement relating these features to a class of constituents, such as oxygenated terpenes, phenylpropanoids or oxidation products, exceeds the discriminating capacity of the two techniques, since a given functional group may arise from several unrelated compound classes within a complex mixture. Such statements are therefore presented as possible explanations consistent with the spectra, not as evidence of composition, and are identified as such wherever they appear.
4. DISCUSSION
Drying at 60°C reduced oil recovery from 2.62% to 1.57% at Puyo and from 3.11% to 1.35% at Santo Domingo. Three processes plausibly contribute to this loss, and they are not mutually exclusive. The first is the location of the oil within the leaf. In Cinnamomum and other Lauraceae, leaf essential oil is not held in surface glandular trichomes but in internal oil cells, secretory idioblasts distributed throughout the mesophyll and bounded by a multi-layered, partly suberized wall [43]. This wall functions as a diffusion barrier at ambient temperature. During convective drying, the mesophyll loses turgor, and the tissue contracts, and the mechanical stress associated with shrinkage can compromise the integrity of these compartments. Once the barrier is breached, the oil is no longer isolated from the leaf surface and becomes available for transfer to the drying air.
The second is co-transport with water vapour. Drying does not remove water in a closed system: the airstream continuously renews the boundary layer at the leaf surface, so any volatile that reaches that surface is entrained and carried away rather than reaching equilibrium with the tissue. This is the same physical principle exploited in hydrodistillation, operating here at lower temperature and over a longer period. The consequence is that the loss is selective rather than proportional: constituents with lower boiling points and higher vapour pressures at 60°C are removed preferentially, while heavier phenylpropanoids are retained to a greater extent.
The third is the duration of thermal exposure. Under the conditions applied, constant mass was reached at 8 hours. Reported drying kinetics for C. zeylanicum leaves indicate substantially shorter times to moisture equilibrium at comparable temperatures under forced air circulation, with the dependence of effective diffusivity on temperature described by an Arrhenius relation and an activation energy of 64.77 kJ mol-1 [11]. The difference is attributable to sample load, layer thickness, and air velocity, which were not matched between studies, but it indicates that, in the protocol applied, the leaves remained at 60°C for a period that extended beyond the removal of most of the free water. Volatile loss continues during that period, while water removal has largely ceased, so the later stage of drying contributes to oil loss without advancing the stated objective of the treatment. Thermal degradation of terpenoids, through oxidation, isomerization, and polymerization, may occur in parallel, although the present data do not allow it to be distinguished from physical volatilization.
Taken together, these processes indicate that the reduction observed is a predictable consequence of the conditioning applied rather than an anomaly of the material, and that drying time deserves as much attention as drying temperature when leaf biomass is conditioned before distillation.
The literature on drying and essential oil yield appears contradictory, and present results suggest that part of that contradiction is a matter of how yield is expressed rather than a disagreement about what happens in the leaf. Studies that report yield on a dry-weight basis converge with the observation reported here. In two basil landraces dried by six procedures, increasing the drying temperature decreased essential oil content, with oven drying at 60°C producing lower values than oven drying at 40°C and than the fresh material, together with the loss of most monoterpene hydrocarbons relative to the fresh sample [44]. In Thymus daenensis, oven drying at 70°C gave a markedly lower yield than oven drying at 50°C [45]. In C. camphora, a species of the same genus as the material studied here, conservation procedure altered the amounts of specific constituents in the leaf oil [43]. The pattern in these reports is consistent when the reference mass excludes water: higher-temperature convective drying is associated with lower volatile recovery, and the loss falls disproportionately on the lighter fraction.
Reports of increased yield after drying frequently express the result relative to the mass of leaves loaded into the still. The present data reproduce both outcomes from the same measurements. Referred to the mass loaded into the still, drying raised the yield at both sites, by 0.56 percentage points at Puyo and 0.15 at Santo Domingo; referred to dry matter, the same measurements show a loss at both sites. Since drying removed 61.47% of the leaf mass as water, the as-distilled figure compares a hydrated matrix against a dehydrated one and cannot separate a change in oil content from a change in the reference mass. The discrepancy in the literature is therefore at least partly an artefact of reporting convention, and the comparison of yields across studies requires that the mass basis be stated. The dry-matter value describes what happens to the oil, and the as-distilled value describes what a processor loads into a still.
The interaction term of the dry-matter model (F = 72.86; p = 2.78×10⁻⁵) indicates that the two provenances did not respond identically to the same treatment. The reduction associated with drying was 1.76 percentage points at Santo Domingo and 1.05 at Puyo (Table 5), equivalent to 56.6% and 40.1% of the oil present in the fresh material. The site with the higher initial oil content therefore lost the larger proportion, not merely the larger absolute quantity.
Several mechanisms are compatible with this pattern. A higher initial oil load implies a steeper concentration gradient between the interior of the leaf and the drying air, and diffusive transport responds to that gradient, so a leaf richer in oil is expected to lose oil faster under identical conditions. Leaf anatomy provides a second route. In Cinnamomum, the oil is held in idioblasts bounded by a multi-layered wall [43], and differences in their density and size, together with leaf thickness and cuticle properties, determine the path length between the secretory compartment and the leaf surface. Provenances with a shorter or less obstructed path would therefore lose a greater proportion of their oil under the same thermal treatment. A third possibility is compositional: a provenance whose oil contains a greater share of lower-boiling constituents loses more at 60°C than one dominated by heavier phenylpropanoids.
The two provenances differed; environmental conditions at the collection site are known to modulate terpenoid accumulation, and associations between elevation and secondary metabolite content have been documented in aromatic species [6]. Population-level variation is a contributor in cinnamon; morphological and chemical traits correlate across accessions from a single producing region, indicating that genotype accounts for part of the variation observed between provenances [10]. The two localities differ in elevation, climate, soil, and plant population, and leaves were pooled per site, so the site effect reported here reflects the two batches sampled and does not identify which environmental or genetic factor produced the difference. Resolving that would require multiple independently sampled sites along a gradient, with trees characterized individually. For practical purposes, the operational implication holds regardless of the underlying cause: the loss associated with drying was not constant across provenances, so a drying protocol validated on biomass from one origin should not be assumed to perform equivalently on biomass from another.
The joint UV–Vis/FTIR reading is consistent with qualitative differences between treatments. In UV–Vis, all extracts show strong absorption over 200–320 nm and a UVA tail that increases with drying and varies by site; the region near 280 nm is often attributed to phenols/aromatics, and near 290 nm to conjugated systems, associations that remain tentative without chromatographic confirmation. In FTIR, functional-group signals of the oxygenated/terpene matrix dominate: broad O–H (~3344–3313 cm-1), aliphatic C–H (noticeable in Santo Domingo–dried, 2946/2866 cm-1), a C–O region (1238–1026 cm-1) and unsaturation/aromaticity markers (1639 and 1516 cm-1). The two techniques are complementary: UV–Vis is more sensitive to highly conjugated minor chromophores, whereas FTIR weights the more abundant fraction. Both are used here as fingerprints, and neither supports assignment or quantification of individual compounds.
The refining protocol (gravitational separation followed by NaCl salting out and Na2SO4 dehydration) was intended to reduce oil losses in the hydrosol without using organic solvents. Given this, and consistent with the caution above, the O–H band in FTIR is not read as evidence of a single compound class; it can include terpene alcohols and phenols as well as residual moisture, so it is reported as a fingerprint feature. Signals near 2348 and 2163 cm-1 are treated as non-diagnostic, which limits over-interpretation of the fingerprints.
A limitation of this work is that FTIR and UV–Vis are ensemble techniques; they describe functional groups and chromophores across the whole mixture and do not resolve individual terpenoids. The spectral fingerprints show that leaf state and collection site modify the relative contribution of oxygenated functional groups and conjugated systems, which was the aim (to detect and compare treatment differences), but they do not allow identification or quantification of specific molecules such as eugenol, linalool,s or cinnamaldehyde. Compound-level identification would require Gas Chromatography coupled to Mass Spectrometry (GC–MS) or authenticated standards, which were not available for this study; this is stated as a limitation of the present results rather than as evidence reported. Further limitations include the use of two collection sites, the pooling of leaves per site with extraction-level (not biological) replication, the absence of records on the number of trees sampled, tree age and phenological stage, and the absence of a deposited voucher specimen, all of which restrict generalization at the site level [46, 47]. Because leaf essential oil content can vary with leaf age and phenological stage, part of the difference between sites may reflect the physiological state of the trees at collection rather than provenance alone. Future work should sample individually identified trees at each site, recording their phenological stage, so that within-site biological variability can be estimated and separated from site effects.
CONCLUSIONS
On the as-distilled basis, leaf state was the factor that most affected the measured essential oil yield of C. zeylanicum leaves, followed by a site × condition interaction, while collection site alone was not determinant. When yields were expressed on a dry-matter basis, the apparent increase with drying disappeared and reversed: fresh leaves gave more oil per unit dry matter at both sites. Oven drying at 60°C therefore did not increase the recoverable oil and was associated with a net loss per unit dry matter, so reporting yield on a dry-matter basis is needed to interpret the effect of drying correctly.
The FTIR and UV–Vis fingerprints differed between fresh and dried leaves and between sites, mainly in the oxygenated and conjugated regions. These differences are reported as qualitative fingerprint changes and do not, on their own, identify or quantify individual constituents. Within these limits, the highest oil per unit dry matter was obtained from fresh leaves at Santo Domingo, and leaf state combined with collection site should both be reported when comparing extracts of this species.
AUTHORS’ CONTRIBUTIONS
The authors confirm their contribution to the paper as follows: D.R.M.V.: Study Conception and Design; E.D.G.P.: Data Collection; D.R.M.V., E.D.G.P., K.M.T.G.: Analysis and Interpretation of Results; D.R. M.V., K.M. T.G., E.D.G.P.: Draft Manuscript; D.R.M.V., E.D. All authors reviewed the results and approved the final version of the manuscript.
LIST OF ABBREVIATIONS
| ANOVA | = Analysis of Variance |
| CHEP | = Herbarium of the Escuela Superior Politécnica de Chimborazo |
| CI | = Confidence Interval |
| df | = Degrees of Freedom |
| DLATGS | = Deuterated L-Alanine-Doped Triglycine Sulfate |
| ESPOCH | = Escuela Superior Politécnica de Chimborazo |
| FTIR | = Fourier-Transform Infrared Spectroscopy |
| GC–MS | = Gas Chromatography–Mass Spectrometry |
| GPS | = Global Positioning System |
| HSD | = Honestly Significant Difference |
| ISO | = International Organization for Standardization |
| MS | = Mean Square |
| PTFE | = Polytetrafluoroethylene |
| SD | = Standard Deviation |
| SS | = Sum of Squares |
| SST | = Total Sum of Squares |
| %T | = Percent Transmittance |
| UV–Vis | = Ultraviolet–Visible Spectroscopy |
| UVA | = Ultraviolet A Region (320–400 nm) |
| %Var | = Percentage of Total Variance Explained |
| ηp2 | = Partial Eta Squared |
AVAILABILITY OF DATA AND MATERIALS
The original contributions presented in the study are included in the article; further inquiries can be directed to the corresponding author.
ACKNOWLEDGMENTS
Declared none.