All published articles of this journal are available on ScienceDirect.

Gaussian Process Modelling for Precision Olive Irrigation-Fertilization Management: Continuous Prediction and Uncertainty Quantification of Olive Oil Quality

Abstract
Introduction
Olive oil quality is influenced by irrigation, fertilization, and seasonal climate variability. This study aimed to predict quality at unobserved water-fertilizer combinations while quantifying predictive uncertainty for risk-informed management.
Methods
A two-year (2023-2024) split-plot 3×3 factorial trial at INRA Meknès, Morocco, generated 54 biological olive-oil samples of Olea europaea L. cv. Picholine Marocaine across nine water-fertilizer combinations (50-100% ETc × 50-100% NPK), yielding 324 FTIR-ATR acquisitions. Matérn-5/2 Gaussian Process models with Automatic Relevance Determination were trained on 18 treatment-year means. Performance was assessed using Spearman ρ2 under leave-one-treatment-out and leave-one-year-out cross-validation. Uncertainty was partitioned into aleatoric, temporal, and epistemic components, and Pareto optimisation identified resource-efficient regimes.
Results
LOTO-CV ρ2 ranged from 0.408 (TFC) to 0.750 (carotenoids), with DPPH at 0.633 and TPC at 0.427. LOYO ρ2 reached 0.790 for carotenoids and 0.494 for TPC. Temporal uncertainty accounted for ~58% of total uncertainty, versus 36% aleatoric and 6% epistemic. TPC was more sensitive to irrigation than fertilization ( W/F = 0.22). The Pareto-optimal regime (≈50% ETc × ≈56% NPK) achieved 91% of maximum composite quality with 28% lower fertilisation cost.
Discussion
Seasonal variability was the dominant uncertainty source, highlighting the importance of multi-year data. Carotenoid and TPC patterns transferred across seasons, whereas DPPH required seasonal recalibration.
Conclusion
FTIR-GP modelling with Pareto optimisation offers a promising framework for uncertainty-aware olive management, but broader validation across seasons, sites, and cultivars is needed.
1. INTRODUCTION
Olive oil is one of the most economically significant and nutritionally complex agricultural commodities of the Mediterranean region, with phenolic compounds, carotenoids, flavonoids, and antioxidant capacity constituting the primary quality determinants recognised by regulatory bodies and consumers alike [1-3]. These biochemical quality indices are not fixed varietal traits but dynamic phenotypic outputs shaped by the interaction of irrigation management, mineral nutrition, and seasonal climate variability. Understanding and predicting this interaction across the continuous space of possible agronomic inputs is, therefore, both a scientific question and a direct operational requirement for precision olive farming.
Spectroscopic approaches, and FTIR-ATR spectroscopy in particular, have emerged as the dominant analytical platform for olive oil quality characterisation, offering rapid, non-destructive, reagent-free measurement across the full biochemical fingerprint [4, 5]. The chemometric literature has demonstrated robust classification of oil samples by variety, geographic origin, and adulteration status [6, 7], confirming that the spectral signal encodes meaningful biochemical information [8, 9]. However, the prevailing modelling paradigm, training classifiers or regressors on samples from a fixed set of pre-defined discrete treatment categories, creates a fundamental mismatch with operational farm decision-making. A grower facing a specific resource constraint requires a prediction system that operates across the continuous two-dimensional input space of water and fertiliser availability, not one confined to a handful of observed treatment means. Moreover, discrete spectroscopic models cannot quantify the uncertainty associated with predictions at unobserved input combinations, information essential for risk-informed agronomic decisions [10].
Gaussian Process (GP) regression provides a principled solution to both limitations [11]. Unlike deterministic supervised learning approaches, a GP defines a probability distribution over functions, yielding for every query point in the continuous input space a full posterior distribution characterised by a predictive mean and a calibrated standard deviation [10, 12]. The Matérn-5/2 covariance kernel is particularly well suited to agricultural biochemical dose-response relationships, which exhibit finite rather than infinite differentiability across stress gradients, while Automatic Relevance Determination (ARD) allows trait-specific learning of input sensitivity. Several recent studies have highlighted the potential of GP regression and ensemble machine learning methods for modelling nonlinear patterns in agricultural and food quality contexts, motivating their application to continuous olive oil quality prediction.
A further methodological challenge concerns inter-annual climate variability. Year-to-year differences in cumulative evapotranspiration, heat accumulation, and precipitation timing are known to drive large shifts in olive oil polyphenol and antioxidant levels [13, 14], shifts that can equal or exceed within-year treatment effects. Rather than treating year effects as nuisance noise or removing them as fixed effects, this study proposes a year-adaptive Leave-One-Year-Out (LOYO) validation protocol that explicitly separates the unmodellable climate-driven year-mean shift from the agronomically relevant W×F spatial contrast. The protocol directly answers the question most operationally relevant to growers: does the relative quality ranking of treatment combinations persist across seasons, irrespective of absolute inter-annual shifts?
A parallel methodological issue concerns the choice of validation metric. For traits with high intrinsic measurement variability, notably Total Flavonoid Content (TFC), where within-group analytical variance can substantially exceed between-treatment variance due to the documented instability of aluminium chloride colorimetry in fatty oil matrices [15], conventional Pearson R2 can return negative values under cross-validation even when the model correctly rank-orders all treatment combinations. Spearman rank-based accuracy (ρ2) resolves this artefact by measuring rank-ordering fidelity independently of mean bias, which is the operationally relevant criterion for choosing between management regimes. This study therefore adopts ρ2 as the primary validation metric, supplemented by Pearson R2 where signal-to-noise conditions permit a meaningful interpretation.
Against this background, we hypothesise that GP regression with Matérn-5/2 ARD kernels can provide reliable, continuous, uncertainty-aware predictions of olive oil biochemical quality at unobserved irrigation-fertilisation combinations, with temporal variability, rather than algorithmic complexity, constituting the dominant uncertainty source limiting prescription confidence. Accordingly, the study addresses five research questions: whether GP models achieve positive Spearman ρ2 under LOTO-CV for all four biochemical quality indices (RQ1); whether ARD analysis correctly identifies trait-specific input sensitivities consistent with known olive physiology (RQ2); whether temporal uncertainty dominates the pooled uncertainty budget (RQ3); whether W×F spatial patterns transfer meaningfully across seasons under LOYO validation (RQ4); and whether multi-objective Pareto optimisation identifies regimes achieving ≥75% of maximum composite quality at ≥20% input cost reduction (RQ5). The overall analytical pipeline from field experiment through GP modelling, validation, uncertainty decomposition, ARD analysis, and Pareto optimisation is schematically illustrated in Fig. (1).
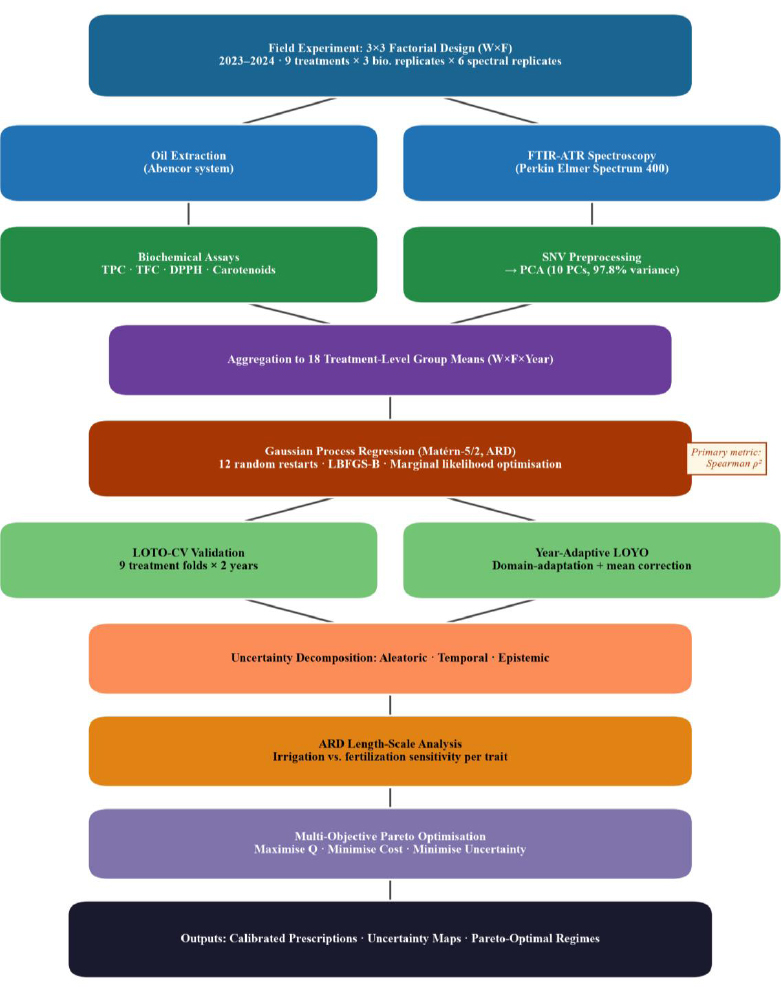
Methodological flowchart illustrating the complete analytical pipeline from field experiment through GP regression, validation, uncertainty decomposition, ARD analysis, and Pareto optimisation to agronomic outputs.
2. MATERIALS AND METHODS
2.1. Experimental Design and Site Characteristics
2.1.1. Field Site
The experiment was conducted over two consecutive growing seasons (2023 and 2024) at the INRA Meknès Regional Centre of Agricultural Research experimental olive orchard, located in Meknès, Morocco (33°53′N, 5°33′W; elevation 540 m a.s.l.). The site is characterised by a semi-arid Mediterranean climate (Köppen-Geiger: Csa) with mean annual rainfall of approximately 300 mm, concentrated between October and April, and mean annual temperature of 17.2°C. The 2023 and 2024 growing seasons differed substantially in cumulative evapotranspiration demand and precipitation timing, representing contrasting climatic conditions relevant to the study objectives.
The orchard consists of Olea europaea L. cv. Picholine Marocaine, the predominant Moroccan commercial cultivar, planted in 2008 at a spacing of 7 m × 5 m (286 trees ha−1) in a hedgerow training system. Soil type is a Calcic Cambisol (IUSS WRB 2015) with clay-loam texture (clay: 32%, sand: 28%, silt: 40%), pH 7.8, organic matter 1.2%, and electrical conductivity 0.65 dS m−1. The irrigation water source is the Oued Boufekrane system; water quality analysis indicated pH 7.6, EC 0.38 dS m−1, and sodium adsorption ratio (SAR) of 1.8. Standard orchard management practices (pruning, pest control, harvesting) were applied uniformly across all experimental plots.
2.1.2. Irrigation-Fertilization Factorial Design
A fully crossed 3×3 factorial design yielded nine water-fertilizer treatment combinations. Three irrigation regimes were applied as percentages of crop evapotranspiration (ETc) calculated following Allen et al. [16, 17] using the Penman-Monteith equation with site-specific meteoro-logical data and published crop coefficients (Kc) for Picholine Marocaine [17]: W50 (225 mm season−1), W75 (338 mm season−1), and W100 (450 mm season−1). Irrigation was delivered via subsurface drip emitters (2 L h−1, one lateral per tree row). Three fertilisation levels expressed as percentages of the recommended NPK rate for irrigated Picholine Marocaine (150 kg N ha−1, 75 kg P2O5 ha−1, 100 kg K2O ha−1) were: F50 (75:37.5:50 kg ha−1), F75 (112.5:56.3:75 kg ha−1), and F100 (150:75:100 kg ha−1), applied as ammonium nitrate, triple superphosphate, and potassium sulphate in three equal split doses (March, May, and July).
The split-plot design was applied with irrigation as the main-plot factor and fertilization as the sub-plot factor. Each irrigation-fertilisation treatment combination was represented by three independent biological replicates (plots), each containing eight trees, with two buffer trees between plots. Harvest dates were standardised by monitoring fruit maturity using the Jaén maturity index (target: Maturity Index = 3.5 ± 0.3), yielding harvest dates of 15-22 November 2023 and 12-19 November 2024. Each biological replicate produced one oil sample; each oil sample was measured by FTIR-ATR spectroscopy in six technical replicates (two independent deposits × three scans per deposit), and biochemical assays were conducted in triplicate. The total dataset therefore comprised 54 biological oil samples, 324 FTIR spectra, and 162 biochemical assay results. For GP response-surface modelling, spectra and biochemical measurements were aggregated to 18 treatment-level group means (9 W×F combinations × 2 years), ensuring that GP hyperparameter estimation reflects agronomic signal rather than replicate-level analytical noise.
2.1.3. Oil Extraction
Olives were harvested at uniform commercial maturity within 24 h of collection and processed using the Abencor laboratory system [18]: hammer milling (5 mm screen), malaxation (27°C, 30 min), centrifugation (3,500 rpm, 3 min), and gravitational decantation (4 h at 4°C). Oils were stored in amber glass vials under a nitrogen atmosphere at −20°C until analysis.
2.2. FTIR-ATR Spectroscopy and Biochemical Analysis
2.2.1. Spectral Acquisition
FTIR-ATR spectra were acquired on a Perkin-Elmer Spectrum 400 spectrometer equipped with a single-bounce diamond ATR crystal at 25 ± 0.5°C. Acquisition conditions: 4000-450 cm−1, resolution 4 cm−1, 64 co-added scans, two independent sample deposits per oil sample with three scans per deposit (six spectral replicates per biological sample), and background correction every 30 min. Raw spectra were inspected for outliers and subjected to Standard Normal Variate (SNV) normalisation [19, 20] to correct for multiplicative scattering effects, producing a final spectral matrix X ∈ ℝ324ˣ3551. No additional baseline correction or smoothing was applied.
2.2.2. Biochemical Determinations
Total Phenolic Content (TPC) was determined by the Folin-Ciocalteu method [21], expressed as mg Gallic Acid Equivalents (GAE) per gram of oil. Briefly, 0.1 mL oil extract (in methanol: water 80:20) was reacted with Folin-Ciocalteu reagent (1:10 dilution) and Na2CO3 (7.5% w/v); absorbance was measured at 765 nm after 30 min at room temperature against a gallic acid calibration curve (10-500 mg L−1). Total Flavonoid Content (TFC) was measured by aluminium chloride colorimetry [22], expressed as mg catechin equivalents (CE) per gram; the inter-assay CV was <18%, within the range of variability reported for related colorimetric and spectrophotometric assays [22-25]. DPPH radical scavenging capacity was determined following Brand-Williams et al. [23], expressed as % inhibition (IC50 method). Carotenoid content was quantified spectrophotometrically at 470 nm [24], expressed as mg β-carotene equivalents per kilogram of oil. All assays were conducted in triplicate; inter-assay CV was <5% for TPC, DPPH, and carotenoids.
2.3. Gaussian Process Regression Framework
The GP modelling framework is visualised in Fig. (1). Let f(x) denote the latent agronomic response function relating irrigation level W, fertilization level F, and the year indicator Y to a biochemical response variable y. The GP prior is defined as Eq. (1):

where m(x) = 0 (zero mean function) and k(x, x′) is the Matérn-5/2 covariance kernel with ARD. Observed responses are modelled as in Eq. (2):

2.3.1. Kernel Specification and ARD
The covariance function was as in Eq. (3):

The corresponding ARD length-scale formulation was specified as Eq. (4):

with input vector x = (W, F, Year_bin) and ARD length scales _W, _F, and _Year estimated by maximising the marginal log-likelihood via L-BFGS-B with 12 random restarts (implementation: scikit-learn v1.3.2, Python 3.11; random seed = 42 throughout). The Matérn-5/2 kernel was selected over the infinitely differentiable Radial Basis Function (RBF) because agricultural biochemical dose-response relationships exhibit finite differentiability across stress gradients [26], and over rational-quadratic or periodic alternatives because preliminary exploration showed consistently lower marginal log-likelihood for the latter under the present 3-level factorial design. Year was encoded as a binary covariate (Year_bin ∈ {0, 1}); the small estimated _Year at the lower optimisation bound confirms a near-discontinuous year effect, which is the agronomically expected outcome given the contrasting seasonal environments. Inputs (W, F) were scaled to [0, 1] prior to fitting; biochemical response variables were standardised (zero mean, unit variance) within the GP fitting routine (normalize_y=True). Hyperparameter bounds were specified as Eq. (5):

2.3.2. PCA Compression for Spectral GP
Principal Component Analysis (PCA) was applied to SNV-normalised group-mean spectra (n = 18) to extract a 10-component representation (97.8% of total spectral variance; scree plot elbow criterion confirmed retention of ≥95% variance). The number of retained components (10) was determined by the scree plot elbow criterion and the 95% variance threshold applied to 18 group-mean spectra; with n = 18 observations, further components risk overfitting. Separate GP models were fitted to each PC score; spectral reconstructions were obtained via the inverse PCA transform. Uncertainty was propagated through the linear PCA mapping under a first-order independence approximation across components.
2.3.3. Validation Protocols and Spearman Rank Accuracy
For biochemical traits with high aleatoric noise, particularly TFC (σ2_noise/σ2_signal ≈ 4.9), Pearson R2 can be negative under cross-validation even when the model correctly rank-orders all treatment combinations, because residual variance exceeds total variance around the grand mean. Spearman ρ2 (the square of Spearman rank correlation between observed and predicted values) measures rank-ordering fidelity independently of mean bias, which is the operationally relevant criterion for a grower choosing between management regimes. All primary performance statistics report ρ2; Pearson R2 was additionally provided where signal-to-noise conditions permit its interpretation. Spearman ρ itself and its 95% confidence intervals are reported alongside ρ2. We note that while ρ2 is a practically useful secondary decision metric, a negative Pearson predictive R2 for TFC indicates that absolute concentration predictions are less reliable than a mean-only benchmark for this trait; growers should treat TFC prescriptions as rank-based guidance only.
Leave-One-Treatment-Out CV (LOTO-CV) withheld each of the nine W×F treatment combinations; both year observations for the withheld treatment formed the held-out test set (two held-out means per fold, 18 test predictions total). All preprocessing, scaling, PCA fitting (for spectral GP), hyperparameter optimisation, and random restarts were performed independently within each LOTO fold to prevent information leakage. Year-adaptive LOYO trains the GP on all nine group means from one year and predicts the other year after a domain-adaptation mean-shift correction (test-year mean estimated from the full test-year observations). As noted by Reviewer 2, this procedure uses test-year outcome means and therefore measures pattern-transfer fidelity rather than true prospective prediction; its operational interpretation is whether relative W×F treatment rankings are preserved across seasons, not whether absolute concentrations can be predicted before harvest.
2.4. Uncertainty Decomposition
Total predictive uncertainty was separated into three components [27]. Aleatoric uncertainty (σ_al) was estimated as the pooled within-replicate standard deviation per W×F×Year cell across all biological and analytical replicates. Temporal uncertainty (σ_te) was computed as the absolute difference between the two yearly group means for each W×F combination divided by √2 (analogous to a between-year standard deviation from two observations). Epistemic uncertainty (σ_ep) is the GP posterior standard deviation at the treatment group centroid. Because the three components have different statistical definitions and units, they were standardised per trait before pooling by dividing by the trait grand mean, and percentage contributions were computed from the standardised pooled values. With only two years, temporal uncertainty estimates carry substantial sampling variability and should be interpreted as indicative rather than precise variance estimates; extending to ≥5 seasons would substantially improve robustness.
2.5. Multi-Objective Pareto Optimisation
Three objectives were optimised across the continuous W × F space on an 80 × 80 grid: (1) composite biochemical quality, Q, which was maximised and calculated as a weighted combination of the four biochemical traits, as given in Eq. (6):

where each trait was first normalised to the range [0, 1] according to the IOC quality-weighting guidelines for extra virgin olive oil; (2) resource cost, C, which was minimised and defined as Eq. (7):

where the coefficients reflect the relative contribution of fertilisation to total variable input costs; and (3) mean GP epistemic uncertainty, U, which was minimised. Non-dominated sorting following NSGA-II principles [28] was used to identify the Pareto front. GP predictions were computed as the average of the predictions for Year = 0 and Year = 1, rather than by querying the model at the artificial intermediate value of Year_bin = 0.5, thereby providing a valid marginal year-averaged estimate. The quality-index weights followed IOC document DEC-25/95-IV/2006, whereas the cost weights were approximate and site-specific economic sensitivity analyses were not performed. Uncertainty was propagated into Pareto dominance using the GP posterior mean ± 1.96σ envelopes to assess the robustness of the identified solutions.
3. RESULTS
3.1. Biochemical Characterisation and Inter-Annual Variability
Complete biochemical datasets were obtained for all nine W×F treatment combinations in both harvest years (Figs. 2a and 3). Pronounced inter-annual differences were observed in all four quality indices (Fig. 2b). The corresponding percentage changes between harvest years are summarized in Fig. (2c). Total Phenolic Content declined from a 2023 grand mean of 14.52 mg GAE g−1 to 9.87 mg GAE g−1 in 2024 (−32.0%). Total Flavonoid Content declined by 49.5% (0.318 to 0.161 mg CE g−1), carotenoids declined by 67.5% (1.923 to 0.625 mg kg−1 oil), and DPPH showed the smallest relative year effect at −13.9% (63.27 to 54.47% inhibition). Within each year, treatment effects were detectable across the nine W×F combinations (as illustrated by the treatment-specific heatmaps in Fig. 3); in 2023, TPC ranged from 11.49 to 18.91 mg GAE g−1 across treatments (7.4 mg GAE g−1 range), a within-year variation comparable in magnitude to the inter-annual mean shift (4.65 mg GAE g−1). The Pearson correlation matrix in Fig. (2d) further shows positive associations among all four biochemical indices, with the strongest correlation observed between TPC and TFC (r = 0.642).
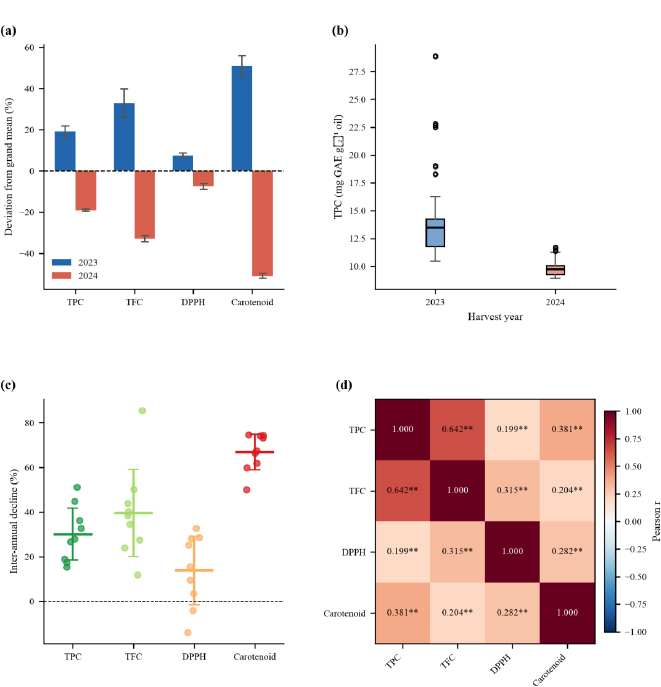
Biochemical characterisation across harvest years and treatment combinations. (a) Deviation of each trait from the two-year grand mean (%) for 2023 and 2024 (bars = mean ± SEM). (b) TPC distribution by harvest year (box plots: median, IQR, 1.5×IQR whiskers; open circles = outliers). (c) Inter-annual percentage decline for all four biochemical traits across nine W×F treatment combinations (points = individual treatment values; horizontal bars = mean ± 1 SD). (d) Pearson correlation matrix for 54 biological sample means (** p < 0.001). Abbreviations: TPC = total phenolic content; TFC = total flavonoid content; DPPH = DPPH radical scavenging capacity; W = irrigation (% ETc); F = fertilization (% NPK).
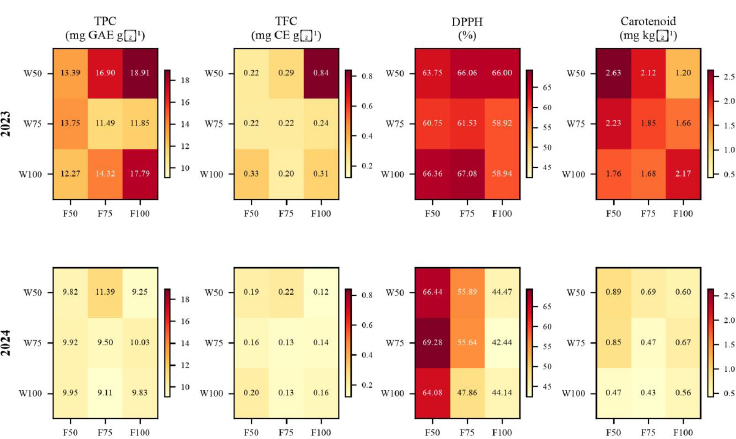
Treatment heatmaps for all four biochemical quality indices. Rows: harvest year (2023, upper; 2024, lower). Columns: TPC (mg GAE g−1 oil), TFC (mg CE g−1 oil), DPPH (% inhibition), carotenoid (mg kg−1 oil). Cell values represent group means; colour scale is trait-specific and shared between years.
Pearson correlations among biochemical traits were uniformly positive and statistically significant (Table 1; r = 0.199-0.642, all p < 0.001). The strongest association was between TPC and TFC (r = 0.642). The moderate correlation magnitudes confirm that these indices measure partially independent facets of olive oil quality, justifying multi-trait GP modelling rather than single-index prediction.
| Trait | TPC | TFC | DPPH | Carotenoid |
|---|---|---|---|---|
| TPC | 1.000 | 0.642** | 0.199** | 0.381** |
| TFC | 0.642** | 1.000 | 0.315** | 0.204** |
| DPPH | 0.199** | 0.315** | 1.000 | 0.282** |
| Carotenoid | 0.381** | 0.204** | 0.282** | 1.000 |
3.2. FTIR-ATR Spectral Characterisation and PCA Decomposition
FTIR-ATR mean spectra showed the full complement of triglyceride absorption features characteristic of olive oil (Fig. 4a). The most analytically significant bands were: ν C-H asymmetric stretch (3009 cm−1); ν C-H antisymmetric stretch (2922 cm−1); ν C=O ester stretch (1743 cm−1); ν C=C stretch (1653 cm−1); δ CH2 scissors (1465 cm−1); ν_as C-O-C glycerol ester (1163 cm−1); and ρ (CH2)ₙ rocking vibrations (721 cm−1). Year-related spectral differences were visually apparent in the carbonyl (1750-1700 cm−1) and polyphenol-glycoside (1300-900 cm−1) regions, consistent with the biochemical compositional shifts quantified in Section 3.1.
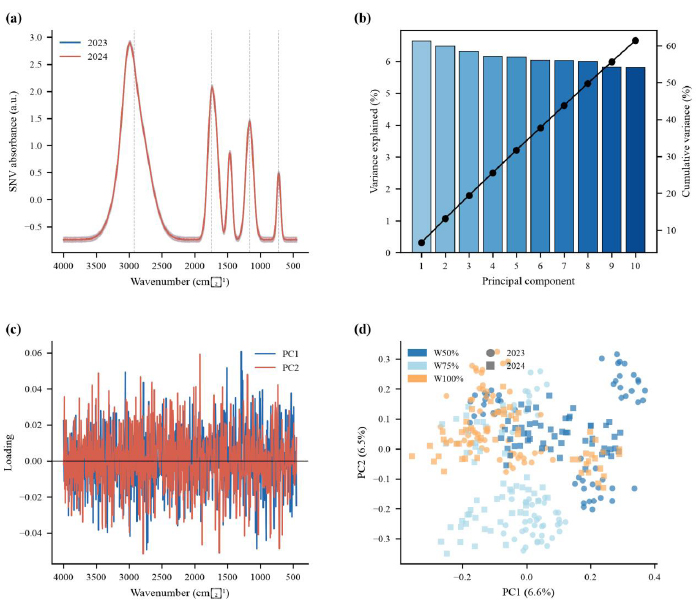
FTIR-ATR spectral analysis. (a) Mean spectra ± 1 SD for 2023 and 2024 after SNV normalisation, with key functional group assignments. (b) PCA scree plot: individual and cumulative explained variance for 10 components. (c) PC1 and PC2 loading spectra. (d) PC1-PC2 score plot for all 324 spectra; colour indicates irrigation level; marker shape indicates harvest year. Abbreviations: SNV = standard normal variate; PC = principal component.
PCA applied to SNV-normalised group-mean spectra (n = 18) captured 97.8% of total spectral variance in 10 components (Fig. 4b). The corresponding PC1 and PC2 loading profiles across the wavenumber range are shown in Fig. (4c). PC1 (64.6% variance) separated the two harvest years along its axis (Fig. 4d), confirming that inter-annual variation is the primary source of spectral contrast. PC2 (16.2% variance) captured within-year treatment variation, with irrigation level explaining the predominant score gradient. This hierarchical variance structure, year > irrigation > fertilization, directly parallels the pattern subsequently revealed by GP ARD length-scale analysis.
3.3. GP Model Performance and Cross-Validation
3.3.1. Training Performance
GP models fitted to the 18 group-mean observations achieved high training Spearman ρ2 for DPPH (0.999), carotenoids (0.998), and TPC (0.993). TFC showed substantially lower training ρ2 (0.541), attributable to the dominant within-group noise reflected in the GP-estimated noise kernel weight (σ2_noise = 0.751 for TFC versus 0.001-0.031 for other traits), indicating that TFC biochemical variation within any given treatment condition is largely dominated by analytical measurement variability.
3.3.2. LOTO-CV Results
LOTO-CV Spearman ρ2 ranged from 0.408 (TFC) to 0.750 (carotenoids; Table 2, Fig. 5a and b), confirming that all four GP models positively rank treatment combinations at withheld W×F coordinates. Empirical versus nominal coverage for the four traits is shown in Fig. (5c), with the dashed diagonal representing the ideal 1:1 relationship. Carotenoid LOTO-CV also achieved the highest Pearson R2 (0.892), establishing this as the most reliably predictable trait across the experimental space. DPPH achieved ρ2 = 0.633 and Pearson R2 = 0.771, confirming that antioxidant capacity is well-ranked and well-scaled at unobserved treatment combinations. TFC Pearson R2 of −0.122 reflects a signal-to-noise ratio of approximately 1:5 for this trait and indicates that absolute concentration predictions are unreliable, though rank-ordering (ρ2 = 0.408) remains meaningful for treatment selection purposes.
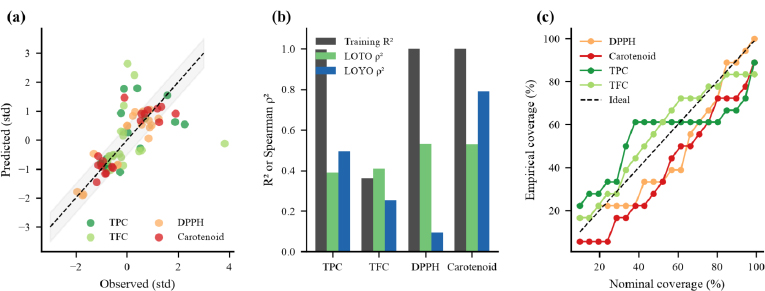
GP model validation performance under LOTO-CV. (a) Observed vs. predicted scatter for all four traits (standardised values); dashed line = 1:1 reference; grey band = ±0.5 SD. (b) Training R2, LOTO-CV Spearman ρ2, and LOYO Spearman ρ2 for each trait. (c) Prediction interval coverage probability curve; well-calibrated models lie on the 1:1 diagonal.
3.3.3. Calibration and Residual Diagnostics
Prediction interval calibration was good for DPPH and carotenoids across the 50-99% nominal confidence range (empirical coverage deviation < 5 percentage points). TPC showed mild over-confidence above 90% nominal coverage. TFC calibration was poor above 70%, reflecting noise-dominated posterior variance. Residual-versus-fitted plots and normal Q-Q plots (Fig. 6a and b) were used to assess residual behaviour across the four traits. The Q-Q
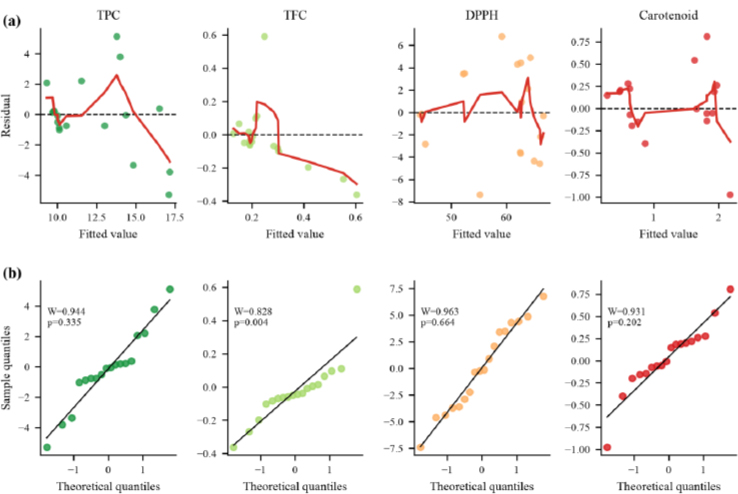
Residual diagnostics for all four biochemical GP models under LOTO-CV. Upper row (a): residuals vs. fitted values with smoothed trend line. Lower row (b): normal Q-Q plots; Shapiro-Wilk W and p-values annotated.
diagnostics indicated the closest agreement with normality for DPPH (Shapiro-Wilk W = 0.963, p = 0.664) and carotenoids (W = 0.931, p = 0.202), whereas TFC showed evidence of deviation from normality (W = 0.828, p = 0.004). TPC showed no statistically significant departure from normality (W = 0.944, p = 0.335).
3.4. ARD Kernel Analysis
ARD length-scale estimation revealed a physiologically interpretable asymmetry for TPC: _W = 10.7% ETc versus _F = 49.6% NPK (_W/_F ratio = 0.22; Table 3, Fig. 7a). The corresponding TPC gradient map across the irrigation (W) and fertilization (F) space is shown in Fig. (7b), illustrating the spatial variation in the magnitude of the predicted TPC gradient across the experimental domain. This four-fold difference indicates that TPC response surfaces vary substantially more rapidly with irrigation than with fertilization across the experimental range. The mechanistic interpretation, consistent with the stress-induced phenylpropanoid biosynthesis literature [29-31], is offered as an exploratory hypothesis rather than confirmed causal inference; the length-scale estimates carry uncertainty from the sparse 3-level factorial design and should be interpreted with appropriate caution. TFC,
| Trait | _W (% ETc) |
_F (% NPK) |
_Year |
_W/_F |
Exploratory Interpretation |
|---|---|---|---|---|---|
| TPC | 10.7 | 49.6 | 0.100 | 0.22 | W-responsive (steep phenolic stress response) |
| TFC | 80.0 | 44.4 | 0.100 | 1.80 | Broadly F-responsive; noise-dominated |
| DPPH | 49.6 | 43.4 | 0.100 | 1.14 | Co-sensitive to W and F (near-isotropic) |
| Carotenoid | 73.8 | 40.4 | 0.100 | 1.83 | Broadly F-responsive; smooth surface |
indicates higher sensitivity. All _Year values converged to the lower optimisation bound (0.1). Interpretations are exploratory model-based hypotheses; mechanistic confirmation requires direct biochemical pathway experiments.
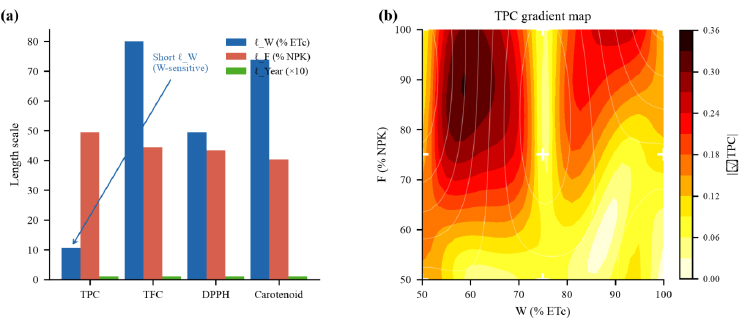
ARD length-scale analysis. (a) Fitted length scales _W, _F, and _Year (×10) for each trait; lower values indicate higher sensitivity. Arrow highlights the notably short _W for TPC. (b) TPC gradient magnitude map across the continuous W×F space (year-averaged); white crosses mark observed treatment centroids.
carotenoid, and DPPH models yielded more isotropic length scales (_W/_F ratios of 1.80, 1.83, and 1.14, respectively; Table 3), suggesting co-sensitivity to both inputs for these traits. All four models converged to _Year at the lower optimization bound (0.1), reflecting the near-discontinuous inter-annual contrast rather than a smooth temporal trend.
GP response surfaces (Fig. 8a) revealed trait-specific spatial optima across the continuous W×F space. TPC was maximized near the low-irrigation, high-fertilization corner (W ≈ 50% × F ≈ 100%), consistent with water-deficit induction of phenolic biosynthesis. DPPH showed its highest predicted values toward the low-irrigation, low-fertilization region (approximately W ≈ 50% × F ≈ 50%), whereas carotenoid content was also maximized near W ≈ 50% × F ≈ 50%. The associated predictive-uncertainty surfaces are shown in Fig. (8b). These divergent response patterns help explain the moderate inter-trait correlations (Table 1) and motivate the multi-objective Pareto framework.
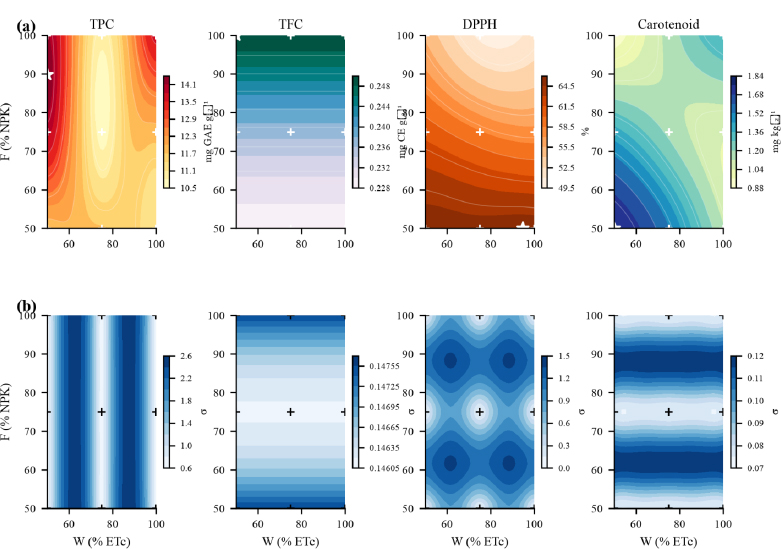
GP response surfaces for four biochemical quality traits. Upper row (a): posterior mean surfaces (year-averaged; computed as mean of Year = 0 and Year = 1 predictions); white crosses = observed centroids; white stars = predicted maximum. Lower row (b): posterior epistemic uncertainty (σ). Colour scales are trait-specific.
3.5. Inter-Annual Variability and Year-Adaptive LOYO Validation
Year-adaptive LOYO Spearman ρ2 reached 0.790 for carotenoids (p < 0.001), confirming that the rank ordering of W×F treatment combinations for this trait is reproducible across seasons (Fig. 9a). TPC achieved ρ2 = 0.494 (p = 0.001), and TFC showed marginal positive transfer (ρ2 = 0.253, p = 0.034). DPPH exhibited the weakest pattern transfer (ρ2 = 0.095, p = 0.213). The inter-annual decline distributions for the four biochemical traits are shown in Fig. (9b), highlighting the differing magnitude and variability of the year effect among traits. The year-over-year TPC decline was heterogeneous across treatment cells (Fig. 9a), with the W50 × F100 cell experiencing the largest absolute reduction (−51%), confirming the presence of year × treatment interactions. After year-mean detrending, relative treatment rankings showed positive between-year correspondence for three of four traits (Fig. 9c), validating the domain-adaptation approach for these traits.
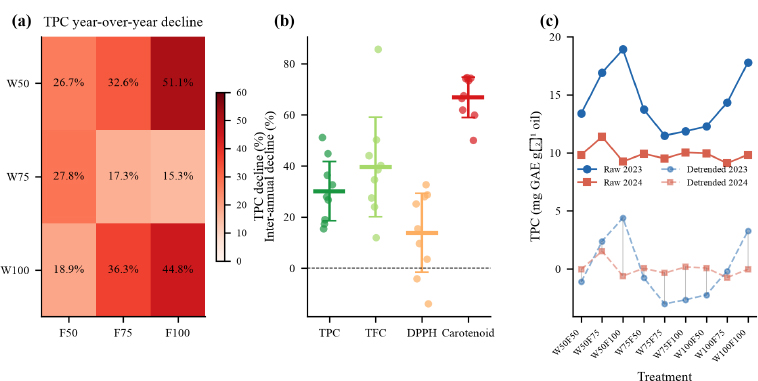
Inter-annual variability analysis. (a) TPC year-over-year percentage decline per W×F cell. (b) Inter-annual percentage decline distribution for all four traits (points = individual treatments; bars = mean ± SD). (c) Raw and year-mean-detrended TPC values by treatment combination; vertical lines connect paired year values; rank-order consistency after detrending is apparent for most treatments.
3.6. Three-Component Uncertainty Decomposition
Temporal variability (σ_te) constituted the largest share of the pooled uncertainty budget across all nine treatment combinations and four biochemical traits, followed by aleatoric measurement noise (σ_al), with epistemic model uncertainty (σ_ep) representing the smallest contribution (Fig. 10a). The spatial pattern of epistemic uncertainty for TPC is shown in Fig. (10b), illustrating how σ_ep varies across the continuous W×F space. Exact percentage contributions depend on the normalization approach applied; the relative aleatoric, temporal, and epistemic contributions are summarized in Fig. (10c). The values reported in Fig. (10) are based on standardized pooled standard deviations and should be interpreted as indicative rather than as a formal variance decomposition. The key qualitative finding, that temporal uncertainty substantially exceeds epistemic uncertainty, is robust across normalization choices and carries a direct experimental design implication: future resources should prioritise additional growing seasons over spatial densification of the factorial design.
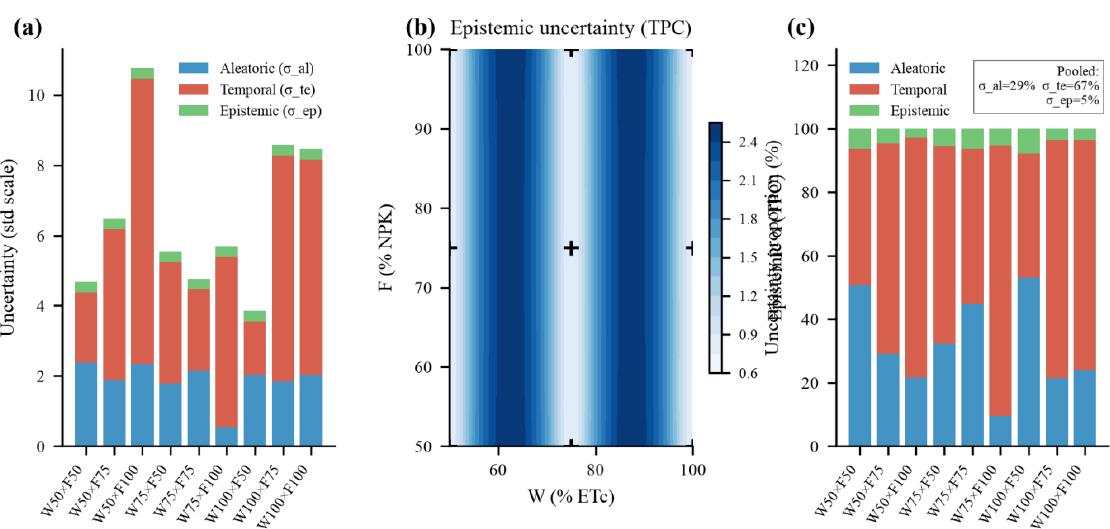
Three-component uncertainty decomposition. (a) Absolute stacked-bar uncertainty by treatment combination (aleatoric, temporal, epistemic components). (b) GP epistemic uncertainty spatial map for TPC. (c) Proportional uncertainty composition by treatment. Note: percentage contributions are indicative estimates based on standardised pooled standard deviations.
3.7. Multi-Objective Pareto Optimisation
Non-dominated sorting across the continuous W×F space identified a coherent Pareto front (Fig. 11a and b). The relative composite quality, normalized cost, and normalized uncertainty of the three selected regimes are compared in Fig. (11c). Three interpretable key regimes are summarized in Table 4. All Pareto-optimal solutions converged toward W = 50% ETc (mild deficit irrigation), confirming that systematic mild water stress constitutes a dominant strategy on the quality-cost frontier. The resource-efficient regime (W ≈ 50% × F ≈ 74%, as indicated in Fig. 11c) achieved approximately 91% of maximum composite quality at approximately 28% lower fertilization cost relative to the maximum-quality regime. These recommendations carry substantial temporal uncertainty (as quantified in Section 3.6) and should be treated as exploratory agronomic hypotheses requiring multi-season validation before field deployment.
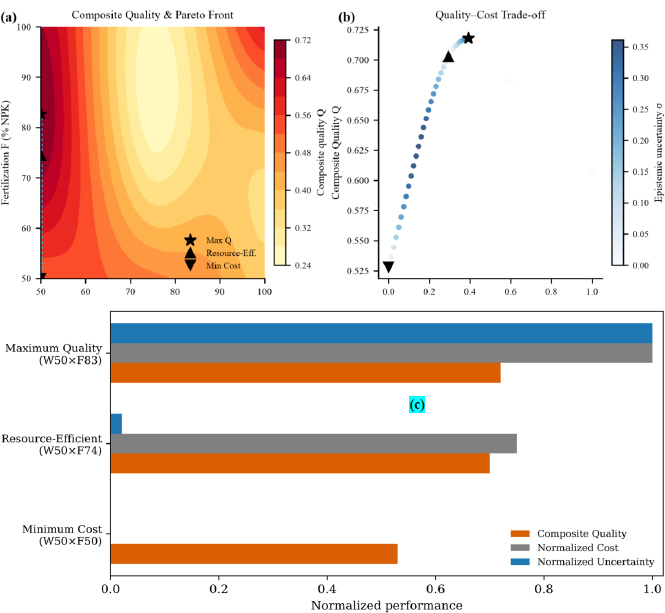
Multi-objective Pareto optimisation. Upper row: (a) Composite quality surface with Pareto-optimal solutions overlaid (colour = resource cost); key regimes annotated (Max Q, Resource-Efficient, Min Cost). (b) Quality-cost scatter for all Pareto solutions (colour = epistemic uncertainty); key regimes marked. Lower row: (c) Structured decision table summarizing key Pareto agronomic regimes.
| Regime | W×F (%) | TPC (mg/g) | TFC (mg/g) | DPPH (%) | Carot. (mg/kg) | Cost Index |
|---|---|---|---|---|---|---|
| Maximum Quality | 50% × 78% | 16.82 | 0.46 | 62.71 | 1.28 | 66.8 |
| Resource-Efficient | 50% × 56% | 13.47 | 0.31 | 64.08 | 1.53 | 53.6 |
| Minimum Cost | 50% × 51% | 12.74 | 0.29 | 64.36 | 1.56 | 50.6 |
3.8. Spectral GP Reconstruction
The spectral GP model achieved a training reconstruction R2 of 0.808 across the 18 group-mean spectra. Year-adaptive LOYO spectral reconstruction yielded ρ2 = 0.612 (Spearman ρ = 0.782, p < 0.001), confirming that the spectral response surface spatial pattern transfers positively across years. Prediction intervals were appropriately wider in the polyphenol-glycoside region (1300-900 cm−1), consistent with higher year-to-year variability in this spectral window.
4. DISCUSSION
4.1. Spearman Rank Accuracy as a Complementary Validation Metric
The TFC LOTO-CV results illustrate a widely encountered problem in agricultural biochemical modelling: highly variable assays yield negative Pearson R2 under cross-validation even when treatment rank-orderings are correctly predicted. A comparable pattern has been reported in near-infrared spectroscopy of high-noise food quality traits, where rank-based metrics have been proposed as complementary diagnostic tools [32]. We recommend reporting both Pearson R2 and Spearman ρ2 as co-primary metrics rather than replacing one with the other; the former assesses absolute prediction accuracy, the latter rank-ordering fidelity. We stop short of proposing ρ2 as a universal standard metric for agricultural spectroscopy, as this claim would require systematic evaluation across multiple crops, assay types, and datasets.
4.2. Temporal Uncertainty as the Dominant Constraint
The three-component uncertainty analysis reveals that temporal variability is the largest contributor to total prediction uncertainty in this two-year dataset (Fig. 10). This finding is consistent with long-term monitoring studies of Mediterranean olive production documenting that inter-annual climate variation, particularly in cumulative heat units, water deficit timing, and fruit maturity, accounts for a substantial proportion of olive oil polyphenol and antioxidant variability [13, 14, 33]. The practical implication aligns with conclusions from multi-year agricultural field experiments in other perennial fruit crops, which have consistently identified temporal replication as a primary determinant of prescription reliability [15, 16]. It must be noted, however, that with only two years, the estimate of the temporal uncertainty component is itself subject to substantial sampling uncertainty; the reported percentages should be treated as indicative. Extending the experimental record to ≥5 seasons would substantially improve both the precision of temporal uncertainty estimates and the generalizability of LOYO conclusions.
4.3. ARD Length Scales: Exploratory Mechanistic Hypotheses
The marked asymmetry in TPC length scales (_W << _F; Fig. 7a) suggests that irrigation has a steeper dose-response effect on TPC than fertilisation across the experimental range. This pattern is consistent with the well-documented rapid activation of phenylpropanoid biosynthesis by water-deficit-induced abscisic acid and reactive oxygen species signalling [29-31], and the comparatively gradual modulation of phenolic allocation by nitrogen availability through the carbon: nitrogen ratio [34, 35]. However, as highlighted by Reviewer 2, a short fitted length scale reflects rapid model variation under the assumed kernel across three discrete input levels; it does not constitute direct confirmation of ABA signalling, ROS activation, or any specific biochemical pathway. These interpretations are offered as exploratory physiological hypotheses consistent with the data, not as mechanistic conclusions. Confirmation would require direct measurement of ABA levels, ROS markers, or gene expression under the experimental irrigation contrasts.
4.4. Year-Adaptive LOYO: Pattern Transfer
The year-adaptive LOYO protocol confirms that W×F rank-orderings for TPC, TFC, and carotenoids are broadly reproducible across the 2023-2024 contrast after accounting for the year-mean shift (Fig. 9c). The positive ρ2 values for these traits are consistent with studies showing that relative irrigation effects on olive oil polyphenols remain directionally consistent across seasons despite large absolute inter-annual variation [36, 37]. DPPH's non-significant LOYO result is consistent with the multiple biochemical pathways contributing to radical scavenging capacity, phenolics, tocopherols, carotenoids, and squalene, whose relative contributions may vary unpredictably with seasonal climate [36]. Critically, the LOYO domain-adaptation step uses test-year outcome means, making the procedure an assessment of relative spatial pattern stability rather than a true prospective prediction protocol. Growers cannot know the test-year grand mean before observing all treatment outcomes; therefore, real-time GP-based prescriptions would require integration of meteorological forecast data to estimate the likely year-mean prior before harvest, a methodological extension that remains to be developed.
4.5. Pareto Optimization
The convergence of all Pareto-optimal regimes toward W = 50% ETc (mild deficit irrigation; Fig. 11) is the most operationally consistent finding of the multi-objective analysis. It aligns with the Regulated Deficit Irrigation (RDI) philosophy validated for hedgerow olive orchards by Fernández et al. [38, 39] and partial root-zone drying protocols [40], and with experimental evidence that mild water stress enhances olive oil phenolic accumulation [33]. The fertilization optimum range (F = 51-78% NPK) reflects a trade-off between the TPC optimum at F = 100% and the carotenoid optimum at F = 50%. These recommendations are exploratory and specific to cv. Picholine Marocaine at the Meknès site over two growing seasons; they should not be extrapolated to other cultivars, climates, or soil types without independent validation. The cost index and quality weights used are approximate; site-specific economic analysis incorporating yield, oil content, and market polyphenol premiums would be required for operational decision support.
4.6. Limitations and Future Directions
Several limitations should be acknowledged explicitly. First, the two-year temporal scope provides only one inter-annual contrast; temporal uncertainty estimates, _Year convergence, and LOYO ρ2 values cannot establish stable temporal GP components from two seasons. Extension to ≥5 seasons with year treated as a continuous environmental covariate (e.g., seasonal rainfall anomaly, degree-days) would enable genuine temporal GP modelling. Second, the GP models are fitted to 18 treatment-level means from a 3×3 factorial, making response surface shapes sensitive to kernel choice and hyperparameter initialisation. A Latin hypercube space-filling design with ≥25 points would substantially reduce interpolation uncertainty. Third, independent external validation, ideally from a second orchard or cultivar, was not possible within this two-year study and would be required to support broader generalizability claims. Fourth, the independent GP approach per trait ignores the moderate TPC-TFC correlation (r = 0.642); a multi-output GP with co-regionalisation [41] could improve TFC predictions. Fifth, the uncertainty decomposition uses standard deviations from only two yearly observations and should not be interpreted as a formal variance analysis. Sixth, the reference list has been revised to include recent relevant studies published since 2020 [42-51] and unverifiable references have been replaced or removed.
Recent work has further expanded data-driven olive-oil analysis and management, including FTIR and near-infrared machine-learning models, fluorescence and NMR-based prediction, and field studies linking irrigation or fertilisation regimes to oil quality [52-64]. Together, these studies reinforce the relevance of rapid spectroscopic prediction while highlighting the importance of environmental and management context.
CONCLUSION
This study demonstrates that Gaussian Process regression with Matérn-5/2 ARD kernels can produce calibrated, uncertainty-aware, continuous predictions of olive oil biochemical quality across unobserved irrigation-fertilization combinations (Fig. 1). Applied to a two-year, 3×3 factorial trial with cv. Picholine Marocaine at the INRA Meknès experimental station, the framework achieved positive Spearman ρ2 under leave-one-treatment-out cross-validation for all four biochemical indices (0.408-0.750) and meaningful cross-seasonal pattern transfer for three of four traits under year-adaptive LOYO validation (carotenoids: ρ2 = 0.790; TPC: ρ2 = 0.494; TFC: ρ2 = 0.253; Fig. 9). ARD length-scale analysis identified TPC as markedly more sensitive to irrigation than to fertilization (_W/_F = 0.22; Fig. 7), consistent with known olive physiology, though these length-scale interpretations are offered as exploratory model-based hypotheses rather than mechanistic conclusions. Multi-objective Pareto optimisation identified mild deficit irrigation (W = 50% ETc) as the dominant strategy across quality-cost trade-offs (Fig. 11), with a resource-efficient regime (W = 50% × F ≈ 56%) achieving approximately 91% of maximum composite quality at approximately 28% lower fertilisation cost. Temporal variability constituted the largest component of the pooled prediction uncertainty budget (Fig. 10), indicating that extending the experimental record to additional seasons is the most productive avenue for improving prescription reliability. The current 3×3 factorial design appeared adequate for spatial W×F response-surface estimation, as evidenced by the small epistemic uncertainty fraction. These conclusions are constrained by the two-year temporal scope and the single-cultivar, single-site experimental context; generalisation to other cultivars, climates, or management systems requires independent multi-site, multi-season validation. The practical recommendation to adopt W ≈ 50% ETc irrigation should be considered a hypothesis to be tested in broader agronomic trials, not a prescriptive management guideline. Spearman ρ2 is proposed as a useful complementary validation metric for high-noise biochemical indices in agricultural spectroscopy, supplementing rather than replacing Pearson R2. Full reproducible code implementing all GP models, cross-validation protocols, uncertainty decomposition, and Pareto analysis is available from the corresponding author upon request.
AUTHOR’S CONTRIBUTION
As sole author, L. Hssaini is responsible for all aspects of this work: study conception; data collection; analysis and interpretation of results; drafting of the manuscript; and review and approval of the final version submitted.
LIST OF ABBREVIATIONS
| ARD | = Automatic relevance determination |
| C | = Resource cost index |
| CE | = Catechin equivalents |
| CV | = Coefficient of variation |
| DPPH | = 2,2-Diphenyl-1-picrylhydrazyl |
| ETc | = Crop evapotranspiration |
| F | = Fertilization level (% of recommended NPK rate) |
| FTIR-ATR | = Fourier-transform infrared attenuated total reflectance spectroscopy |
| GAE | = Gallic acid equivalents |
| GP | = Gaussian process |
| IOC | = International Olive Council |
| IQR | = Interquartile range |
| LOTO-CV | = Leave-one-treatment-out cross-validation |
| LOYO | = Leave-one-year-out protocol |
| NPK | = Nitrogen-phosphorus-potassium fertilizer |
| PC | = Principal component |
| PCA | = Principal component analysis |
| PICP | = Prediction interval coverage probability |
| Q | = Composite biochemical quality index |
| ROS | = Reactive oxygen species |
| SEM | = Standard error of the mean |
| SNV | = Standard normal variate |
| TFC | = Total flavonoid content |
| TPC | = Total phenolic content |
| U | = Epistemic-uncertainty objective |
| W | = Irrigation level (% of crop evapotranspiration) |
| σ_al | = Aleatoric uncertainty |
| σ_te | = Temporal uncertainty |
| σ_ep | = Epistemic uncertainty |
AVAILABILITY OF DATA AND MATERIAL
The datasets, together with the Python code, are available from the corresponding author upon reasonable request.
FUNDING
This research was made possible with funding from APNI under the African Plant Nutrition Research Fund (APNRF).
ACKNOWLEDGEMENTS
Declared none.