All published articles of this journal are available on ScienceDirect.
Intelligent Plant Leaf Disease Detection Using Generative Adversarial Networks: a Case-study of Cassava Leaves
Abstract
Background
Cassava leaf disease detection is a major problem since it is very difficult to identify the disease in naked-eye observation and even experts such as agricultural scientists can fail in this task. The approach we use in this paper has the potential to overcome this problem.
Materials and Methods
In this, we propose an approach based on artificial intelligence for leaf disease detection using deep learning with generative adversarial networks (GAN). Our experimental study used a dataset including 12880 cassava leaf pictures generated using CycleGAN showing five major disease classes. In order to avoid overfitting, a GAN architecture is proposed for data augmentation using two networks, i.e., a Generator and a Discriminator. The generator is trained to generate similar data samples as the original data
Results
The proposed approach achieved an accuracy of 99.51% for the classification of healthy or unhealthy leaf images, which outperformed existing methods.
Discussion
The discriminator is trained to distinguish between the unique and generated sample records, as actual or fake. To classify cassava images into five categories of diseases, a combination of machine learning models has been trained on original and generated images. The proposed approach showed better accuracy compared to the existing methods.
Conclusion
The proposed deep learning-based method can be used as a tool for early disease diagnosis in cassava leaf disease detection and classification
1. INTRODUCTION
Cassava is the primary crop in Africa and many other international locations. Africa is one of the biggest cultivators of Cassava plants. Poor quality cultivation can lead to diseases [1], which are similar to maize leaf sicknesses [2]. The early detection of leaf disease allows cultivars to be saved before they become permanently affected [3]. Previous research focused on an automated system to detect and count agricultural disease formation from leaf images [4]. Leaves that can be attacked employing the disorder will affect crop yields due to the fact leaves are a critical part of the plant since the phloem tissue transports the effects of photosynthesis to all special components of the plant [5].
To detect illness in cassava leaves, a laboratory or aid from a plant expert is usually used. However, laboratory testing is typically limited to employing value concerns, and an expert cannot discover it in time, so farmers are unable to rapidly and properly manage disease problems in cassava leaves. Deep learning (DL) and machine learning (ML) approaches for detecting plant leaf disease have been addressed in previous research providing promising results [6]. A smart classifier, which is connected to portable devices configured for specific diseases can improve detection accuracy by combining datasets [7]. In realistic settings, portable electronics such as smartphones, drones, and computers can be used [7].
In this work, DL and GAN are used to recognize cassava plant diseases using leaf images. In the proposed technique, we generated artificial pictures through the usage of Cycle GAN and augmented the dataset with these images to improve training. A combination of Convolutional Neural Network (CNN), VGG16, and ResNet34 models become skilled in cassava plant pictures and artificial snapshots generated by using the Cycle GAN model for the detection of sickness from the leaf pictures. This study affords a complete studying strategy for cassava leaf disease identification based on combinational approaches (CNN+VGG16+ResNet34).
The relevant original contributions of this research are:
(1) Comprehensive dataset generation of pictures of cassava leaves affected by known diseases.
(2) Analysis of how combining CNN, VGG16, and the ResNet34 model can improve cassava leaf disorder identification.
(3) Use of separable convolution reduces computational costs.
2. LITERATURE SURVEY
Cassava leaf disease prediction using ResNet-50- and SVM model is presented in reference [8]. In the first phase, the model starts by extracting all the relevant features and in the second phase classifies the image using an SVM classifier. The results show higher accuracy and overall performance with the aid of incorporating ResNet-50 and SVM classifiers. A hybrid transfer learning method is used in a digital image processing model [9]. In leaf disease research, accurate data processing is critical. This enhances the detection of plant disease patterns, forecasting, and model performance. A study [10] presents a machine-learning-based SVM and Naive Bayes model for detecting plant illnesses. Another study [11] used ImageNet to develop a deep-learning-based model for detecting Cassava disease. To classify leaf diseases, the SVM classification approach was used. In a study [12], a form and texture-based classification system for identifying Cassava disease is discussed. The proposed model had an accuracy of more than 84% and a detection rate of more than 88%. To forecast leaf disease, researchers [13] developed a deep-learning-based model. To identify thirteen specific crop diseases, this study employs a feature selection method. Using the Caffe deep-learning technique, researchers were able to train CNN architecture. To recognize fungal leaf infection, this program used a feature selection technique. In comparison to an existing model, the proposed model attained a 94.1 accuracy rate. To characterize Cassava illnesses in plants [14], presents a nine-layer-based convolutional neural network model. In small data scenarios for image recognition, data augmentation approaches have been critical in extending the training dataset. Horizontal/vertical flipping or mirroring, rotations, cropping, and other data augmentation techniques are some of the most employed. Table 1 compares and contrasts various existing approaches for detecting and analyzing plant leaf diseases.
| Type | Classification | Advantages of the Proposed Method | References |
|---|---|---|---|
| Apple disease | Faster CNNs | Higher accuracy and faster detection speed | [15] |
| Tomato disease | CNN | Better accuracy | [16] |
| Five crops diseases | CNN architecture | the multi-crop diseases can be classified | [17] |
| Rice | KNN, backpropagation, Naïve Bayes and multiclass SVM | Better accuracy | [18] |
| Multiple plant species | ResNet | lowers computational cost | [19] |
| Tomato | Inception-ResNetv2, Autoencoder | Better accuracy | [20] |
| Cassava | CNN model | Lower computational cost | [21] |
| Cassava | Random Forest, SVM, and SCNN | Better accuracy | [22] |
3. METHODOLOGY
3.1. Cassava Dataset
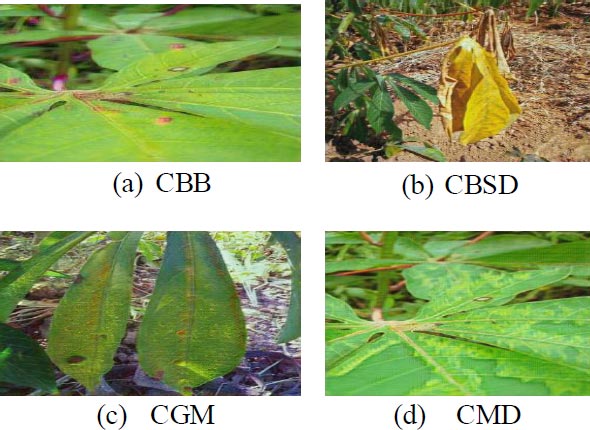
There are five specific classes as shown below. Each of which has a unique function that may be noticed at the leaf as shown in Fig. (1). CBB is a bacterial ailment, the main motive is moisture. Black leaf patches and blights are common symptoms. CBSD is caused by the Bemisia tabaci whitefly virus. There are indicators of leaves, as well as yellow chlorosis on secondary and tertiary leaf bones [23], and chlorotic patches constitute the second type of symptom. White patches on the leaves are caused by CGM. It starts as tiny spots that spread to cover the entire leaf floor, resulting in a lack of chlorophyll and thus impairing photosynthesis. CGM is caused by Mononychellus tanajoa, a bug that feeds on the undersides of younger leaves. CMD Spots of green are always present on leaves, along with the distinct coloration of yellow and white patches [24].
3.2. Architecture
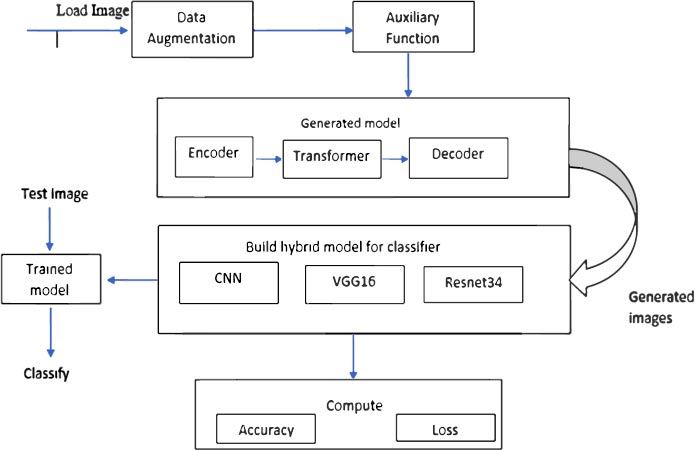
Fig. (2) shows the architectural diagram of the proposed model. First, load the TFRecord files of different classes. Here CycleGAN is used for data augmentation. The hybrid model (CNN+VGG16+Resnet34) was built to train the generated images. The hybrid model was trained to classify whether the input image is healthy or diseased.
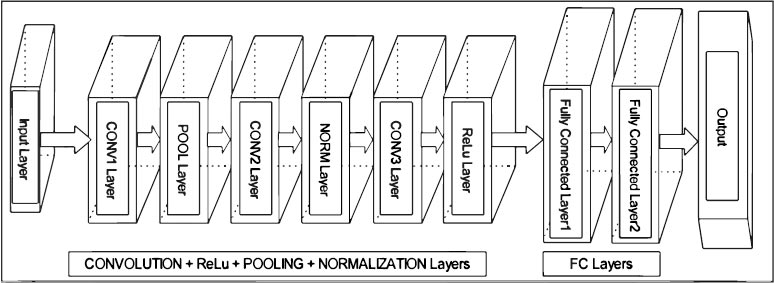
CNN is a completely famous approach in deep learning wherein a couple of layers are robustly trained. It has been discovered to be pretty powerful and is moreover the most broadly applied in numerous programs of computer vision. CNN operates on unorganized picture inputs and transforms them into the right output classes for type. In our paintings, a shape has been built for this set of rules. This form is crafted from several layers as shown in Fig. (3), which illustrates the structure that we used to construct the CNN.
By way of constructing the characteristic maps of all filters alongside the vertical height size, the outcome length of the conv layer can be obtained. The output of this layer in CNNs can be written as Eq. (1),
 |
(1) |
where pth layer is represented by p, Nj denotes the number of filters,
 denotes feature map, Kij denotes convolutional kernel, and Bj denotes bias term.
The output of the final convolutional might be exceeded as entering to this accretion. It system the input for higher learning and integrates the spatial facts of the training facts.
 |
(2) |
where the input data is presented by x, w denotes the weight vector, and the bias term is represented by b.
The output layer is the layer that has complete connectivity with the previous layer and receives input from it. It makes use of softmax activation for predicting the target output (elegance) with excessive opportunity cost. The softmax can be mathematically written as,
 |
(3) |
Where the number of classes is represented by n, the value of (Zi) is always a positive value within the range of (0,1). The numerator value is the input to the denominator and added with other positive numbers, the numerator takes any real value from the input vector. The value 1.0 can be summed up to output probability values.
VGG16 only contains convolutional and pooling layers, and it always uses a 3 x 3 Kernel for convolution and a 2x2 Kernel for a max pool as shown in Fig. (4). It has over 138 million variables. ImageNet data will be used to train it.
3.3. CycleGAN
Traditional convolutional layers are used in GAN to shape a picture matrix made of random noise. The generator's job is to create phony photos, while the discriminator's job is to tell the difference between fake and real photos. Two versions will be trained at the same time and will compete against each other. The discriminator makes sure that the images generated by the generator are as real as possible. An input layer, an embedding layer, and a dense layer are included in the CycleGAN discriminator version, along with an embedding layer, reshaping layer, and concatenate layer, which is observed by four convolutional layers. A Leaky ReLU layer is used to observe each convolutional layer. A flattened layer, a dropout layer, and a dense layer are used to follow the ultimate Leaky ReLU layer.
3.4. GUI
It is well known that farmers are not familiar with programming languages. So, it is very difficult for them to understand/analyze what is happening. Building user-friendly software helps them to identify the disease easily. It can be operated easily by way of a beginner. The user interface of the cell utility includes the handiest two buttons. Initially, a user has to upload the image to be classified. and the second button is assessed, which functions to classify the input picture using the hybrid model.

| Label | Name | Number of Images |
|---|---|---|
| 0 | CBB | 2576 |
| 1 | CBSD | 2576 |
| 2 | CGM | 2576 |
| 3 | CMD | 2576 |
| 4 | Healthy | 2576 |
4. RESULTS AND DISCUSSION
The dataset is accumulated from the Kaggle. The dataset has four types of unhealthy and one healthy leaf class [1]. The data label is shown in Table 2. 12880 JPG image files center center-cropped and converted into TFRecords.
4.1. Experimental Setup and Evaluation
Two units of experiments have been completed in this study. The CycleGAN model was trained for 30 epochs to generate false leaf pictures of cassava for each of the 5 classes in the first batch of experiments. After each epoch, the weights of the generator and discriminator models were adjusted to produce artificial images that were as close to genuine photographs as possible. In the second set of experiments, the combination of CNN, VGG16, and ResNet34, CNN+ResNet34, CNN+VGG16, and VGG16+ ResNet34 models have been trained on the combination of the original set and generated synthetic cassava leaf photographs. Overall performance metrics like validation accuracy, validation loss, and training loss are used to evaluate the performance. This work created two versions of the TFRecords, one version of the TFRecord resized the original 600x800 images, and another one that first center-cropped the images to 600x600 before resizing and then resizing them. Table 3 shows how the 600x800 original images were resized by the version of the TFRecords.
| Resolution | Resized | Center Cropped | External Center Cropped |
|---|---|---|---|
| 128x128 | 15 TFRecords | 15 TFRecords | 15 TFRecords |
| 256x256 | 15 TFRecords | 15 TFRecords | 15 TFRecords |
| 384x384 | 15 TFRecords | 15 TFRecords | 15 TFRecords |
| 512x512 | 15 TFRecords | 15 TFRecords - 50 TFRecords | 15TFRecords - 50 TFRecords |
Table 4 shows the added last dataset that is divided by classes, it might be useful if we want to do some kind of class sampling or train Generative Adversarial Networks.
| Resolution | Center Cropped | External Center Cropped |
|---|---|---|
| 512x512 | 15TFRecords - 50 TFRecords | 15TFRecords - 50 TFRecords |
The files were divided into 15 TFRecords files to make it easier to do K-Fold splits, they were stratified by the label. Evaluating a Machine Learning model may be quite complicated. Usually, we break up the records set into training and testing sets. We then compare the model performance based on an error metric to determine the accuracy of the version.
This method, however, isn't always very reliable as the accuracy acquired for one check set can be very exclusive from the accuracy obtained for a special test set. K-fold Cross-Validation (CV) affords a way to this problem by way of dividing the information into folds and making sure that each fold is used as a checking-out set sooner or later.
K-Fold CV is where a given statistics set is split right into a K range of sections/folds wherein every fold is used as a checking out set sooner or later. Table 5 shows how the files were divided to do K-Fold splits.
| File | Sample |
|---|---|
| 1 | 1427 |
| 2 | 1427 |
| 3 | 1427 |
| 4 | 1427 |
| 5 | 1427 |
| 6 | 1427 |
| 7 | 1427 |
| 8 | 1426 |
| 9 | 1426 |
| 10 | 1426 |
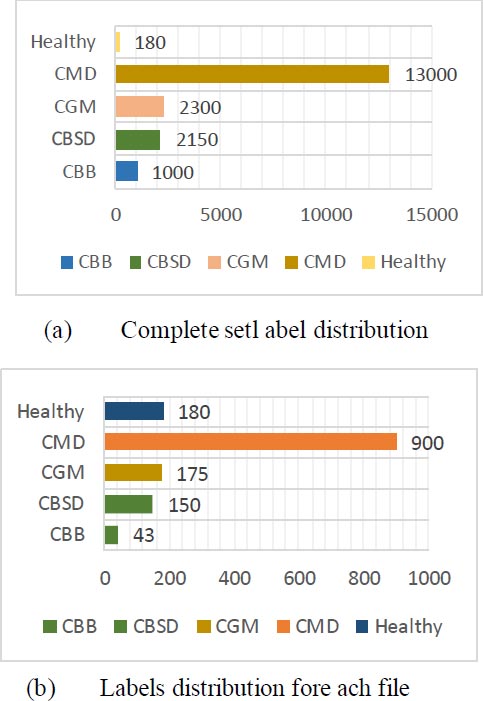
Fig. (5) shows the example of the label's distribution comparing the complete set to one of the TFRecord files.
4.1.1. Augmentations
Data augmentation for GANs should be done very carefully, especially for tasks similar to style transfer, if we apply transformations that can change too much the style of the data (e.g., brightness, contrast, saturation) it can cause the generator to not efficiently learn the base style, so in this case, we are using only spatial transformations like, flips, rotates and crops.
4.1.2. Auxiliary Function
Here developing the blocks of the models. There are three blocks as shown below
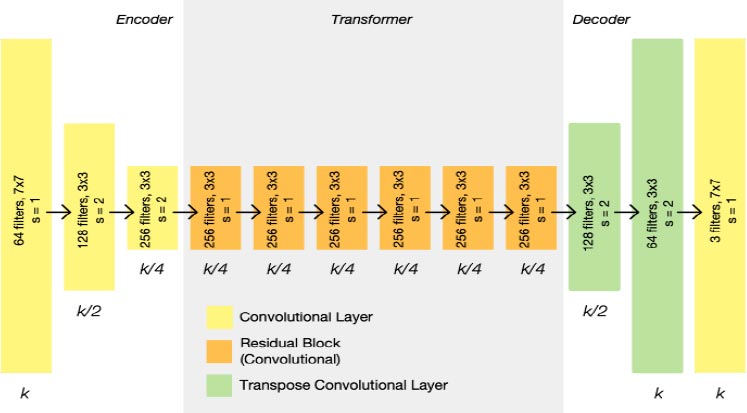
- Encoder block: Apply convolutional filters while also reducing data resolution and increasing features.
- Decoder block: Apply convolutional filters while also increasing data resolution and decreasing features.
- Transformer block: Apply convolutional filters to find relevant data patterns and keep features constant.
4.1.3. Generator Model
- The generator is responsible for generating images from a specific domain. CycleGAN architecture has two generators, in this context for example we can take one generator that will take Healthy images and generate CBB images, and the other generator will take CBB images and generate Healthy images.
- Below Fig. (6), is the architecture of the original CycleGAN generator, we have some changes to improve performance on this task.
Now Build the CycleGAN Model and Generator Models for respective Categories and save the models as cbb_generator.h5, cbsd_generator.h5, cgm_generator.h5, cmd_generator.h5, and healthy_generator.h5.
With the help of Generator Models, we can generate the images category-wise
The generator mapping functions are as follows:
 |
(4) |
 |
(5) |
where X is the input image distribution and Y is the desired output distribution.
CycleGAN has two mapping functions A: U→V and F: V →U corresponding to data domains U and V. The education of A calls for a discriminator DV to classify the generated photograph A(u) from the real samples yi ∈ V. The mapping F and the corresponding discriminator DU, which discriminates the generated image F(y) from the actual samples xi ∈ U, are also educated concurrently. We expect right here that U and V are the sets of wholesome and arbitrary target disorder pics, respectively.
The input is passed into the encoder, it extracts characteristics from the picture utilizing convolutions and compressing the representation of the photograph but will increase the number of channels. Three convolutions are included in the encoder, each of which uses 1/4th of the real picture length to minimize the illustration. The encoder's output is transmitted through the transformer once the activation characteristic is applied. Depending on the size of the input, the transformer may have six or nine residual blocks. The transformer's output is then transmitted via the decoder, which utilizes a fraction strides convolution block to raise the representation's dimensions to the authentic length.
4.2. Performance Evaluation of CycleGAN
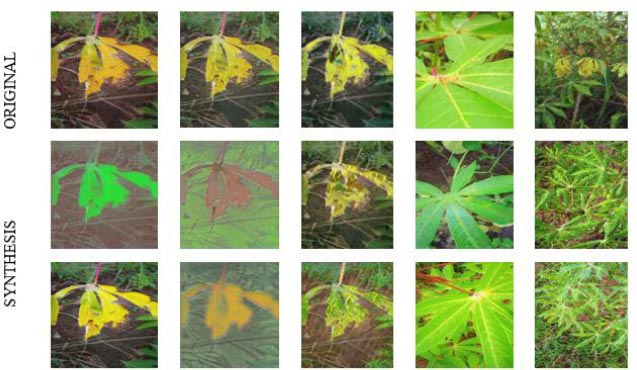
The performance of CycleGAN can be visually examined in Fig. (7). This shows the unique cassava leaf photographs from the dataset and artificial cassava leaf pics generated by using the Cycle GAN model.
After getting the generated Images from GAN techniques for different categories, we load those categories of images for classification purpose.
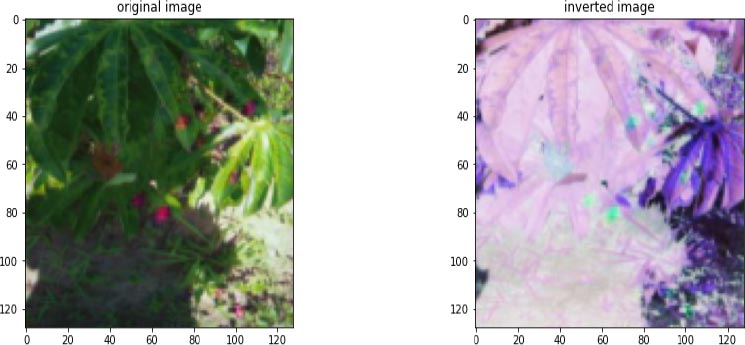
The combination of CNN, VGG16, and Resnet34 models are used for the classification of different categories of cassava leaf images. The dataset contains 12880 images. 11587 images were used for training and 1023 images for testing. Fig. (8) shows the inversion of the original image.
Fig. (9) presents the experimental outcomes i.e graphical plot of training accuracy, validation and training loss of the various proposed model.
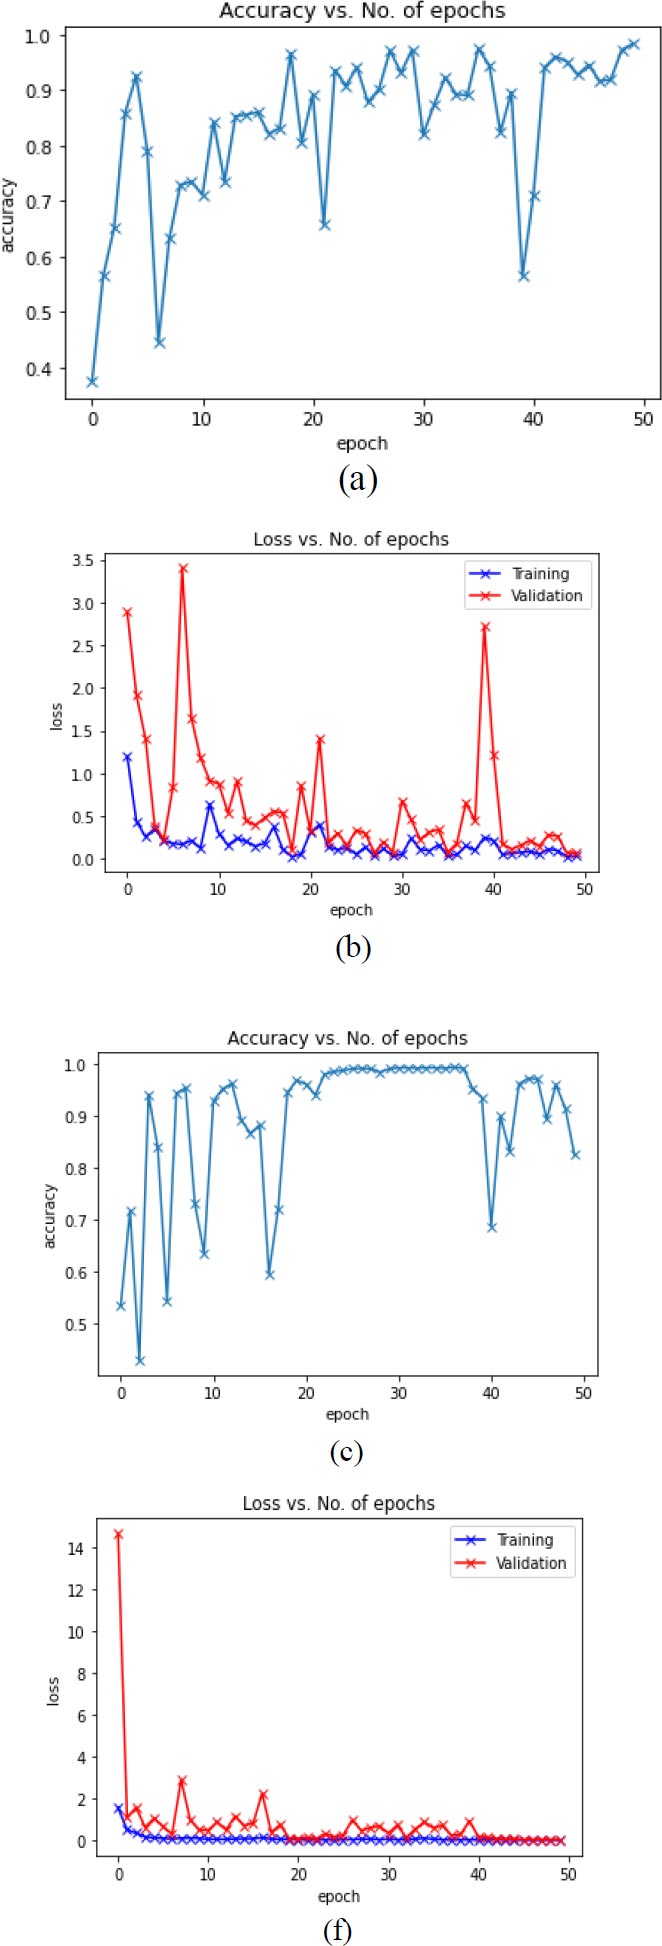
(f) VGG16+ResNet34 Training and Validation Loss).
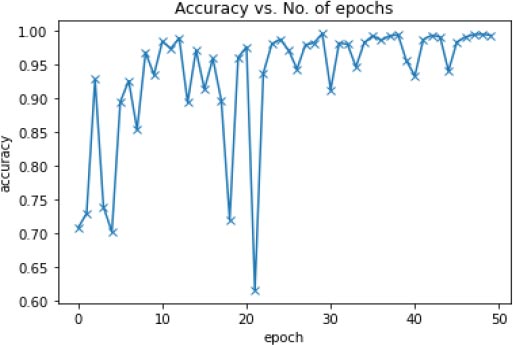
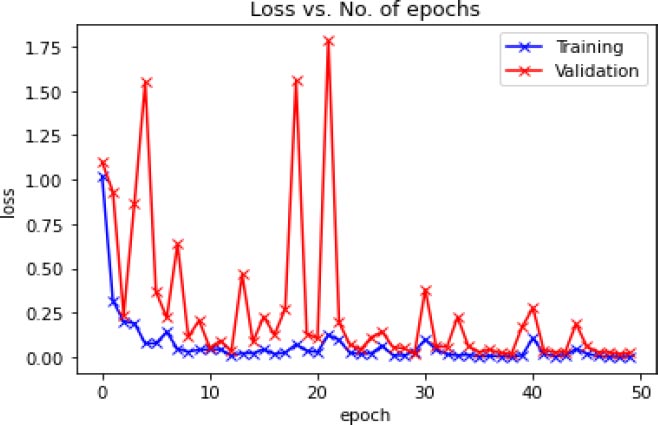
Fig. (10) shows the Accuracy vs. Number of epochs. We trained the model for 50 epochs, and the model (CNN+VGG16+ResNet34) was able to achieve the best accuracy of 99.51% at epoch number 30.
Fig. (11) shows the graphical plot of the training loss and validation loss concerning several epochs of the hybrid model (CNN+VGG16+ResNet34).
Table 6 indicates the experimental results for diverse Cassava leaf disease training (zero to four) for the proposed hybrid version for the dataset. These experimental results display that the proposed version performs higher accuracy, precision, and f1-score than the present method.
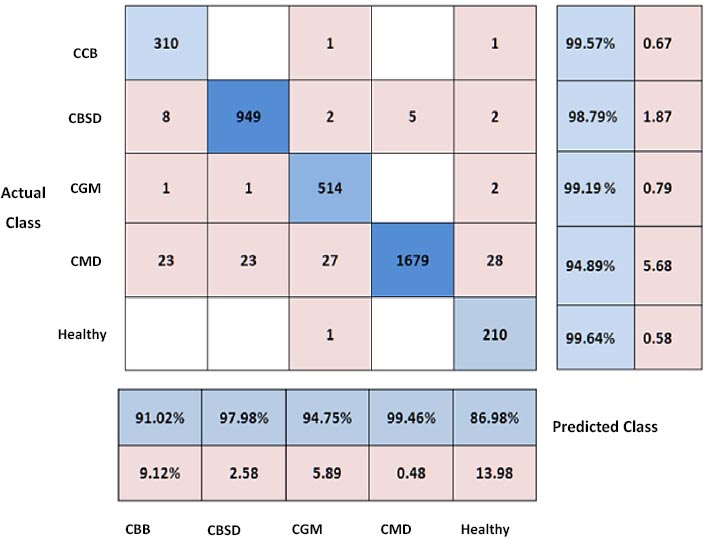
Fig. (12) shows the confusion matrix for various Cassava leaf sickness lessons using the proposed hybrid version (CNN+VGG16+ResNet34). This matrix shows the results of actual vs. forecasted statistics. The accuracy of the healthy class is 99.64 percent, which is superior to the other classes.
The GUI is developed to predict the class of disease. It has two options, browse for the input image and classify the test image. The user has to upload the input image by clicking on browse for the input image. After uploading when the user clicks on classified image it will display the type of disease. The development of a GUI for disease classification allows users to easily upload and classify test images, eliminating the need for manual coding or complex command-line interfaces. This simplifies the process and reduces potential costs associated with technical expertise or training.
5. PERFORMANCE COMPARISON
Several studies have been proposed in the past for detecting cassava plant illness from cassava leaf snap photos. We compared our proposed approach to several recent studies that have been proposed using the cassava dataset.
Table 7 examines performance evaluation using current approaches. The research presented in the table is particularly advanced for extraordinary illness type demands. The proposed hybrid model CNN+VGG16+ ResNet34 was able to achieve much higher accuracy compared to existing hybrid models.
| Class | Precision | Accuracy | Recall | F1-score |
|---|---|---|---|---|
| CBB | 90.21 | 92.30 | 84.56 | 84.35 |
| CBSD | 97.98 | 95.25 | 93.65 | 85.71 |
| CGM | 94.32 | 95.64 | 72. 13 | 76.45 |
| CMD | 99.12 | 98.60 | 97.23 | 85.32 |
| Healthy | 96.50 | 97.77 | 91.34 | 92.75 |
CONCLUSION
Plant disease is a serious problem in agriculture, therefore researchers are looking for a way for its automatic early detection, which we addressed through modern AI and ML techniques applied to computer vision and image recognition. In this study, we created a hybrid model for predicting illness class, and we have introduced another deep learning technique for detecting cassava plant disease from cassava leaf photos. For data augmentation, synthetic images were generated using Cycle Generative Adversarial Networks. The present standard CNN models use a larger number of features and a more complex computational procedure, which increases the computational cost. To address this issue, we combined the traditional CNN approach with VGG16 and ResNet34. The proposed approach aims to reduce expenses related to labor, data collection, training, and technical expertise in leaf disease detection using GANs. The proposed model employs a depth-wise layer separation and implements K-Fold Cross-Validation to reduce feature count and computational overhead. The proposed hybrid model is compared to the existing standard approach i.e. enhanced CNN. An experiment was carried out on a leaf dataset. The analysis demonstrated that the proposed hybrid model (i.e., CNN+VGG16+ ResNet34) outperforms the existing models in terms of accuracy.
In the future, we plan to improve on the current results in a variety of ways: (a) The dataset size and the number of disease classes can be increased. (b) Additional performance evaluation parameters can be added to ensure real-time computation.
LIST OF ABBREVIATIONS
| GAN | = Generative Adversarial Networks |
| DL | = Deep Learning |
| ML | = Machine Learning |
| CNN | = Convolutional Neural Network |
CONSENT FOR PUBLICATION
Not applicable.
AVAILABILITY OF DATA AND MATERIALS
The data and supportive information are available within the article.
FUNDING
None.
CONFLICT OF INTEREST
The authors declare no conflict of interest financial or otherwise.
ACKNOWLEDGEMENTS
Declared none.

