All published articles of this journal are available on ScienceDirect.

Near-infrared Spectroscopy for Direct Investigation of Quality Compounds in Capsicum spp (Capsicum annuum L. and Capsicum frutescens L.)
Abstract
Introduction
Capsicum spp., commonly known as peppers or chili peppers, are essential horticultural crops. The unique flavors, pungency levels, and nutritional profiles of these peppers are determined by a complex composition of quality compounds such as antioxidant activity, capsaicin, and dihydrocapsaicin. Assessing and quantifying these compounds is crucial for both agricultural and industrial purposes.
Methods
This research provides fresh insight into the use of near-infrared spectroscopy (NIRS) to investigate quality compounds in Capsicum spp., such as antioxidant activity, capsaicin, and dihydrocapsaicin. The NIRS utilized wavelengths ranging from 702 to 1065 nm with intervals of 3 nm. The total sample size was 400, consisting of 7 varieties of Capsicum spp., including cayenne pepper 'Domba', 'Manik', and 'Ratuni', as well as red chili peppers 'CB2', 'Tanjung 2', 'Lingga', and 'Tanjung'. The sample was divided into a calibration (n=300) and a prediction set (n=100), and then modeling was carried out using statistical software.
Results
Accuracy values for antioxidant activity, capsaicin, and dihydrocapsaicin obtained were Rcal ≤ 0.86, Rpred ≤ 0.79, RMSEC ≤ 28.16, RMSEP ≤ 34.58, and RPD ≤ 1.66.
Conclusion
These findings suggested that NIRS is a rapid and precise method for investigating quality compounds in Capsicum spp., such as antioxidant activity, capsaicin, and dihydrocapsaicin.
1. INTRODUCTION
Capsicum spp. is a group of horticultural crops that are in high demand worldwide due to their taste, appearance, and quality. This group consists of cayenne and red chili peppers that rot quickly after harvest, similar to other horticultural products. The process of spoilage in horticultural products is caused by their high water content. Furthermore, cayenne and red chili peppers have a water content of 80-90% [1] but can be processed into a powder to improve durability. The goal is to reduce the water content, improve durability, and maintain quality. The average water content in chili powder was reported to be around 11% [2] and is used extensively as an additive for food products.
Capsicum spp. has various nutrients and is a source of antioxidants. These antioxidants are very beneficial to human health because they help prevent oxidative stress in the body. Antioxidants are compounds that inhibit oxidation and counteract free radicals by binding to free radical atoms or atoms with unpaired electrons. Cayenne pepper contains antioxidants, such as vitamin C, carotenoids, and capsaicin [3, 4], which can be determined using an antioxidant activity test, such as the 2,2-diphenyl-1-picrylhydrazyl (DPPH) method.
Capsicum spp. has a unique nutritional content that includes capsaicinoid group compounds such as capsaicin and dihydrocapsaicin, which is about 77-98% in chili [5]. Furthermore, capsaicinoid content is determined by the genetic nature of the plant, maturity level, environment, and harvest period. The capsaicin, dihydrocapsaicin, and total capsaicinoid levels in cayenne pepper 'DARL 210' fruit increase from 480 mg/100g to 930 mg/100g, 416 mg/100g to 913 mg/100g, and 896 mg/100g to 1,843 mg/100g, respectively, 30 to 105 days after flowering (DAF) [6]. Another research reported that cayenne pepper 'Kanchanaburi 07' had capsaicin and dihydrocapsaicin levels ranging from 272 mg/100g to 485 mg/100g and 126 mg/100g to 190 mg/100g, respectively [7].
Laboratory analysis of the water content, capsaicin, and dihydrocapsaicin is relatively more complex because it requires time and expertise. This led to the development of quality measurements of optical-based and multivariate agricultural products [8-15]. Optical-based quality measurement includes the use of near-infrared spectroscopy (NIRS) combined with partial least squares regression (PLSR) [16-19]. Furthermore, the benefits of using NIRS include real-time measurements, no special skills required, and the ability to analyze qualitatively and quantitatively [20-22]. This method can also measure multiple desired product qualities using only one calibration model and has been successfully used to predict various agricultural products [23-32]. Research on the development of the NIRS in chili is still being conducted. Aprilia et al. [33] and Rohaeti et al. [34] succeeded in classifying chili at different levels of maturity and variety, while Haughey et al. [35] and Kusumiyati et al. [36, 37] predicted some of the quality content in chili using NIRS. Previous research, however, developed the NIRS model with a limited number of samples and varieties. Developing a model with a larger number of samples and varieties will increase the accuracy. Therefore, an NIRS model on Capsicum spp. with more numbers and varieties is required.
The purpose of this research was to evaluate potential NIRS for direct investigation of quality compounds in Capsicum spp., such as antioxidant activity, capsicum, and dihydrocapsaicin. The model development involves the wet analysis results in the laboratory and the NIRS spectra data. Furthermore, the application of NIRS as a direct investigation of quality compounds in Capsicum spp. enables quality monitoring, sorting, and product grading. The results are expected to contribute to the advancement of NIRS research, particularly in the investigation of Capsicum spp.
2. MATERIALS AND METHODS
2.1. Sample Collection
Powdered samples from various Capsicum spp. varieties, consisting of cayenne pepper 'Domba', 'Ratuni', and 'Manik' as well as red chili pepper 'CB2', 'Tanjung 2', 'Lingga', and 'Tanjung', were used in this research. Each sample was weighed and 30 g was placed in a Petri dish with a 10 cm diameter [36]. A total of 400 samples were used, divided into a calibration (300) and a prediction set (100). Sample analysis was carried out at the Laboratory of Horticulture, Faculty of Agriculture, Universitas Padjadjaran, Indonesia.
2.2. NIR Spectra Analysis
Spectra measurements of each sample were carried out at five different points on the Petri dish, including the top, middle, bottom, right, and left. The average value of the five points was used to obtain the value of each sample. Furthermore, the NirVana AG410 (Integrated Spectronics Pty, Ltd, Australia) NIR spectrometer with a wavelength range of 702 to 1065 nm and 3 nm intervals was used, and the results were in the form of absorbance spectra.
2.3. Sample Extraction
The extraction steps for measuring antioxidant activity, capsaicin, and dihydrocapsaicin were similar. Each powder sample was weighed, and 0.05 g was placed in a 10 ml vial and mixed with 10 ml of methanol before being placed in a sonicator (Ultrasonic Cleaner BK-2000) for 20 minutes at 65°C. The extract was then transferred to a 10 ml volumetric flask, and methanol was added to the limit mark. Centrifugation was then carried out for 10 minutes at 4000 Rpm, and the filtrate was placed in a 10 ml vial for further analysis of antioxidant activity, capsaicin, and dihydrocapsaicin [37].
2.3.1. Antioxidant Activity Analysis
Antioxidant activity was measured using the DPPH method. The extract and the DPPH solution were placed in a 5 ml flask and stored for 30 minutes in a dark room. A UV-Vis spectrophotometer (Shimadzu UV mini-1240, Tokyo, Japan) was used to measure the absorbance value at a wavelength of 517 nm. The inhibition value of DPPH free radicals was calculated based on the percentage inhibition. Furthermore, the 50% inhibition concentration (IC50) value was obtained from the relationship between the percentage inhibition and the solution concentration of each sample. The antioxidant activity level of the sample was expressed in mg/100g.
2.3.2. Capsaicin and Dihydrocapsaicin Measurement
Capsaicin and dihydrocapsaicin measurements were carried out using HPLC (Shimadzu, LC 20AT Prominence, Japan) with a 5 μm C-18 (150x4.6 mm) column. The mobile phase used was acetonitrile and 0.1% orthophosphoric acid in a 60:40 ratio equipped with a UV-Vis detector with a wavelength of 222 nm. The extract was filtered with a 0.45-μm filter and the injection volume was 20 μL, with a column temperature of 30°C. The difference between these two parameters was the standard and the retention time. The capsaicin and dihydrocapsaicin standards were used in the capsaicin and dihydrocapsaicin measurements, respectively. Furthermore, the flow rate used was 1mL/minute, and the capsaicin and dihydrocapsaicin standards were prepared in concentrations of 2, 4, 8, 16, 32, 64, and 128 ppm, and 1, 2, 4, 8, 16, 32, and 64 ppm, respectively. The capsaicin and dihydrocapsaicin levels of the sample were calculated in mg/100g.
2.4. Data Analysis
The NIR spectroscopy data analysis included two main stages, namely preprocessing and multivariate analysis. Preprocessing was applied to reduce the residual noise in the spectra data. The preprocessing methods used were standard normal variate (SNV) and second derivative Savitzky–Golay (d2a). Furthermore, data processing was carried out using the PLSR method. The Unscrambler X 10.4 (Camo Software USA, Oslo, Norway) was used to analyze the data on the calibration and prediction set. Model accuracy was assessed based on the coefficient of correlation in the calibration (Rcal) and prediction set (Rpred), root mean square error of the calibration set (RMSEC), root mean square error of the prediction set (RMSEP), and the ratio of prediction to deviation (RPD).
3. RESULTS AND DISCUSSION
3.1. Quality Compound Results
Fig. (1) shows reference data on seven varieties of Capsicum spp. Based on these data, cayenne pepper 'Manik' has the highest antioxidant activity (2142.82 mg/100g), while red chili pepper 'CB2' has the lowest antioxidant activity (8916.71 mg/100g). The IC50 value is inversely proportional to the antioxidant activity, with a lower IC50 value indicating higher antioxidant activity. The cayenne pepper 'Manik' has the highest capsaicin and dihydrocapsaicin content, followed by 'Domba' and 'Ratuni'. Furthermore, the capsaicin content in this study is higher than the dihydrocapsaicin content. About 80-90% of the capsaicinoid group consists of capsaicin and dihydrocapsaicin, with the capsaicin content and the ratio between the two compounds being ±69% and 1:1 or 2:1, respectively [38, 39]. These compounds are also abundant in varieties with high antioxidant activity. This is consistent with previous research on the antioxidant activity of chili pepper and its relationship with capsaicin and dihydrocapsaicin content [40].
Table 1 shows that the antioxidant activity, capsaicin, and dihydrocapsaicin values range from 194.86 mg/100g to 13137.23 mg/100g, 12.46 mg/100g to 1378.28 mg/100g, and 7.15 mg/100g to 355.54 mg/100g, respectively. Data variation increases the reliability of a model, and the diversity of samples in a dataset is observed from the minimum and maximum values. Furthermore, the standard deviation can be used to describe the data variation. The standard deviation for antioxidant activity, capsaicin, and dihydrocapsaicin is 2965.15 mg/100g, 309.24 mg/100g, and 99.54 mg/100g, respectively.
3.2. Prediction Model of Quality Compounds
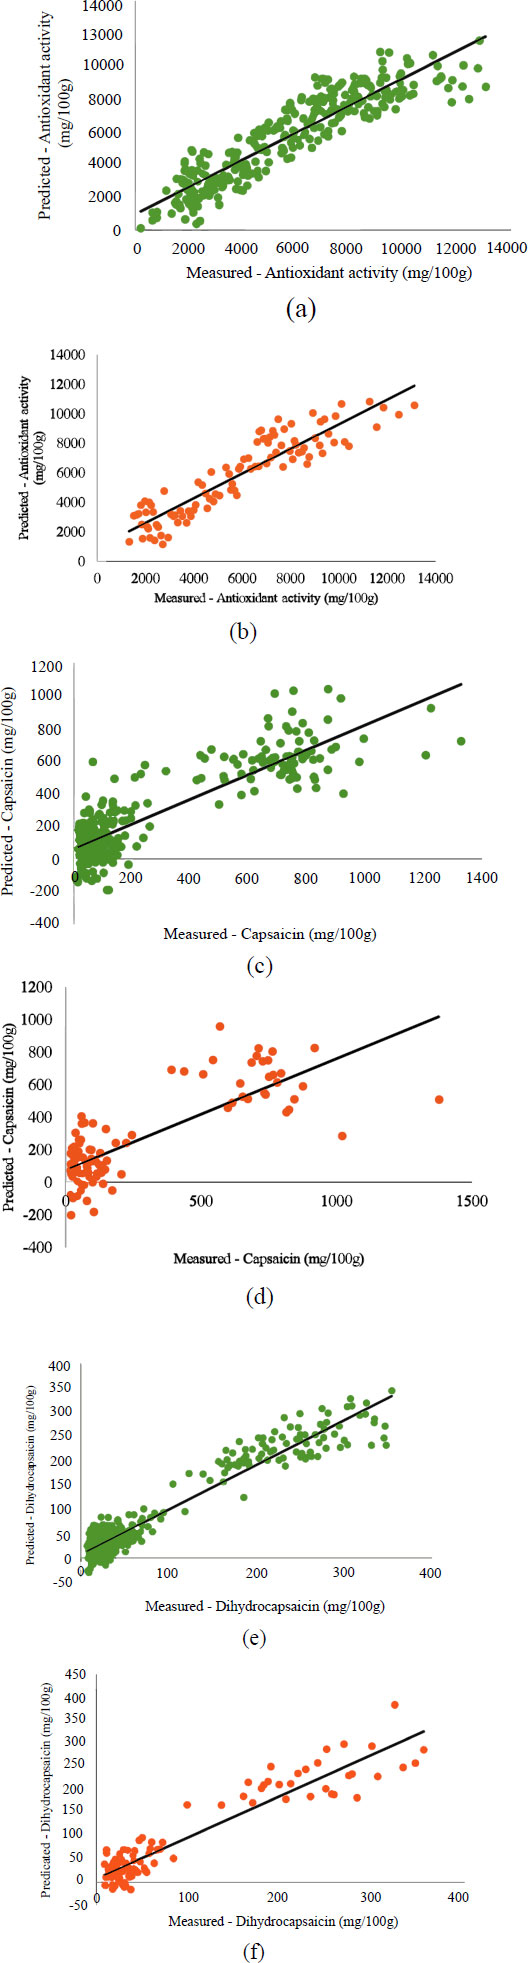
Calibration models of various Capsicum varieties allow faster direct investigation of quality compounds. The calibration models for multiple varieties will be more efficient than models for individual varieties. Table 2 shows that the antioxidant activity with original spectra data produced the best accuracy with Rcal, RMSEC, Rpred, and RMSEP of 0.91, 1214.34, 0.91, and 1176.48, respectively. In capsaicin, the calibration model with d2a spectra produced the best results with Rcal and RMSEC of 0.86 and 151.22, respectively. Meanwhile, the prediction set for different or unknown samples produced an accuracy of Rpred and RMSEP with 0.79 and 190.76, respectively. The best model for dihydrocapsaicin is generated from the original spectra data with Rcal, RMSEC, Rpred, and RMSEP of 0.95, 28.16, 0.93, and 34.58, respectively.
| Quality Compounds | Min | Max | Mean | SD |
|---|---|---|---|---|
| Antioxidant activity (mg/100g) | 194.86 | 13137.23 | 5769.37 | 2965.15 |
| Capsaicin (mg/100g) | 12.46 | 1378.28 | 262.36 | 309.24 |
| Dihydrocapsaicin (mg/100g) | 7.15 | 355.54 | 91.70 | 99.54 |
| Quality Compounds | Spectra Pre-treatment | Rcal | RMSEC | Rpred | RMSEP | RPD |
|---|---|---|---|---|---|---|
| Antioxidant activity | Original | 0.91 | 1214.34 | 0.91 | 1176.48 | 2.53 |
| SNV | 0.87 | 1422.36 | 0.90 | 1311.55 | 2.27 | |
| d2a | 0.84 | 1583.19 | 0.84 | 1573.16 | 1.89 | |
| Capsaicin | Original | 0.87 | 145.87 | 0.78 | 195.93 | 1.61 |
| SNV | 0.89 | 138.98 | 0.76 | 211.09 | 1.50 | |
| d2a | 0.86 | 151.22 | 0.79 | 190.76 | 1.66 | |
| Dihydrocapsaicin | Original | 0.95 | 28.16 | 0.93 | 34.58 | 2.92 |
| SNV | 0.93 | 34.14 | 0.93 | 36.60 | 2.76 | |
| d2a | 0.93 | 34.52 | 0.891 | 45.70 | 2.21 |
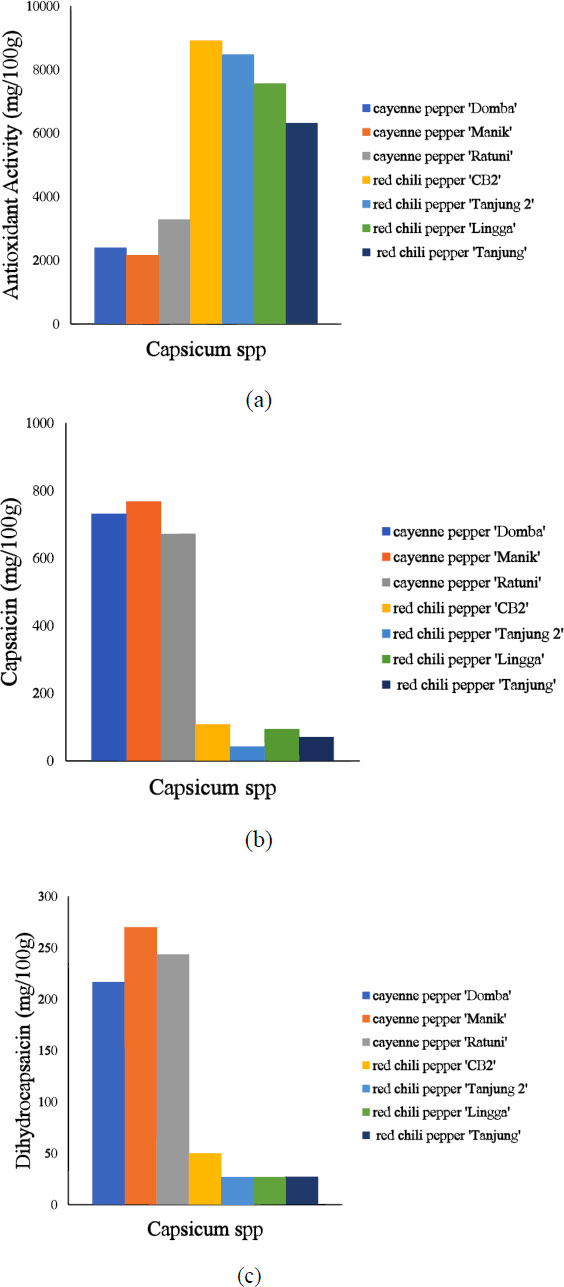
Fig. (2) shows the correlation between reference data from quality compounds and NIRS predictions. The RPD values for antioxidant activity, capsaicin, and dihydrocapsaicin are 2.53, 1.66, and 2.92, respectively. The closer the data distribution is to the regression line, the more accurate the model is. Furthermore, Rcal/Rpred approaching 1 and RMSEC/RMSEP approaching 0 indicates a strong correlation between spectroscopic predictions and reference data [41, 42]. RPD values below 1.5 show poor prediction and discrepancy, while values between 1.5 and 2 suggest that the model can distinguish between low and high response variables. Additionally, an RPD value between 2 and 2.5 implies the possibility of making imprecise quantitative predictions, while a value between 2.5 and 3 or more indicates good to excellent prediction accuracy [32, 43].
CONCLUSION
The use of NIRS for a direct investigation of quality compounds, such as antioxidant activity, capsaicin, and dihydrocapsaicin in Capsicum spp. yielded satisfactory results. High Rcal, Rpred, and RPD values were obtained for each quality compound, including antioxidant activity (0.91, 0.91, and 2.53), capsaicin (0.86, 0.79, and 1.66), and dihydrocapsaicin (0.95, 0.93, and 2.92). Based on the modeling development results, the model was categorized as accurate and had a high potential to be used in quantitatively assessing antioxidant activity, capsaicin, and dihydrocapsaicin in Capsicum spp.
AUTHORS' CONTRIBUTIONS
All the authors participated in the study design, practical work, and writing the manuscript and approved the final manuscript.
CONSENT FOR PUBLICATION
Not applicable.
AVAILABILITY OF DATA AND MATERIALS
The data presented in this study are available on request from the corresponding author [K.K].
FUNDING
None.
CONFLICT OF INTEREST
The authors declare no conflict of interest, financial or otherwise.
ACKNOWLEDGEMENTS
The authors are grateful to Ine Elisa Putri, and Yuda Hadiwijaya for their support, assistance, and chemical acquisition for the research.

