All published articles of this journal are available on ScienceDirect.

Effects of Different Water Managements on Grain Yield and Grain Quality in Ratoon Rice Cultivation
Abstract
Background:
Ratoon rice production is one of the rice cultivation technologies with the potential to reduce labor and increase yield rate under a shorter cultivation time. However, few studies have focused on the effects of different water management on grain yield and quality.
Objective:
The aim of this study was to explore the effects of different water management on grain yield and quality in ratoon rice.
Methods:
Three water management treatments were followed- Control with the water level 5 cm aboveground, underground water treatment (UWT) with the water level 12 cm below the soil surface, and deep water treatment (DWT) with the water level 20 cm aboveground. The grain yield, yield components, amylose and protein content, and grain characteristics for grain quality were measured.
Results:
During the ratoon season, UWT had the highest grain yield of the three treatments. DWT had the highest ratoon tiller number but had a lower grain yield due to the increase in the number of ratoon tillers. The 1000-grain weight decreased markedly for DWT. With respect to grain quality, ratoon rice has a higher amylose content and a lower protein content than the main crop rice. UWT had the lowest protein content in the ratoon period and a higher grain yield.
Conclusion:
Yield performance in UWT is considered optimal for ratoon rice cultivation. However, grain quality under different water management did not show remarkable results. Therefore, the practice of fertilization during cultivation is recommended to improve grain quality.
1. INTRODUCTION
Rice (Oryza sativa L.) is a major staple crop of Asia with 90% of the world’s rice production and consumption [1, 2]. It is estimated that global rice production needs to be increased by 116 million tons by 2035 to meet the rising demand for rice [3]. To meet the production demands, better strategies to increase the sustainability of rice cropping systems are needed. One of the strategies is ratoon rice production [4-9], which refers to the cultivation of rice from the tillers originating from the stubble left behind after the harvest of the main crop to yield the second harvest of rice. Ratoon rice is a viable alternative to double-season rice [10]. The benefits of ratoon rice cultivation are that it reduces the requirement of labor [11-15], seed [16-18], and water, and shortens the cultivation period [19-21], compared to double-season rice. Previous studies have reported that ratoon rice yield is roughly 40% – 60% of the main crop [22-25], but it reduces the labor and water input by 50% – 70% [26]. The reduction of cultivation costs is profitable for farmers. As ratoon rice cultivation has a shorter growth duration compared to double-season rice, it is suitable for a region where the annual cumulative temperature is considerably higher than that required for single-cropping rice, but is extremely low for double-season rice [27]. However, ratoon rice cultivation cannot produce 100% of main crop rice yield, grain yield and grain quality are also low [11, 28]. In Japan, grain quality is measured by the amount of amylose and protein present in the grain [29]. A low amylose content [30-32] and a low protein content [33-36] contribute to better grain quality and increase the palatability of rice. Grain thickness has also been known to influence the palatability of rice [37, 38]. Previous studies have reported that ratoon rice has a higher amylose content [39, 40] and a lower protein content [8] than main-crop rice.
Rice cultivation systems depend heavily on water resources and their management [41], as different regions have different water availability and management techniques. The grain yield of ratoon rice cultivation is primarily affected by water management, fertilizer application, and tiller height [11]. From previous studies, rice grain yield has been directly correlated to the amount of irrigation water provided [42]. However, water management differs across places. In Japan (e.g., in Kagoshima), generally during peak summer, the irrigation water is stopped to prevent water shortage in other sectors [43-46], and rice cultivation has to rely on rainwater. This low water availability is similar to a rainfed environment. In South and Southeast Asia, where people depend upon rainfed lowlands for their livelihood, deep water treatment is one of the ways to maintain water productivity and sustainability [47]. Deep water practices in Japan are also used to mitigate the damage induced by cool summers, control tiller growth, and control weeds [48, 49]. However, most of the studies regarding water management are conducted on single-season rice. There have been few studies on the effects of water management, both low and deep water, on ratoon grain yield and quality.
Therefore, in this study, we aimed to evaluate the effects of different water management on ratoon rice grain yield and its quality. To evaluate ratoon rice grain yield, we used the 15N isotope-traced fertilizer to measure the effects of different water management on the rate and amount of nitrogen uptake from the soil. This isotopic study method is commonly used to determine N utilization from the fertilizer by plants. By understanding the mechanisms underlying the transport of 15N to various parts of the plant, we evaluated how different water management could possibly influence the transport inside the rice plants.
2. MATERIALS AND METHODS
2.1. Experimental Site and Plant Material
The experiment was conducted from March–October 2021, in an open-air steel frame building covered in wire netting to protect the plants from birds, at the School of Agriculture, Meiji University, Kawasaki, Kanagawa, Japan (35°61′N, 139°54′E). We used Akitakomachi rice in this study, as it is one of the early maturing varieties in Japan, thus suitable for ratooning.
2.2. Experiment Setup
The seeds were sown on March 11, 2021, and transplanted on April 14, 2021, into a 1/5000-a Wagner pot with three seedlings per pot, all filled with 3.5 kg of artificial culture soil. NPK (6 g/m2 each) was applied as basal fertilizer, and N (3 g/m2) was applied 50 days after transplanting. These pots were installed in a concrete container (3 m long × 3 m wide × 0.3 m deep) filled with water and left flooded throughout the main crop’s cultivation period. The water management for the main crop was the same as that for the control across all plots, with the water level maintained at 5 cm aboveground. Once the saplings matured, the cutting height for ratooning was set at 30 cm, and 5% 15N2 Ammonium Sulfate (3 g/m2) (Cambridge Isotope Laboratories, Inc.) was applied to the main crop. The experiment plot for ratoon cropping was divided into three treatments control treatment (CT), underground water treatment (UWT), and deep water treatment (DWT). Sixteen pots were used per treatment, 48 pots in total. These water management were conducted only after the first harvest, during the ratooning season. In CT, the water level was always maintained at 5 cm aboveground. In UWT, the water level was maintained at 12 cm below the soil surface. In DWT, the cultivation pots were placed inside a 50 cm deep pool and the water level was maintained at 20 cm aboveground. Water management during the main crop season was the same as CT for all the pots. With the onset of the ratoon season, the main crop was harvested and these three water managements were implemented.
2.3. Data Sampling
2.3.1. Air and Water Temperature
Air temperature was measured with a thermometer (TR-52i; T&D Corp., Matsumoto, Japan) at 1.2 m aboveground. Water temperature was measured with the same thermometer, which was wrapped in a waterproof case and kept underwater throughout the cultivation period. The input data of the average temperature were from the data collected by the Japan Meteorological Agency based in the Fuchu Observatory, during the cultivation period (April–November 2021).
2.3.2. Plant Growth Characteristics
During the main crop season, different growth parameter data were collected. The plant height, tiller number, and leaf chlorophyll index (SPAD value measured using SPAD-502 Plus, Konica Minolta, Inc.) were measured for six pots per treatment, at 50 days after sowing, and during harvest for both, the main crop and the ratoon season. In addition, during the ratoon season, starting a week after the harvest of the main crop, the newly formed ratoon tiller numbers were counted once a week, until the ratoon harvest.
2.3.3. Biomass, Yield and Yield Components
For the data of the main crop and ratoon crop’s yield and yield components, we used two and four pots, respectively. Plant components were divided into panicles, leaves, stems, and withered parts. The grains in the panicles were separated from the panicle stem, buoyancy was used to separate the empty grains from the filled grains, and these three factions were then weighed. All components were dried in an oven for 72 h at 80 °C. The dried components were then weighed to calculate the aboveground biomass weight. These data were then used to quantify the number of panicles per pot, number of spikelets, percentage of ripened grains, 1000-grain weight, aboveground biomass, and grain yield.
2.3.4. Regrowth Rate and Yield Rate
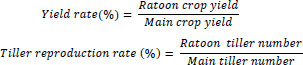
For the main crop season, the regrowth and yield rates were set to 100%. In the following regrowth season, the regrowth and yield rates were measured during the ratoon crop’s harvest season. These rates were calculated using the following formula:
2.3.5. 15N Content
To understand how and where the N content was transported to in rice plants, Ammonium Sulfate containing 5% 15N was used instead of the ordinary nitrogen fertilizer. The study was divided into two stages- the heading period and the harvest period of the ratoon crop. During the heading period, four pots from each treatment group were taken and disassembled into the main tiller, stem, leaf, and panicle. The harvest period samples consisted of the same parts, with the addition of the withered parts. All parts were oven-dried for 72 h at 80 °C and then powdered in a crusher (Wonder Blender DM-6; Osaka Chemical Co. Ltd.). The powdered parts were then wrapped in aluminum foil and inserted into an organic elemental analyzer (Vario MICRO CUBE; Elementar Japan Inc.) to calculate the increase rate and the amount of stable isotope 15N inside each part of the plant in the four replications. The 15N increase rate indicates the increase in 15N, compared to its nitrogen content.
2.3.6. Grain Quality
To test the grain quality, all the remaining grains were collected from 14 pots during the main crop season, and the remaining tiller was used for ratooning. For the ratoon crop, the grains were collected from six pots. Amylose content, protein content, and grain characteristics were measured. Collected grains were first used as brown rice to measure grain characteristics (grain length, width, and thickness) with a grain scanner (RGQI 10B; Satake Co. Ltd.), and the measurements were replicated thrice. The rice grains were then polished with a grain polisher (Pearlest; Kett Electric Laboratory) for 40 s and tested using a grain screening apparatus (1.8 mm aperture). Milled full grains were then crushed (using a Wonder Crusher WC-3; Osaka Chemical Co., Ltd.) until it was powdered. Powdered milled rice grains were then used to measure the amylose content, with three replications per pot, using the iodine colorimetric method [50]. To calculate the amount of protein, the crushed grains were wrapped in aluminum foil and inserted into the organic elemental analyzer (Vario MICRO CUBE; Elementar Japan Inc.).
2.3.7. Statistical Analysis
Data were analyzed using the statistical software SPSS (IBM). The comparison of treatments was calculated using Tukey’s honestly significant difference test (HSD) at a significance level of 5%. Correlations of data were calculated using t-tests at significance levels of 5%, 1%, and 0.1%.
3. RESULTS
3.1. Weather Conditions and Chronology of Growth Stages for the Main and Ratoon Crops
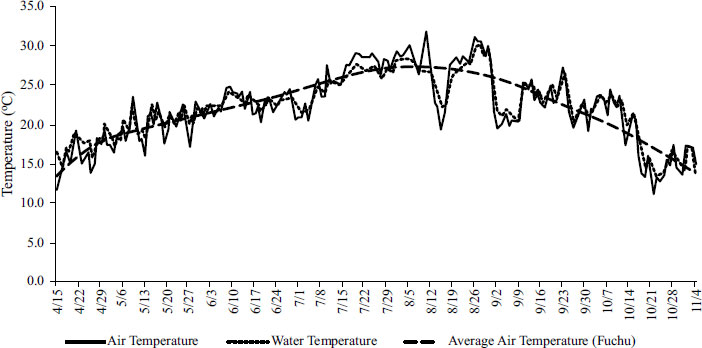
The air and water temperature values are shown in Fig. (1). The weather condition of the growing season in 2021 and the past 30 years (Average for 1991-2020) was similar (data not shown). Before the harvest of the main crop, there was a sudden decline in temperature during early August 2021. The chronology of sowing, transplanting, heading, ripening, and harvesting as well as the accumulated temperature and average temperature during heading are given in Table 1. The heading date for the ratoon crop differs throughout the three treatment groups, as the heading in DWT was the earliest and CT was the last. The accumulated temperature across the three treatments, from heading to ripening, shows that DWT was the highest at 474.9 °C, UWT was the second at 454.5 °C and CT was the lowest at 449 °C. The average temperature during the ripening period also differs for each treatment— 16, 21, and 20.8 °C for CT, UWT, and DWT, respectively.
3.2. Aboveground Biomass, Yield, and Yield Components
The aboveground biomass, grain yield, and yield components for the three treatments are given in Table 2. In comparison to the main crop season’s data, the ratoon crop’s spikelet number and aboveground biomass were lower. Out of the three water treatments, UWT had a higher grain yield at 17.87 g pot-1 than the other two, which had similar yields. Although the data showed no significant difference, there were some striking trends within the data for each component. The number of spikelets, percentage of ripened grains, 1000-grain weight, and aboveground biomass had the highest values in UWT, at 36, 88, 21.26 g, and 44.71 g pot-1, respectively; while the number of panicles was the highest in DWT, at 31. Furthermore, during the ratoon crop season, the spikelet number differed significantly between UWT, at 36, and both CT and DWT, at 25. 1000-grain weight values were also significantly different between UWT, at 21.26 g, and DWT, at 19.71g. UWT had the highest yield rate, followed by CT and DWT, which had similar rates.
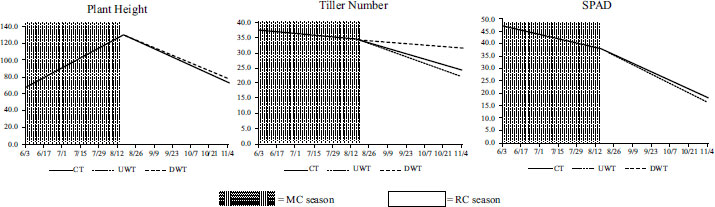
3.3. Ratoon Rice Plant Growth Developments
Data on plant heights, tiller numbers, and SPAD values for the three water treatments are shown in Fig. (2). For plant heights and SPAD values, no significant difference was observed across the three treatments. However, the ratoon tiller number showed differences across the treatments, with DWT having the highest and UWT having the lowest values. The change in tiller numbers was also observed once a week during the ratoon season (Fig. 3). The results show that starting a week after the first harvest, the initial tiller numbers were greater for DWT than for the other two. Table 3 shows that the tiller reproduction rate was the highest for DWT at 92.2%, and the lowest for UWT at 65%, consistent with the tiller growth data.
| - | Water Management | Sowing | Transplanting | Heading | Ripening | Harvest | Accumulated Temp. (ºC) | Average Temp. on Ripening (ºC) |
|---|---|---|---|---|---|---|---|---|
| Main Crop | - | 15-Mar-21 | 14-Apr-21 | 12-Jul-21 | 22-Jul-21 | 16-Aug-21 | 581.3 | 27.7 |
| Ratoon Crop | CT | - | - | 27-Sep-21 | 17-Oct-21 | 4-Nov-21 | 449.8 | 16.0 |
| - | UWT | - | - | 25-Sep-21 | 15-Oct-21 | - | 454.5 | 21.0 |
| - | DWT | - | - | 22-Sep-21 | 12-Oct-21 | - | 474.9 | 20.8 |
| - | Water Management | Aboveground Biomass (g/pot) | No. of Panicles (panicles/pot) | No. of Spikelets | % of Ripened grains | 1000 Grain Weight (g) | Grain Yield (g/pot) | Yield Rate (%) |
|---|---|---|---|---|---|---|---|---|
| Main Crop | - | 71.75 | 31 | 60 | 79 | 18.36 | 27.55 | 100% |
| Ratoon Crop | CT | 33.24 a | 27 a | 25 a | 87 a | 20.76 ab | 12.60 a | 45.75% |
| - | UWT | 44.71 a | 27 a | 36 b | 88 a | 21.26 b | 17.87 a | 64.89% |
| - | DWT | 39.74 a | 31 a | 25 a | 84 a | 19.71 a | 12.63 a | 45.85% |
| Water Management (RC) | Tiller Number (plant-1) | Tiller reproduction rate (%) | |
|---|---|---|---|
| MC | RC | ||
| CT | 34 | 24 | 70.9% |
| UWT | 22 | 65.0% | |
| DWT | 32 | 92.2% | |
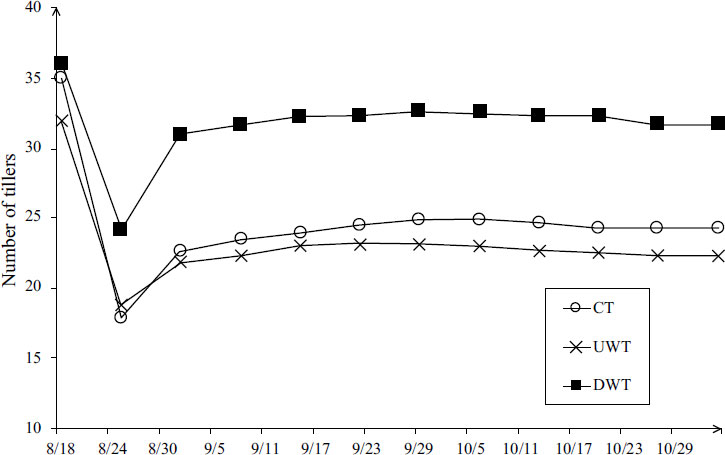
All data show newly emerged ratoon tillers except on August 18, which shows the initial tiller number.
3.4. Distribution of 15N Content in each Treatment
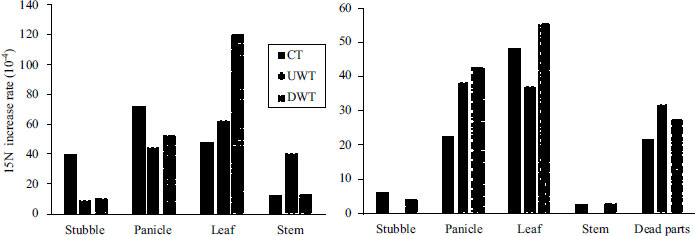
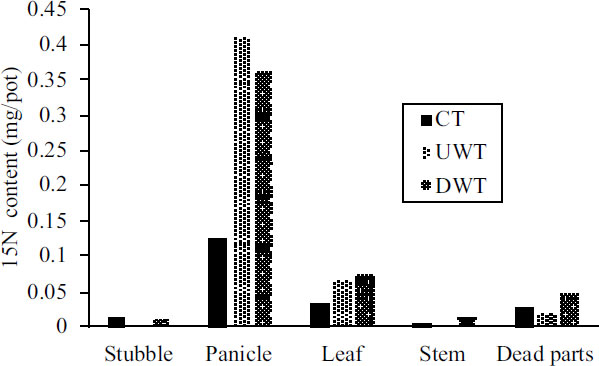
The rate of increase in 15N during heading and harvest is shown in Fig. (4). The 15N increase rate during heading was higher in the panicles and leaves, with DWT showing the highest for leaves. The 15N increase rate during harvest was also higher in the panicles and leaves, and lower in the stubble and stems. However, the values for the 15N content in the plants during harvest Fig. (5) show that most of the 15N was contained in the panicles, with lesser amounts in the leaves. Although the higher 15N increase rates were mostly seen in DWT, the amount of 15N in the panicles was the highest in UWT.
3.5. Grain Characteristics in Brown Rice and Grain Quality in Milled Rice
The grain quality (amylose and protein content) of milled rice from the main and ratoon crop and the grain characteristics of brown rice are given in Table 4. Apart from grain thickness, none of the other characteristics showed significant differences across the three water treatments. Grain thickness in UWT was the highest, at 1.94 mm. Grain size in DWT showed a decreasing trend compared to the other two treatments. The degree of whiteness of all the ratoon crop grains was also higher than that of the main crop. The amylose content of the grains in the three water managements did not show any significant difference, but UWT and DWT had higher values than the main crop, at 15.96% and 16.40%, respectively. The protein content also did not show any significant difference, but all three managements in the ratoon crop season led to lower protein content compared to the main crop.
3.6. Correlations between Yield Components, Grain Yield and Ratoon Tiller Numbers
The correlations between grain yield and yield components, and between ratoon tiller numbers and yield components are shown in Table 5. All of the data for grain yield and yield components showed positive correlations. Except for the number of panicles, the correlations between the yield components and grain yield were significantly different from the correlations between the yield components and ratoon tiller numbers. Correlations between ratoon tiller numbers and yield components were also significant, with the exception of aboveground biomass. With the exception of the number of panicles, all the components showed negative correlations.
3.7. Correlations between Air Temperature and Grain Quality
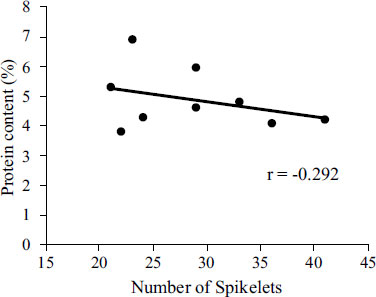
The correlations between accumulated temperature and grain thickness with respect to amylose and protein content across the three treatments are given in Table 6 and the correlation between protein content and number of spikelets is shown in Fig. (6). The accumulated temperature, measured from heading to ripening and harvest, showed a significantly positive correlation with amylose content and a negative correlation with protein content. Grain thickness showed a negative correlation with both amylose and protein content.
| - | Water Management | Amylose Content (%) | Protein Content (%) | Grain length (mm) | Grain width (mm) | Grain thickness (mm) | Degree of whiteness (%) |
|---|---|---|---|---|---|---|---|
| Main Crop | - | 14.76 | 7.50 | 4.92 | 2.62 | 1.92 | 16.72 |
| Ratoon Crop | CT | 14.13 a | 5.56 a | 5.10 b | 2.68 b | 1.93 b | 19.12 a |
| - | UWT | 15.96 a | 4.35 a | 4.99 a | 2.67 b | 1.94 c | 19.56 b |
| - | DWT | 16.40 a | 4.73 a | 4.93 a | 2.61 a | 1.91 a | 19.63 b |
| - | Aboveground Biomass | No. of Panicles Per Pot | No. of Spikelets | % of Ripened Grains | 1000 Grain Weight | Grain Yield |
|---|---|---|---|---|---|---|
| Grain yield | 0.875 *** | 0.231 | 0.791 *** | 0.680 ** | 0.771 ** | - |
| Ratoon tiller number | -0.270 | 0.240 * | -0.527 * | -0.533 * | -0.850 *** | -0.592 * |
| - | - | Amylose content | Protein content |
|---|---|---|---|
| AT from heading to ripening | 0.562 * | -0.199 | |
| Grain thickness | -0.064 | -0.292 | |
4. DISCUSSION
4.1. Effect of Different Water Managements on Ratoon Grain Yield
In this study, the correlations between grain yield and the yield components were all positive, with the number of spikelets showing 0.1% significance (Table 5). This indicates that to optimize grain yield, it is important to increase the number of spikelets. The number of spikelets in UWT was significantly higher than in both CT and DWT (Table 3). This shows that UWT had the optimal conditions for spikelet formation. The grain yield of the ratoon crop was 45%–65% of the main crop, showing similar results to a previous study conducted by Sen et al. in 2017 [16], which yielded 64.6%. Other studies have shown that ratoon crops can yield only 40%–60% of the main crop yield [5, 51], which indicates that our study results show a similar trend, except for UWT, which attained a yield rate of approximately 65%. UWT had the highest grain yield even though it had the least ratoon tiller number. This trend is consistent with previous studies on single rice cropping, which state that tiller production under water stress decreases tiller numbers [52, 53] and maintains rice yields [54, 55]. In contrast, even though DWT had the highest tiller reproduction rate (Tables 1, 3), the grain yield had proven to be similar to CT (Table 2). The tiller number during the ratoon rice season also shows that DWT is firmly above CT and UWT, despite the similar initial tiller numbers at the beginning of ratoon cultivation on August 18 (Fig. 3). It is possible that during the ratoon season, due to the photosynthetic products and nutrients in DWT being allocated mainly to tiller formation, the number of spikelets and the grain weight decreased below those of UWT, despite DWT rice plants having a greater number of panicles. Thus, the weight of aboveground biomass also decreased due to lower grain weight overall. This is also followed by the 15N tracking results, where during heading, the increase rate of 15N in the leaves was found to be substantially higher in DWT (Fig. 4). During harvest, the increase rate in 15N in the panicles and leaves was also high in DWT (Fig. 4). Both these trends show similar results as the study conducted in single cropping rice under deep water [56]. However, a previous study [57] reported that deep water management can improve leaf color (SPAD value), which was not seen in this study where SPAD value did not show any significant difference across the three treatments (Fig. 2). Furthermore, the increase rate in 15N does not have a significant influence on panicle formation, leading to a lower yield in DWT than that in UWT due to less weight in each panicle. The tiller reproduction rate in DWT during the ratoon season also shows different results compared to previous studies, in which deep water treatment inhibits tiller production [58-62]. Deep water management can inhibit tiller growth [63-65] in double-season rice; however, this study, showed opposite trends in ratoon rice. This could suggest that nutrients may not be transported to deep water during the ratooning period. However, even though the tiller formation under low water conditions was lower than that in DWT, the nutrient transport efficiency is thought to be higher. Therefore, it is assumed that the nitrogen in DWT is used more for the enhancement of the source, with less follow-up from the sink. Thus, the amount of nitrogen for grain formation is not distributed efficiently. As in UWT, low water conditions are reported to enhance root and shoot growth [66, 67], which may have influenced higher yield. There may also be the influence of non-structural carbohydrates inside the base tiller [68]. This indicates that of the three water managements, UWT has a better efficiency than DWT.
4.2. Effect of Different Water Managements on Ratoon Grain Quality
The difference between the amylose content of the grains from the main crop and all three water managements for the ratoon crop are not significant (Table 4). This result is similar to the previous study [69], where water management did not show a significant impact on grain quality. However, except for CT, ratoon crop rice had a higher amylose content than the main crop rice (Table 4). In Japan, the main crop season is in the summer and the ratoon crop season is in the fall. Therefore, this increase in amylose content in the ratoon season can be associated with the difference in the grain-filling temperatures during the main season and the ratoon season [70]. Although there are some minor differences in temperature throughout the three water management (Table 1), the present study shows similar patterns as previous studies, that higher temperatures during grain filling may contribute to lower amylose content in the main crop rice [71]. These results also agree with previous studies which report that ratoon rice has a higher amylose content than the main crop rice [39, 40]. The main crop rice also has a higher protein content than ratoon crop rice (Table 3). This is also associated with the higher grain-filling temperature right before ripening, which contributes to an increase in the protein content [72, 73]. However, there are very small differences in amylose and protein content across the three water managements (Table 4). DWT has the highest amylose content (16.40%), whereas UWT has the lowest protein content (4.35%). Moreover, the amylose and protein content across the three water managements show different trends compared to previous studies [71]. This indicates that water management may have some impact on the grain-filling mechanisms in ratoon rice. In UWT, the number of spikelets is the highest (Table 1), but from its negative correlation with protein content (Fig. 6), it is possible that the lower protein content is caused by the increase in the number of spikelets. Grain thickness shows a significant difference across the three water managements (Table 4), with UWT having the highest. Grain thickness shows a negative correlation with protein content (Table 6), which is consistent with previous studies [74, 75]. The degree of whiteness of the grains in both UWT and DWT is also markedly higher than CT in ratoon rice. Due to the higher amylose content in ratoon rice, the grain palatability is not favorable. However, of the three water managements in ratoon rice, UWT has the lowest protein content, which suggests that UWT may have better grain palatability compared to the other two.
CONCLUSION
Our results showed that out of the three water managements, UWT has the optimal yield for ratoon rice cultivation, as the distribution of nitrogen is balanced well from source and sink. For further understanding of the effects of water management on the yield in ratoon rice, studies on root and shoot growth and non-structural carbohydrates under different water managements are required. However, the grain quality did not show favorable results under different water managements. Therefore, in order to control the amylose and protein content, fertilization during cultivation can be considered to improve the grain quality.
ABBREVIATION
| DWT | = Deep Water Treatment |
CONSENT FOR PUBLICATION
Not applicable.
AVAILABILITY OF DATA AND MATERIALS
All the data and supporting information are provided within the article.
FUNDING
This work was supported by JSPS KAKENHI Grant Number 19K06006.
CONFLICT OF INTEREST
The authors declare no conflict of interest financial or otherwise.
ACKNOWLEDGEMENTS
Declared none.

