All published articles of this journal are available on ScienceDirect.

Effects of Fertigation Treatment Using a Subsurface Drip System on Spring Potato (Solanum Tuberosum L.) Growth and Yield
Abstract
Background:
In potato, irrigation and fertilization significantly affect yield. Subsurface drip irrigation and fertigation system are very effective in supplying water and fertilizers directly to crop root zones.
Objective:
This study was conducted to investigate the effect of fertigation treatment according to fertilizer concentration and composition on spring potato growth and yield using a subsurface drip system.
Methods:
Fertilizers containing nitrogen, phosphoric acid, and potassium were applied at various concentrations and fertilizer compositions during the tuber initiation and filling stages to determine the appropriate fertilizer concentration. And then, the selected EC 1.0 (NK) and K single-use treatments (K 20, K 50, and K 70 kg, ha-1) were used for fertigation treatment with a subsurface drip system.
Results:
The nutrient uptake by fertilizer concentration results for spring potato cultivation confirmed that nutrient absorption was best at EC 1.0. Accordingly, based on EC 1.0, the nutrient uptake rate by fertilizer composition (EC 1.0; NPK, NK, K) was the best in the NK and K treatments. The application of K 50 (50 kg ha-1) for subsurface fertigation had the highest yield, with an approximately 61% increase over the control treatment and a 19% increase over the irrigation treatment.
Conclusion:
Fertigation treatment using the surface drip system at the tuber initiation and filling stages will contribute to the stable production and improvement of potato productivity by increasing the efficiency of water and fertilization.
1. INTRODUCTION
Recent abnormal weather caused by climate change has had a significant impact on agriculture, and it has caused a variety of losses through drought, cold, and flood damages. Climate change is predicted to decrease grain yield by 4-10%, potato yield by 2-26%, and bean yield by 35-61% due to droughts, cold damage, and the flooding of field crops [1-4]. In Korea, potato is grown in the spring and autumn, and drought has a direct impact on yield, particularly during the spring cultivation period [5, 6]. Yield due to drought showed a decrease of 6.7-10.2% compared to the normal season and is expected to decrease gradually based on climate change prediction scenarios [7]. Most farmers still rely on natural rainfall during the potato cultivation period. However, some farmers use artificial irrigation methods such as a ridge, dripper, and sprinklers to improve growth and yield.
Subsurface drip systems have generally been used for protected horticultural crops such as tomato and melon, but they are now being used in field crops as well. In comparison to conventional irrigation methods, subsurface drip systems can be installed once and used semi-permanently. The irrigation equipment does not need to be removed after crop cultivation, and these systems are very effective technology, supplying water and fertilizers directly to the crop root zones [8]. Additionally, subsurface irrigation increases yield due to higher water utilization efficiency than conventional ridge irrigation [9, 10]. Furthermore, supplementing the water and fertilizer supply using subsurface drip systems increases the yield of field crops such as corn, soybean, garlic, and onion [11-13].
Fertilization, as well as irrigation, has a significant impact on potato growth. Nitrogen fertilization promotes stem elongation and increases the chlorophyll content and photosynthesis, all of which increase potato yield [14, 15]. At the proper rate, phosphoric acid fertilization promotes potato canopy formation, root cell division, tuber formation, and starch synthesis [16]. Potassium increases fruit size and is involved in overall crop growth and stem thickness growth [17, 18].
The timing of fertilizer application is also important in potato growth, and nutrient and moisture management during tuber initiation and tuber filling is known to affect yield [19]. According to previous studies, nitrogen supply during the tuber initiation stage increases yield by promoting the development of the aboveground parts of potato, and phosphorus–potassium supply during the tuber initiation and tuber filling stages promotes material flow and starch synthesis to increase potato yield [20]. The standard fertilizer amount required for spring potato cultivation is 120 kg ha-1 of nitrogen, 88 kg ha-1 of phosphoric acid, and 130 kg ha-1 of potassium, all of which are applied as basal fertilizer. However, problems arise when excess fertilizer application beyond the standard amount is customarily applied. In most potato farming systems, all fertilizer is applied as basal fertilizer before sowing, resulting in a low utilization efficiency of nitrogen, phosphorus, and potassium, which are essential macronutrients for crop growth [21]. The utilization efficiency of nitrogen during potato cultivation is 20-40% [22] that of phosphoric acid is 0-30% [23], that of potassium is 10–19% [21, 24] and residual nutrients are discharged into rivers and streams [22, 25]. Li et al. [26] reported that a single application of potassium fertilizer can increase potato yield by more than 90–100%, and fertilizer composition is also reported to have a significant effect on yield. In the case of the subsurface drip systems, fertigation applied belowground rises to the surface by capillary action, and excessive fertilizer application has many adverse effects on the environment. Therefore, to prevent excessive nutrient supply during fertilizer application, research on the fertilizer composition is also necessary.
This study was conducted to select the optimal fertilizer concentration and composition for spring potato cultivation and then to investigate growth and yield characteristics under the selected fertilizer concentration and composition when a subsurface drip system is used.
2. MATERIALS AND METHODS
2.1. Determination of the Optimal Fertilizer Concentration and Composition for the Subsurface Drip System
A pot cultivation experiment was carried out to determine the best fertilizer concentration and composition for application in the subsurface drip system. In 2021, an experiment was conducted to determine the optimal fertilizer concentration, and in 2022, an experiment was conducted to determine the optimal fertilizer composition. The optimal fertilizer concentration selected in the 2021 experiment was electrical conductivity (EC) 1.0 dS m-1 (NK), which produced good results. As a result, in 2022, both a pot experiment and a subsurface fertigation experiment were carried out simultaneously. The soil of the pot experiment was the same soil that was used in the field irrigated by the subsurface drip system (Tables 1 and 2). The soil was mixed with basal fertilizer (fertilizer amount converted to the unit area) and placed in 1/2000 Wagner pots (New Wagner pot, AS One Corporation, Japan). In all treatments, the soil was sufficiently irrigated and then seedstocks of the potato cultivar 'Sumi' were sown. To determine the optimal fertilizer concentration for the subsurface drip system, six treatments were performed to investigate the potato growth and yield: EC 0 (N-P-K: 0-0-0; irrigation only), EC 0.5 (N-P-K: 0.9-0.6-0.4), EC 1.0 (N-P-K: 1.7-1.2-0.7), EC 1.5 (N-P-K: 2.6-1.8-1.1), EC 2.0 (N-P-K: 3.4-2.4-1.4), and EC 3.0 (N-P-K: 5.1-3.6-2.1).
To determine the optimal fertilizer composition, four treatments, NPK (N-P-K: 1.7-1.2-0.7), NK (N-P-K: 1.7-0-0.7), K (N-P-K: 0-0-0.7), and a control treatment (N-P-K: 0-0-0; irrigation only), were performed based on EC 1.0, which was the best fertilizer concentration identified in the previous experiment. The fertilizers used in the treatment were water-soluble urea (CO(NH2)2: N (46%); Smartro UREA, Ecotech, Busan, Korea), fused phosphate (P2O5, P (17%); Pungnong, Seoul, Korea), and potassium sulfate (K2SO4, K (48%); Farmhannong, Seoul, Korea). During the tuber initiation and filling stages, 1 L fertilizer solution was applied twice per treatment, and the soil moisture level was kept at -20 kPa (19%) during the rest period of the growing season, excluding the fertigation period. The plants were harvested five days after the fertigation treatment, dried in an oven at 50 °C, and then crushed finely with a mixer. The dried samples were then evaluated for total nitrogen, phosphorus, and potassium contents to determine the rate of nutrient uptake. Each treatment was repeated three times following a randomized complete block design in the plot.
| pH (1:5) |
EC (dS m-1) |
P2O5 (mg kg-1) |
T-N (%) |
O.M. (g kg-1) |
Ex. cation (cmol kg-1) | |||
|---|---|---|---|---|---|---|---|---|
| K+ | Ca+ | Mg+ | Na+ | |||||
| 7.15 | 0.08 | 265.0 | 0.09 | 13.3 | 0.22 | 7.25 | 0.58 | 0.44 |
| Three Phases of Soil | Soil Hardness (mm) |
Soil Characteristic | ||||||
|---|---|---|---|---|---|---|---|---|
| Solid | Liquid | Gas | Clay | Sand | Silt | Bulk Density (Mg m-3) |
Soil Texture |
|
| (%) | (%) | |||||||
| 56.5 | 14.0 | 29.5 | 7.2 | 10.2 | 56.7 | 32.2 | 1.5 | sandy loam |
2.2. Experimental Field Environment and Composition
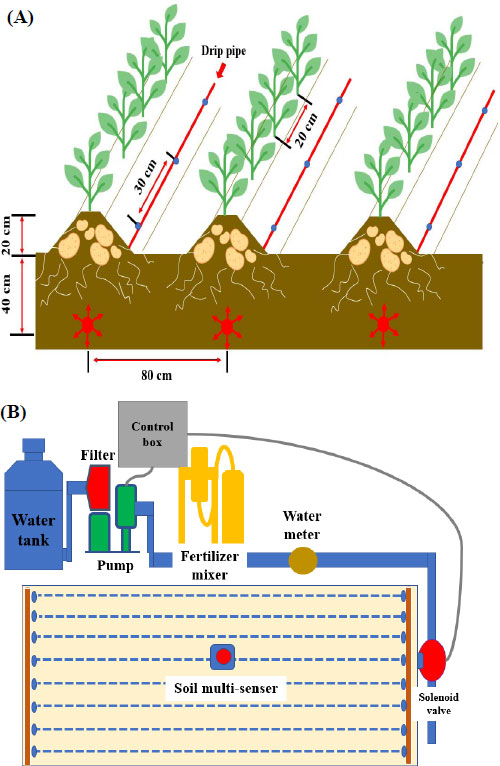
This experiment was conducted over two years between 2021 and 2022 in a test field of Gyeongsang National University (19°41′41.4′′N, 117°59′37.6′′E; field area: 80 m x 10 m) located in Gajwa, Jinju, Gyeongsangnam-do, Korea. A pressure-compensated belowground drip pipe system (ID, 14.2 mm; WT, 1.00 mm; flow rate, 1.60 L h-1; spacing, 0.3 M; Netafim, Unreal CNL, Hatzerim, Israel) was buried in the experimental field at intervals of 80 cm at approximately 40 cm depth using a belowground drip pipe laying machine (patent; 10-2479896-000, RDA, Korea), and an automatic subsurface drip system (WT-2000, Mirae Sensor, Seoul, Korea) was also installed (Fig. 1).
The pH of the soil in the experimental field was 7.15; the electrical conductivity was 0.08 dS m-1, the organic matter content was 13.3 g kg-1, the available phosphoric acid and total nitrogen contents were 265.0 and 0.19 mg kg-1, respectively, and the Ca2+, K+, Mg2+, and Na+ exchangeable cation contents were 7.25, 0.22, 0.58, and 0.44 cmol kg-1, respectively (Table 1). The soil physical properties were as follows: solid phase, 56.5%; liquid phase, 14.0%; gas phase, 29.5%; soil hardness, 7.2 mm; bulk density, 1.5 Mg m-3. The soil was identified as a clay loam with a high sand content (Table 2).
2.3. Subsurface Drip Irrigation and Fertilization Treatment
The experimental plot was arranged into three replicates of a randomized block design, and the total area was set to 800 m2 (Fig. 1B). ‘Sumi' was used as the test variety, and 20 tons per ha of livestock manure and fertilizer (Seung Green Tec Co., LTD, Miryang, Korea) were applied before sowing, and then ridge rows were raised. The ridges were mulched with black polyethylene film before planting, and the potato seedstocks were planted on 11 March 2021 and 2 March 2022. Sowing was conducted at 20 cm spacing within a row and 80 cm spacing between rows (Fig. 1A). After sowing, the emergence rate of the potatoes was 95%, and all lateral buds were removed.
Before the potato seedstocks were sown, half of the standard fertilizer amount (N-P2O5-K2O: 50-44-65 kg ha-1) based on the potato standard fertilizer amount (N-P2O5-K2O: 100-88-130 kg ha-1) was applied to the soil, and a concentration of 1% was applied with a liquid fertilizer mixer (Mixrite 12502, Tefen, Chaim Herzog Israel) dissolved in 2,430 L (the amount of water consumed in area of the treatment group was converted into a ha unit) using a subsurface drip system with half of the water-soluble fertilizer. Fertigation treatments in 2021 included 5 treatments, namely, irrigation treatment and control (non-irrigation and non-fertigation) and 3 treatments of potassium only, which were previously found to be effective. In addition, the fertigation treatments in 2022 included 6 treatments to which the EC 1.0 treatment identified in the previous pot experiment was added.
The application of the treatments with potassium only, i.e., K 20 (20 kg ha-1), K 50 (50 kg ha-1), and K 70 (70 kg ha-1), was divided between the tuber initiation and filling stages. In basal fertilizer, compound fertilizers used as a basal fertilizer were applied with potato exclusive fertilizer (N-P2O5-K2O: 10-8-9; Chobi, Seoul, Korea) based on nitrogen, and phosphoric acid and potassium were additionally supplied using fused phosphate (P2O5, P (17%); Pungnong, Seoul, Korea) and potassium sulfate (K2SO4, K (48%); Farmhannong, Seoul, Korea). The top dressing fertilizer was applied with a subsurface drip system after mixing with soluble fertilizers (soluble urea, fused phosphate, and potassium sulfate) according to the application amount. In the case of the irrigation treatment, only water was applied, and the control was not irrigated, and the fertilizer amount of irrigation and control was applied as only basal fertilizer. The fertigation treatment was applied in the same manner as above with a liquid fertilizer mixer. Irrigation and fertigation were performed on 7 and 24 May 2021 and on 22 April and 9 May 2022, respectively, and harvesting was carried out on 14 June 2021 and 10 June 2022. The control of disease and insect pests was carried out on the basis of the Rural Development Administration's standard agricultural manual.
2.4. Analysis of the Total Nitrogen, Phosphoric Acid, and Potassium Content
Whole potato plants were harvested and dried in a drying oven at 60 °C, and a sample was ground with a blender for nutrient uptake analysis. For nitrogen and potassium analyses, 3 g of powdered sample was added to 10 mL of HNO3 and 30 mL of HCl, followed by heating and decomposition, cooling, and filtration. A sample of 1 mL was taken, and the wavelength at burning was measured with a flame photometer (BWB Technologies, Newbury, UK). Phosphoric acid was analyzed using an ICP spectrometer (Spectro Genesis, Spectro Ametek, Kleve, Germany) after the addition of 10 mL of HNO3 and 30 mL of HCl to 2 g of the sample, followed by heating and decomposition at 300 °C for 30 minutes and then cooling and filtering.
2.5. Evaluation of Potato Growth and Yield
The growth of spring potato in the field according to fertigation cultivation using a subsurface drip system was determined 20 days before harvest (May 20) based on the plant height, stem length, leaf length, leaf width, and number of leaves and lateral buds. The fresh weight of aboveground and belowground parts excluding tubers was determined at harvest time, and the TR ratio was calculated as the ratio of aboveground to root parts. The number and yield of tubers were measured as the total number of tubers and the weight of the tubers per plant at harvest time, and the marketable yield ratio was calculated by dividing the total yield by the weight of tubers that weighed more than 50 g. The number of investigated plants was expressed as the average of a total of 30 plants in three repetitions, with 1 row and 10 plants as one repetition according to the fertigation treatments in a randomized block design.
The fertilizer concentration and composition pot experiments were performed only for growth investigations because the plants were harvested to investigate the nutrient uptake rates after the fertigation treatment. The assessment of the growth in the pots was conducted in the same way as that for growth in the field.
| Months | Mean Temperatures (°C) | Precipitation (mm) | |||||||||||
|---|---|---|---|---|---|---|---|---|---|---|---|---|---|
| Minimum | Maximum | Average | 2021 | 2022 | NS | ||||||||
| 2021 | 2022 | NS | 2021 | 2022 | NS | 2021 | 2022 | NS | |||||
| March | 6.3 | 1.3 | 3.9 | 15.8 | 15.8 | 13.7 | 10.7 | 8.5 | 8.6 | 161.1 | 113.8 | 109.7 | |
| April | 6.3 | 7.4 | 8.7 | 21.1 | 21.4 | 18.2 | 13.6 | 14.2 | 12.7 | 82.2 | 71.6 | 168.4 | |
| May | 11.3 | 10.8 | 14.0 | 23.8 | 26.4 | 23.4 | 17.6 | 18.7 | 17.8 | 116.3 | 2.3 | 147.1 | |
| June | 17.5 | 18.3 | 18.4 | 27.5 | 27.9 | 25.9 | 22.2 | 22.7 | 21.7 | 101.7 | 121.3 | 176.2 | |
| Average | Sum | ||||||||||||
| Mar. ~ Jun. | 10.4 | 9.5 | 11.3 | 22.1 | 22.9 | 20.3 | 16.0 | 16.0 | 15.2 | 461.3 | 309.0 | 601.4 | |
2.6. Soil Moisture Content and Electrical Conductivity
To determine the soil moisture content in the subsurface drip irrigation and fertigation treatments, sensors (WatchDog SMEC 300, Spectrum Technologies Inc., Chicago, USA) were buried at different soil depths (at 10, 20, 30, and 40 cm [below the soil surface], at 0 cm [at the surface], and at +10 cm [ridge above the surface]), and the soil moisture content was recorded using a data logger (WatchDog 2400, Spectrum Technologies Inc., Chicago, USA). The soil moisture content and electrical conductivity (EC) in the tuber initiation and tuber filling periods of potato were determined by embedding a sensor approximately 10 cm belowground near the potato tuber.
3. RESULTS AND DISCUSSION
3.1. Comparison of the Weather during the Experimental Period and Normal Seasons
During the experiment in 2021, the average temperature was 2.1 °C, 0.9 °C higher in March (potato sowing season) and April, respectively, than in normal seasons, and 0.2 °C lower in May and 0.5 °C higher in June than that in normal seasons (Table 3). Precipitation in March was 51.4 mm higher than that in normal seasons, but it was 86.2 mm lower in April, 30.8 mm lower in May, and 74.5 mm lower in June compared to normal seasons. In 2022, the average temperatures in March and April were 0.1 °C lower and 1.5 °C higher, respectively, than those in normal seasons, and in May and June, they were 0.9 °C and 1.0 °C higher, respectively, than those in normal seasons. Precipitation was 4.1 mm higher than that in normal seasons in March but 96.8 mm lower in April, 144.8 mm lower in May, and 54.9 mm lower in June compared with normal seasons. Therefore, during the experimental period, the temperature was higher than that in normal seasons, and the precipitation was 461.3 mm and 366.5 mm lower (in 2021 and 2022, respectively), indicating that the drought in spring became increasingly severe (Table 3).
3.2. Choice of the Fertilizer Concentration and Composition to be used for Subsurface Drip Fertigation
To confirm the appropriate concentration of fertilizer for the subsurface drip system, the experiment that tested the amount of nutrients absorbed by potato according to the concentration of each compound fertilizer (N, P, K) showed that nitrogen uptake was the highest at EC 1.0 in both the tuber initiation and filling stages (Fig. 2). Nitrogen uptake peaked at EC 1.0 and tended to decrease according to whether the fertilizer concentration was low or high (Fig. 2A). Phosphoric acid and potassium uptake was also the highest at EC 1.0 in both the tuber initiation and filling stages, and uptake tended to decrease thereafter, similar to that of nitrogen (Fig. 2B, C). The total uptake of NPK also showed a decreasing trend after peaking at EC 1.0, similar to the uptake of nitrogen, phosphoric acid, and potassium (Fig. 2D).
The tuber filling stage absorbed approximately 4 times more fertilizer than the tuber initiation stage based on EC 1.0. Regarding the potato growth characteristics analyzed according to fertilizer uptake amount and fertigation treatment, there was no significant difference in plant height or leaf length and width among treatments except for EC 3.0, but there was an increasing or decreasing trend based on EC 1.0 (Table 4). Although there was no difference among treatments, stem height and diameter tended to decrease as EC increased. The number of leaves, fresh weight, and dry weight were also the highest at EC 1.0 or EC 1.5 and decreased rapidly as EC increased.
Nutrient uptake was found to be the highest in the tuber initiation and filling stages at EC 1.0, and potato growth was excellent as the concentration increased from EC 0 to EC 1.0 or 1.5. It was confirmed that nutrient uptake and growth were somewhat weak at values higher than EC 1.0. Chang et al. [27] and Calori et al. [28] reported similar results to those obtained in this study, noting that the aboveground growth and number of tubers were the highest at EC 1.0 in potato, and yield and growth decreased at EC 2.0 and higher. As a result, nutrient uptake according to the fertilizer concentration was the best at EC 1.0, and potato growth was the best at EC 1.0 and EC 1.5, but there was no significant difference among treatments, so EC 1.0, which has the lowest environmental risk from an excess nutrient supply standpoint, was chosen as the appropriate concentration to determine the fertilizer composition.
After we determined that nutrient uptake and growth were the best at the EC 1.0 concentration in the previous experiment, mixed or single-use fertilizers such as NPK, NK, and K were used to prepare the fertilizer solution at EC 1.0 and were applied at the tuber initiation and filling stages. Nitrogen and potassium uptake was highest in the NK treatment during both tuber initiation and filling and tended to decrease in the NPK, K, and irrigation treatments (EC 0) (Fig. 3). The uptake of phosphoric acid was highest in the NPK and NK treatments during the tuber initiation stage and highest in the NPK treatment during the tuber filling stage. Total nutrient uptake was the highest in the NK treatment in both the tuber initiation and filling stages, followed by the NPK, K, and irrigation (EC 0) treatments. Overall, the tuber filling stage had higher nutrient uptake than the tuber initiation stage.
Potato growth was best in the K single-use treatment in terms of plant length and stem length, with no difference in leaf number, leaf length, or stem length among treatments. Leaf width was the lowest in the K single-use treatment and slightly wider in the NPK and NK treatments (Table 5). Except for the irrigation treatment (EC 0), there was no difference in fresh weight or dry weight among the treatments, but the weights tended to be high in the NPK and K single-use treatments.
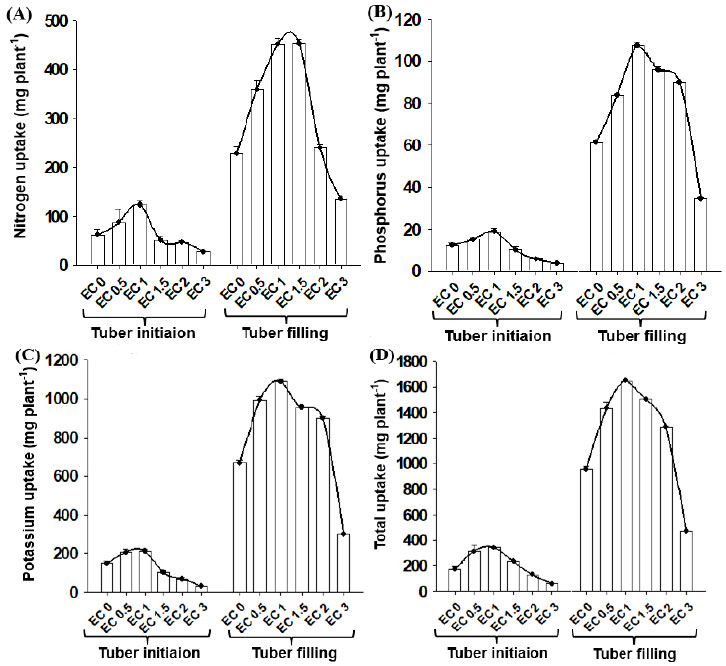
Table 4.
| Treatment | Plant Height | Stem Height | Leaf Length | Leaf Width | No. Leaves (No. Plant-1) |
Stem Diameter (mm) |
Total Fresh Weight |
Total Dry Weight |
|---|---|---|---|---|---|---|---|---|
| (cm) | (g) | |||||||
| EC 0† | 25.3ab‡ | 15.7a | 21.5ac | 9.1a | 9cd | 10.8a | 288.7ab | 32.1ab |
| EC 0.5 | 31.4ab | 17.2a | 21.3ac | 9.5a | 12a | 11.1a | 314.1ab | 34.9ab |
| EC 1.0 | 37.0a | 16.9a | 24.5a | 12.3a | 11ab | 10.5a | 383.0a | 42.6a |
| EC 1.5 | 32.3a | 14.3a | 23.5ab | 10.5a | 9bc | 11.2a | 386.0a | 42.9a |
| EC 2.0 | 30.5ab | 14.3a | 14.6c | 8.8a | 8d | 10.1a | 179.0b | 19.9b |
| EC 3.0 | 19.5b | 14.7a | 16.5bc | 2.0b | 8d | 8.5a | 169.3b | 18.8b |
‡Different letters within a column denote significant differences at p < 0.05.
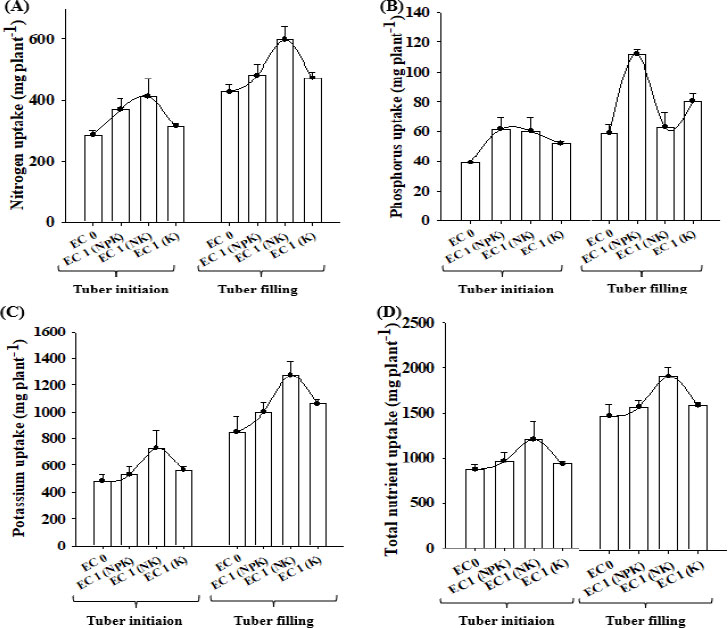
Table 5.
| Treatment | Plant Height | Stem Height | Leaf Length | Leaf Width | No. Leaves (No. Plant-1) |
Stem Diameter (mm) |
Total Fresh Weight |
Total Dry Weight |
|
|---|---|---|---|---|---|---|---|---|---|
| (cm) | (g) | ||||||||
| EC 1 | NPK | 32.3b‡ | 16.6ab | 22.3a | 15.2a | 10a | 13.0a | 383.2a | 38.4a |
| NK | 30.8b | 14.8b | 23.3a | 15.3a | 10a | 11.7a | 376.0a | 38.4a | |
| K | 37.2a | 19.4a | 21.8a | 11.9b | 9a | 10.1a | 397.3a | 40.6a | |
| EC 0 | Irrigation† | 29.2b | 14.4b | 20.1a | 14.3a | 9a | 12.9a | 269.0b | 32.3a |
‡ Different letters within a column denote significant differences at p < 0.05.
Overall, the nutrient uptake amount according to fertilizer composition was excellent in the NK treatment, and potato growth was slightly better in the K single-use treatment, even though there were no significant differences among the NPK, NK, and K treatments.
The NK treatment led to excellent nutrient uptake, but the slightly low dry matter production was assumed to be due to the N:K ratio. According to Cardoso et al. [28], the optimal N:K ratios for maximum cucumber production under hydroponic cultivation are 1:2 and 1:3, and K acts as a growth regulator determining the balance between vegetative and reproductive growth when N availability is high. The N:K ratio (2.4:1) in this experiment was high; therefore, there was a trend toward low fresh weight and no difference in dry weight, as K plays a role in growth regulation. Additionally, it appears that the K single-use treatment without nitrogen enhances the uptake of other macro- and microelements, increasing potato growth [30].
Therefore, based on the results of this experiment, the K single-use treatment and the NPK (EC 1.0) treatment were chosen as fertilizers for the subsurface drip fertigation treatment.
3.3. Establishment of Supply Criteria for Subsurface Drip Irrigation and Fertigation
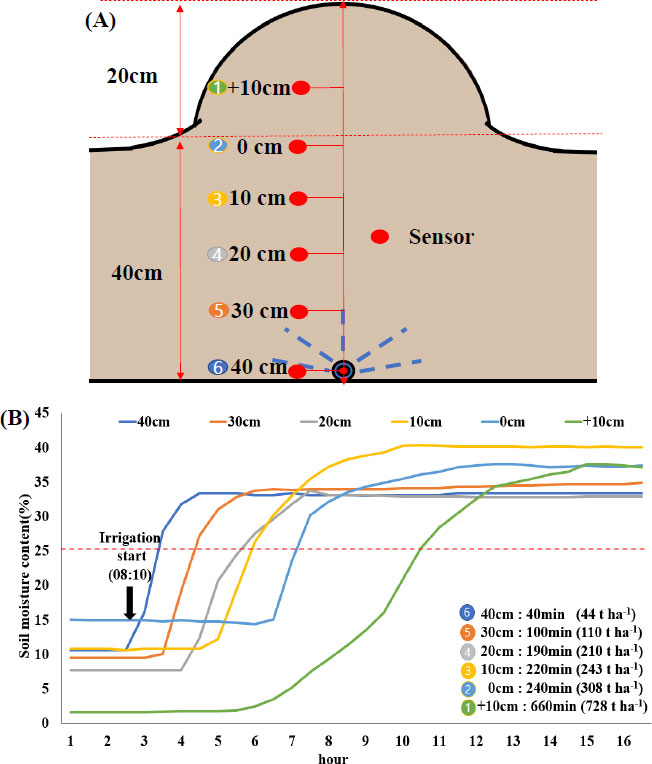
The soil moisture content was measured after subsurface drip irrigation. Based on a soil moisture content of 25%, which is suitable for potato growth [31], the area at approximately 40 cm depth where the subsurface drip pipe was buried became saturated 40 minutes after irrigation started, and 44 tons ha-1 of water were consumed (Fig. 4). Subsequently, the soil at approximately 30 cm, 20 cm, and 10 cm depth was saturated after 220, 190, and 100 min, respectively, and 110, 210, and 243 tons ha-1 of water were consumed. The ground surface (0 cm) and the ridge (+10 cm above from the ground) were saturated after 240 min and 660 min, respectively, and the amount of water consumed was 308 and 728 tons ha-1, respectively. In the clay loam soil of the experimental field, the surface layer (0 cm), with a large distribution of potato tubers, took 6–7 hours to become saturated with irrigation water, and approximately 308 tons ha-1 of water were consumed. Badr et al. [32] and King et al. [33] stated that the amount of water saturation varies based on the soil type because the proportion of clay, silt, and sand affects the water holding capacity and diffusion speed. Additionally, the saturated water content varies depending on the type of soil: 8 to 10% for loam, 11 to 19% for loamy sand, and 18 to 28% for sandy soil. It has been reported that 25.6 and 29.5 tons 10 a-1 water are required for clay loam and sandy soil, respectively [31, 34, 35]. The field soil in this study was confirmed to also be sandy loam, and the amount of water consumed was 308 tons (surface area), which is similar to the results of previous studies. In addition to soil properties, the burial depth of the drip pipe and the drip pipe emitter interval, width, and type affect water diffusion [36]. The difference in the saturation time and speed according to the soil type affects water absorption by plants [37, 38].
In this study, the amount of irrigation (243 tons ha-1) at approximately 10 cm, where potato roots are widely distributed, was used as the standard for irrigation and fertigation (fertilizers were dissolved in 2,430 L of water for each treatment and fertigated with 1% concentration as a form of liquid fertilizer).
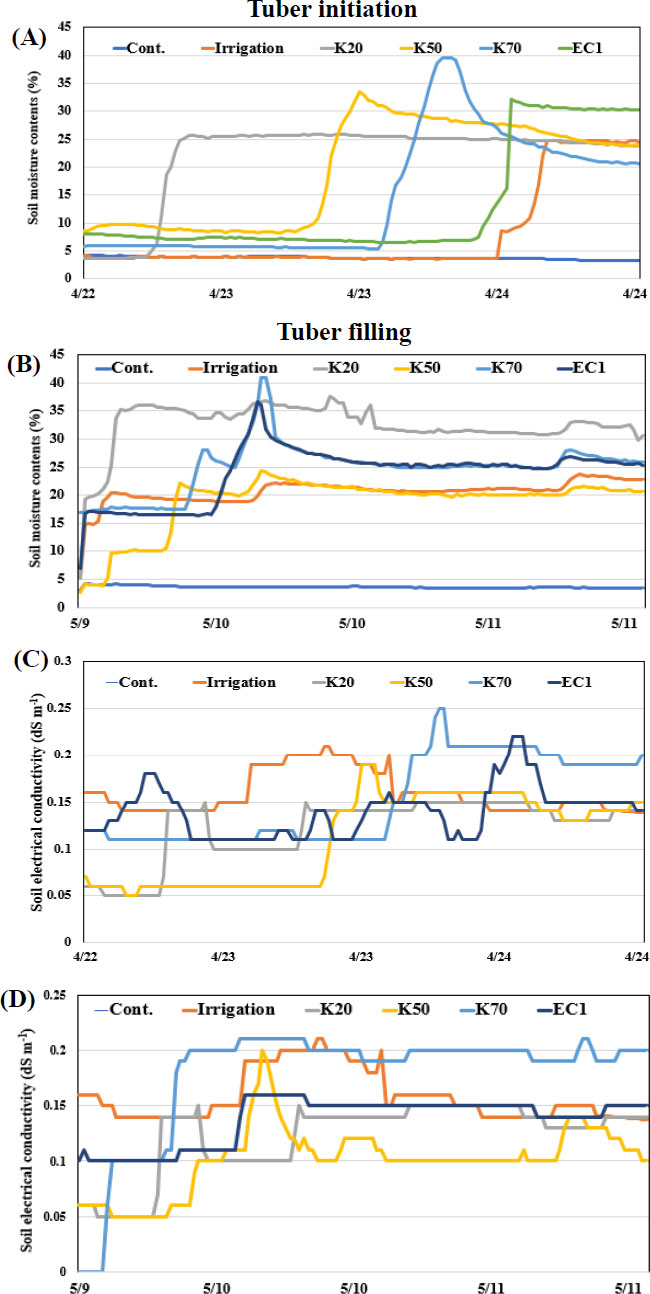
Potato fertigation treatment using the subsurface drip system was carried out during the potato tuber initiation and filling stages (Fig. 5A, B). It was confirmed that the EC changed in accordance with the fertigation treatments, confirming that the fertigation treatments were performed properly (Fig. 5C, D). The K 70 treatment had the largest EC variation in the root zone during both the tuber initiation and filling stages, followed by the K 50, EC 1.0, K 20, irrigation and control treatments. This shows that there was a significant change in EC in relation to the fertilizer concentration.
In the fertigation treatment, the soil EC showed a tendency to increase gradually after initially being lower than that in the irrigation treatment (Fig. 5C, D). The range of moisture diffusion in soil is thought to be different at the point where the sensor is buried, and this is caused by the time difference in ionization via interaction with soil colloids and aggregates [39].
3.4. Characteristics of Potato Growth and Yield under Belowground Fertigation Treatment using a Subsurface Drip System
The K single-use and NPK mixture fertilizer treatments were applied for two years with a subsurface drip system. These treatments were chosen in the previous pot experiment.
In the first year (2021), the concentrations of K, which have been shown in numerous studies to be effective in ground fertilization, were analyzed in the experiment, and in the second year (2022), the EC 1.0 treatment chosen in the previous pot experiment was added to compare with K single-use fertigation. Furthermore, in the case of K single-use fertigation, the fertilizer amount in the EC 1.0 treatment in the previous pot experiment was 30 kg ha-1, so the experiment was performed by decreasing and increasing the concentration of K based on this and adding the concentrations of K 20, K 50 and K 70.
Spring potato growth was analyzed according to the application of subsurface drip fertigation, and in 2021, there was no difference in plant length, stem length, leaf length among treatments, and the leaf width, leaf number, and lateral buds did not different between the fertigation and irrigation treatments; however, there was a difference between these treatments and the control (nontreatment) (Table 6). In 2022, there was no noticeable difference between the irrigation and fertigation treatments, and the control had the lowest levels of most growth indicators, including plant height, stem length, leaf length, leaf width, leaf number, and stem diameter.
In the first year (2021), there was no significant difference in the fresh weight of the above- and belowground parts of potato, except in the control, but the K single-use treatments tended to be slightly better than the irrigation treatment (Table 7). The TR ratio and number of tubers differed slightly among treatments, but no significant trend was found in comparison to the K single-use fertilizer concentration. The total yield of tubers treated with K 50 was the highest, followed by K 70, K 20, irrigation, and control. The marketable yield ratio also showed a similar trend to the total yield. It was confirmed that the K single-use fertigation treatments increased the yield compared to the irrigation and control treatments. The K 50 treatment, in particular, increased the yield by 47% compared to the control and by 26% compared to the irrigation treatment. In the second year (2022), the fresh weights of the above- and belowground parts and the TR ratios were comparable to those in the previous year, with no difference among treatments except for the control, and the number of tubers was higher in the fertigation and irrigation treatments than in the control, excluding the EC 1.0 treatment. The total yield was the highest in the K 50 treatment, followed by the EC 1.0, K 70, K 20, irrigation, and control. In particular, the K 50 treatment increased yield by 76% and 13%, respectively, compared to the control and irrigation treatments, respectively. There was no significant difference among the treatments in terms of the marketable yield. However, the K 50 and K 70 treatments resulted in a slightly lower marketable yield than that in the previous year.
A summary of the belowground fertigation experiments using the subsurface drip system revealed that there were no differences in the TR ratio among treatments, but there were differences in the fresh weights of the above- and belowground parts, number of tubers, total yield, and marketable yield. The marketable yield and the total yield were significantly different between years by treatment. This suggests that the belowground fertigation treatment had a significant impact on the yield of belowground parts.
Table 6.
| Year | Treatment | Plant Height |
Stem Height |
Leaf Length |
Leaf Width |
Leaf Number |
Lateral Bud |
Stem Diameter |
|
|---|---|---|---|---|---|---|---|---|---|
| cm | No. plant-1 | mm | |||||||
| 2021 |
K 20 | 41.9a† | 18.7a | 11.7a | 27.5ab | 15a | 3.1ab | 11.7a | |
| K 50 | 42.1a | 16.9a | 11.1a | 28.7a | 15a | 3.9ab | 11.1a | ||
| K 70 | 42.9a | 17.7a | 11.5a | 27.4ab | 15a | 3.8ab | 11.5a | ||
| Irrigation | 44.3a | 17.9a | 12.2a | 28.0a | 16a | 4.1a | 12.2a | ||
| Control | 36.6b | 16.1a | 12.5a | 25.6b | 12c | 2.5b | 12.5a | ||
| 2022 |
K 20 | 45.7a | 24.3ab | 29.3ab | 14.0bc | 12a | 3.4cd | 12.7a | |
| K 50 | 46.8a | 25.2ab | 32.9a | 15.4ab | 12a | 4.0a | 12.7a | ||
| K 70 | 49.6a | 24.2ab | 32.3a | 16.5a | 12a | 3.3cd | 12.6a | ||
| EC 1 (NK) | 47.9a | 26.3a | 30.5ab | 15.7b | 11a | 4.0a | 12.7a | ||
| Irrigation | 49.5a | 28.5a | 33.0a | 16.9a | 12a | 4.1a | 12.9a | ||
| Control | 39.1b | 20.9b | 25.9b | 13.4c | 9b | 3.2d | 10.7b | ||
| Significance‡ | - | - | - | - | - | - | - | ||
| Treatment (T) | *** | NS | * | *** | NS | *** | * | ||
| Year (Y) | ** | ** | ** | NS | NS | ** | * | ||
| T xY | NS | NS | NS | NS | NS | NS | NS | ||
‡ NS, *, **, *** indicate not significant and significant at P=0.05, 0.01 and 0.001, respectively.
| Year | Treatment | Top Fresh Weight | Root Fresh Weight | T/R | Total Tuber Number | Total Tuber Yield | Marketable Yield Ratio |
|---|---|---|---|---|---|---|---|
| g Plant-1 | % | No. Plant-1 | Ton ha-1 | % | |||
| 2021 |
K 20 | 279.8a† | 671.4a | 0.42a | 6.0b | 37,9c | 85.6a |
| K 50 | 264.9a | 779.1a | 0.34bc | 7.9ab | 44,4aa | 86.3a | |
| K 70 | 213.7a | 710.7a | 0.30c | 9.3a | 39,4b | 83.9a | |
| Irrigation | 234.8a | 642.8ab | 0.37ab | 8.4a | 35,2d | 83.0a | |
| Control | 218.6b | 501.2b | 0.39ab | 8.4ab | 30,2e | 57.1b | |
| 2022 |
K 20 | 264.5a | 790.3a | 0.32ab | 8.1a | 44,7c | 81.4ab |
| K 50 | 249.8a | 825.2a | 0.31ab | 8.9a | 48,2a | 78.5ab | |
| K 70 | 274.6a | 790.5a | 0.31ab | 8.7a | 45,8b | 80.9ab | |
| EC 1 (NK) | 260.5a | 774.7a | 0.34a | 7.1b | 46,4b | 82.7ab | |
| Irrigation | 282.2a | 777.0a | 0.36a | 8.0ab | 42,5d | 85.0a | |
| Control | 117.6b | 437.9b | 0.26b | 6.6c | 27,3e | 74.8b | |
| Significance‡ | - | - | - | - | - | - | |
| Treatment (T) | * | *** | NS | * | *** | *** | |
| Year (Y) | NS | NS | NS | NS | NS | NS | |
| T xY | * | NS | NS | NS | *** | *** | |
‡NS, *, **, and *** indicate not significant and significant at P=0.05, 0.01 and 0.001, respectively.
The K 50 fertigation treatment tended to increase yield by 61% and 19% on average, respectively, compared to the control and irrigation treatments, respectively. The effect of the K single-use application was observed to be superior in the field experiment with subsurface drip fertigation, even though the nutrient uptake in the previous pot experiment was found to be superior in the NK complex treatment than in the K single-use application treatment. This likely occurred because the tuber enlargement effect was not visible in the pot experiment due to harvesting for the nutrient uptake experiment.
It was reported that the application of 200~300 kg ha-1 of K during potato cultivation prolonged the tuber enlargement period and enhanced tuber size, resulting in an increase of 20~57% in comparison to the control [2, 40-43]. Furthermore, K is involved in various functions, such as photosynthesis, protein synthesis, sugar and starch contents, and dry matter partitioning between shoots and tubers, and it is known to have a strong influence on potato quality and yield [44-46].
As demonstrated in previous studies, the application of K fertilizer is associated with plant growth, but more importantly, it contributes significantly to tuber growth and, as a result, increases yield.
Reasonable fertigation and irrigation are crucial since both water and fertilizer have a significant impact on the growth and yield of potato [47]. Gawali et al. [48] reported that the absorption rate of water-soluble fertilizer was higher than that of solid fertilizer by 27% for nitrogen, 12% for phosphoric acid, and 30% for potassium. According to Manolov et al. [49] NPK application by fertigation can be reduced by 30–60% compared to application by solid fertilizer in potato cultivation. Additionally, according to Dewidar et al. [50], subsurface drip irrigation has a water usage efficiency that is approximately 27% higher than that of surface drip irrigation. Furthermore, when K is applied in solid form, potassium is easily exchanged with soil colloids and cations in aggregates, which can cause problems in its utilization by plants [51]. Therefore, subsurface drip fertigation makes it easy to manage water by increasing the water distribution and holding capacity in the root area, and the water use efficiency (WUE) and fertilizer use efficiency (FUE) are high. As a result, it is thought to increase the yield [52].
Because fertigation is supplied along with irrigation, there will be some variation in water usage. Han et al. [53] compared surface drip and subsurface drip irrigation (buried 30 cm belowground) throughout apple growth. The water consumed through the surface drip system was 288 tons ha-1, whereas that consumed through the subsurface drip system (buried 30 cm belowground) was 138 tons ha-1, i.e., a savings of 52%. According to Lee et al. [54], this is because evapotranspiration leads to higher soil moisture at the surface. Additionally, Lim et al. [55] noted that the amount of subsurface drip irrigation varies significantly depending on the soil properties. Rout and Arulmozhiselvan [56] reported that the saturated water content of sandy soil was 13.9%, that of sandy loam soil was 32.4%, and that of clay soil was 47.8%, indicating that the higher the clay content, the higher the water holding capacity. Martins et al. [57] investigated the nutrient uptake rate in sandy, loam, clay loam, and clay soils and noticed that the higher the clay content, the higher the rate of nutrient uptake. The soil used in this experiment was a sandy loam with a clay content of 10.2%, a sand content of 56.7%, and a silt content of 32.2%, indicating a high sand content and a low clay content. Therefore, if fertigation and irrigation were performed using a subsurface drip system in a soil different from the soil used in this experiment, it is expected that the higher the clay content, the lower the water consumption and the higher the nutrient uptake. However, because potato yield is high in well-drained soil, further research on the clay and sand ratio is needed. Furthermore, Nkebiwe et al. [58] stated that the nutrient uptake of crops differs depending on the chemical properties of the soil, implying that further research on nutrient uptake based on soil chemical properties under irrigation and fertigation using subsurface drip system is needed.
In this study, the K 50 treatment (50 kg ha-1), which had the best effect, approximately 243 tons ha-1 in terms of the irrigation amount was applied in one irrigation event. Thus, it is expected that approximately 500 tons ha-1 of water for irrigation would be utilized for the total growth period of potato when treated during the tuber initiation and filling stages. Considering irrigation after sowing, it is assumed that 750 to 1000 tons ha-1 of water are needed, but it appears that the amount of water required will vary depending on the properties of the cultivated soil.
Currently, most potato growers rely on natural rainfall after sowing potato. However, because of the recent abnormal weather, the spring drought phenomenon occurs frequently, so the use of subsurface drip systems will not only help prepare for drought but will also have effects such as increased fertilizer use efficiency, reduced labor for irrigation, and increased yield. Furthermore, because N and P fertilizers are also required for subsurface drip fertigation cultivation, N and P can be applied as basal fertilizers, whereas K fertilizer will need to be applied separately in the tuber initiation and filling stages to solve the excess nutrient problem and increase yield.
However, it seems that more research on nutrient distribution or nutrient leaching and runoff as a consequence of subsurface drip fertigation is needed. Furthermore, in this study, fertigation was applied with raw water at a concentration of 1%, and research on the fertigation concentration is necessary.
CONCLUSION
For use in a subsurface drip system in the field, the nutrient uptake by fertilizer concentration and composition results for spring potato cultivation confirmed that nutrient absorption was best at EC 1.0 with NK and K. As a result of the actual field experiment using a subsurface drip system, the yield of K 50 (K 50 kg ha-1) treatment showed the most significant difference, which showed a 19% increase in water compared to irrigation treatment and 61% compared to the control. Therefore, a subsurface drip system in an open field is expected to significantly contribute to the improvement of potato productivity by increasing the efficiency of irrigation and fertilization with proper application according to the potato growth stage.
CONSENT FOR PUBLICATION
Not applicable.
AVAILABILITY OF DATA AND MATERIALS
The data supporting the findings of the article is available at https://zenodo.org/records/10213479.
FUNDING
This study was funded by Rural Development Administration (South Korea) (Awards/Grant number: PJ0157542022).
CONFLICT OF INTEREST
The authors declare no conflict of interest financial or otherwise.
ACKNOWLEDGEMENTS
Declared none.

