All published articles of this journal are available on ScienceDirect.

Vitality Analysis Algorithm in the Study of Plant Individuals and Populations
Abstract
Background:
The article presents an algorithm of the vitality analysis of plant individuals in the populations that enables the assessment of the prospects for the existence of species within certain phytocenoses and provides important information on the conditions of their growth. There are three basic stages of the algorithm: the first stage is the selection of qualitative characters, which characterize the viability of individuals; the second stage is the assessment of the vitality of specific plant individuals included in the sampling; the third stage is an integral assessment of the population vitality structure.
Objective:
The goal of the study is to develop the basic algorithm for vitality analysis of populations based on the assessment of the vitality of plant individuals, as well as the authors’ algorithms for vitality analysis, considering the characteristic features of species, in particular, their different life strategies (C-type and R-type). The algorithm of the vitality analysis is demonstrated on the example of populations of the annual weed Persicaria scabra Moench (Polygonaceae), which grows in the pea crop planting (Sumy Region, Ukraine).
Methods:
The algorithm of vitality analysis is based on the method of Yu. A. Zlobin, which includes 3 main stages. The vitality analysis of populations is carried out on the basis of the assessment of the vitality of certain individuals. The assessment of the vitality structure of populations is the third stage of vitality analysis, where the population belonging to the prosperous, equilibrium, or depressive types is determined depending on the ratio of individuals of different vitality classes (a, b, c). The calculation of the vitality analysis provides for the transformation of absolute values into unit fractions. It ensures the equivalence of the contribution of each of the features used in the assessment of the vitality of individuals and populations as a whole.
Results:
The article presents a basic algorithm for vitality analysis of plant populations. It also shows the algorithm for vitality analysis considering some biological and ecological characters of the studied species, which may be used in special and relatively rare cases. Some examples of analyses with a well-defined primary strategy ‒ competitors (C-type) or explerents (R-type) have been presented in the article. To calculate the morphoparameters of plant individuals and populations, the most convenient is the statistical package “Statistics”, which provides for the possibility of calculation automation via the command line. The division of populations into three types according to vitality is of general nature. The method of assessing the population vitality is inherently comparative, and this feature is considered to be its advantage.
Conclusion:
Vitality analysis is useful in assessing the populations of rare plant species, meadow grasses, chemical contamination on the population of plants, identifying any changes in the status populations of forest herbs in the change of forest growth conditions, as well as a number of species of forest-forming tree species. The proposed variants of the algorithm to calculate the vitality of plant species and local populations are characterized by the high biological informative value and flexibility. The incorporated information on the vitality structure of populations in quantitative PVA models to predict their dynamics will significantly increase the reliability of forecasts regarding the prospects for the existence of phytopopulations of species in various plant communities.
1. INTRODUCTION
The study of the basics of the systematic arrangement of natural plant populations is one of the main priorities of population biology. This is due not only to scientific interest but also to understand the real threat of the natural environment destruction caused by excessive anthropogenic activity [1]. The conservation of natural populations requires the most reliable detailing of all aspects of population life, the identification of universal principles of population life support, which may become objective arguments for scientifically based forecasts regarding the further existence of plants under constant anthropogenic pressure [2, 3]. The use of quantitative models to predict the dynamics of species populations under different growth conditions is important for assessing the prospects for their existence [4]. Thus, PVA (Population Viability Analysis) models are used to understand the risk of extinction of species populations and predict future scenarios for their growth and decline [5-7]. New advances in the PVA methodology, in particular development in population analysis, will improve the management of endangered populations. A comprehensive study of the structural and functional organization of species populations is an integral part of phytomonitoring, which is directly related to the establishment of differential individual and integral parameters as informative criteria for assessing their condition. The important characteristics of populations are genetic, sexual, age, ontogenetic, vital, and dimensional structures, which determine the status of a species in a plant community [8-10].
Over the past decades, it has been established that the processes of phytocenogenesis, dynamics, and resistance of plant communities are implemented at the level of plant individuals and local populations formed by them [11-14]. This fact has intensified works on studying intra-population biodiversity, i.e., the dissimilarity of individuals by one or another feature. It is established that individuals, which are part of any phytopopulation, may vary in calendar age and ontogenetic state, size, in some species – in sex (staminate or pistillate) and their vital status – vitality.
Age spectra are estimated in the populations of woody plants. In perennial grasses, it is hardly ever possible to determine the calendar age of individuals, and, therefore, this method is not used in the study of their populations. The spectrum of ontogenetic state of individuals in populations has been analyzed very often over the past decades. This method provides important information, but it does not always enable the assessment of the stability and dynamics of the studied population [15].
The ranking of individuals of the population by one morphometric feature reveals the size structure of populations. In this case, individuals are simply divided into small and large [16, 17]. The method is applied only occasionally to forestry in assessing the population of trees by the trunk diameter [18, 19] or the populations of lichens by the thallus diameter [20].
The vitality analysis has been developed [14, 21-24] to assess the vital status of plants and the populations formed by them. The vital status of individuals is assessed by a complex of their features such as morphological metric, allometric, dynamic growth, and others. The multifeatured system of evaluation of individuals provides the most precise estimation of the vitality of each individual. The conclusion on the vital structure of the population is based on the ratio of individuals of different vitality in the local population. The vitality analysis in its different modifications is widely used by many researchers both separately and in the integrated assessment of the condition of phytopopulations. Only by the Google citation records, the vitality analysis had been used by more than 150 specialists by 2018.
This makes it relevant to work out in detail and completely describe the algorithm of vitality analysis with the further development of its components to be able to most accurately characterize the vitality of particular individuals that form the population and to make the comparative assessment of different local populations of one plant species by their vitality.
2. MATERIALS AND METHODS
The algorithm of the vitality analysis is demonstrated on the example of populations of the annual weed Persicaria scabra Moench (Polygonaceae), which grows in the pea plantation (Sumy region, Ukraine).
2.1. Vitality Analysis – Basic Algorithm
The three main stages are distinguished in the algorithm of vitality analysis of plant populations.
2.2. The First Stage – The Selection of Quantitative Features that Characterize the Viability of Individuals
The maximum possible number of quantitative morphometric features should be considered when commencing the study of the vitality of the local population of a taxonomic plant species, which is new to the researcher, in individual and in the generative state. They are used to calculate allometric features. For the analysis of individuals, their random representative sampling is taken from the population.
Three or more features are used to assess the vitality of individuals and then the population as a whole. These features are selected taking into consideration the following criteria:
(a) Life form of this plant species and the conditions of their growth;
(b) Based on the results of the correlation analysis, only one feature is taken from the initial set of features from each correlation pleiade; the rest are excluded as they duplicate each other;
(c) Set of features to assess the vitality primarily includes the features that make the greatest contribution to the first and second factors according to the results of factor analysis.
The selection of morphometric features of different correlation pleiades for vitality analysis is justified by the fact that V. M. Schmidt [25] and N. S. Rostova [26] have shown that the features from one of the correlation pleiades contain similar biological information. With a certain complexity, this procedure enables to exclude subjectivism from the assessment of the status of plants.
The analysis which was carried out according to this scheme makes it possible to identify the key morphological parameters that make an integral assessment of the viability of an individual. They most often include the phytomass of aerial parts of plants, leaf surface area, the number of leaves, the number of generative structures (inflorescences, flowers, fruit), plant height, reproductive effort, etc. The composition of this set of features depends on the life form of plants. The three key features are typically used in the standard procedure for making the vitality analysis [27].
2.3. The Second Stage – the Assessment of Vitality of Specific Plant Individuals Included in the Sampling
This stage is carried out according to a rigorous mathematical algorithm. We have considered this stage using a simplified model example. The three features F1, F2, and F3, have been selected. We have supposed that F1 is the leaf surface area, cm2, F2 is plant height cm, and F3 is the number of flowers, pcs. The sample has included 7 individuals. While measuring individuals, the following results were obtained (Table 1).
| Features | Individuals, No. | ||||||
|---|---|---|---|---|---|---|---|
| 1 | 2 | 3 | 4 | 5 | 6 | 7 | |
| F1 F2 F3 |
300 40 9 |
120 60 0 |
270 65 3 |
100 30 8 |
54 6 8 |
250 10 12 |
250 8 10 |
For each of the features, it is necessary to find its greatest value. In Table 1, these values are given in bold. For the feature F1, the value is 300, for F2 ‒ 65, for F3 ‒ 12.
To compare the values of features that are initially expressed in absolute values, they are converted separately into unit fractions (1.0) by the formula:
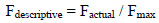 |
(1) |
Then, for example, for F1 we obtain sequentially F1descriptive = 300 / 300 = 1 for individual No. 1, F1descriptive = 220/300 = 0.40 for individual No. 2, etc. The values obtained are given in Table 2.
| Feature | Individuals, No. | ||||||
| 1 | 2 | 3 | 4 | 5 | 6 | 7 | |
| F1 F2 F3 |
1.00 0.62 0.75 |
0.4 0 0.9 |
0.9 0 1.0 |
0.3 3 0.4 |
0.1 8 0.0 |
0.8 3 0.1 |
0.83 0.12 0.83 |
Since now all the features are expressed in the same way ‒ in unit fractions, they can be added, and the resulting amount can be divided by the number of features (in the example ‒ by three). The obtained result is shown in Table 3.
| Feature | Individuals, No. | ||||||
|---|---|---|---|---|---|---|---|
| 1 | 2 | 3 | 4 | 5 | 6 | 7 | |
| Column sum for each individual Average value for each individual (Qindividual) |
2.37 0.79 |
1.32 0.44 |
2.15 0.72 |
1.46 0.49 |
0.94 0.31 |
1.98 0.66 |
1.78 0.59 |
The mean values obtained are the estimates of the vitality of each individual (Qindividual), expressed in unit fractions. The vitality of particular individuals, therefore, ranges from 0 to 1.0, and the higher it is, the higher the individual’s life status is.
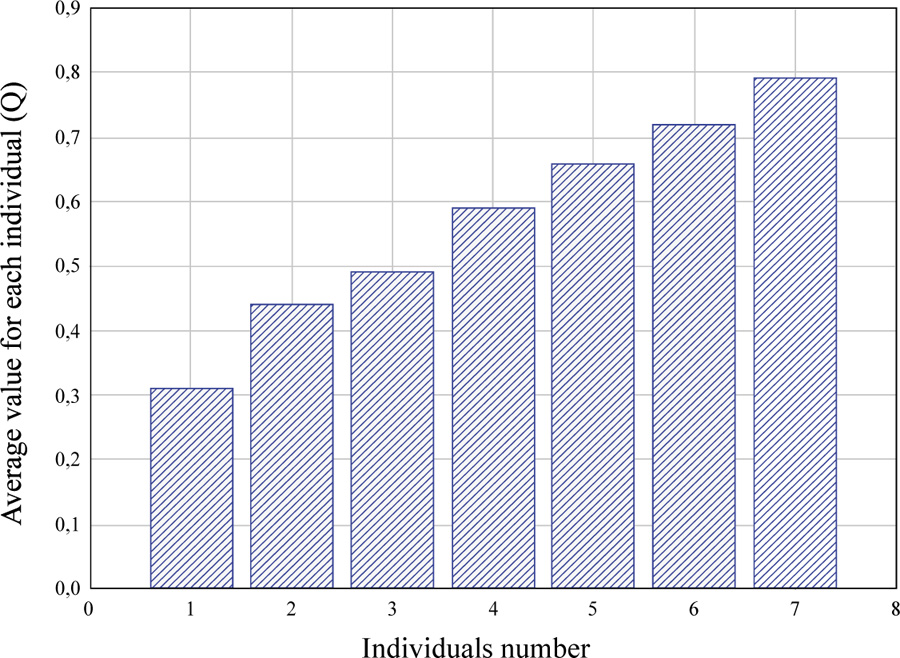
According to their vitality, individuals of the population may be ranked and presented in the form of a statistical series (Fig. 1).
These distribution series may be used to analyze the degree of differentiation of individuals in the population by vitality and have individual value in the vitality analysis.
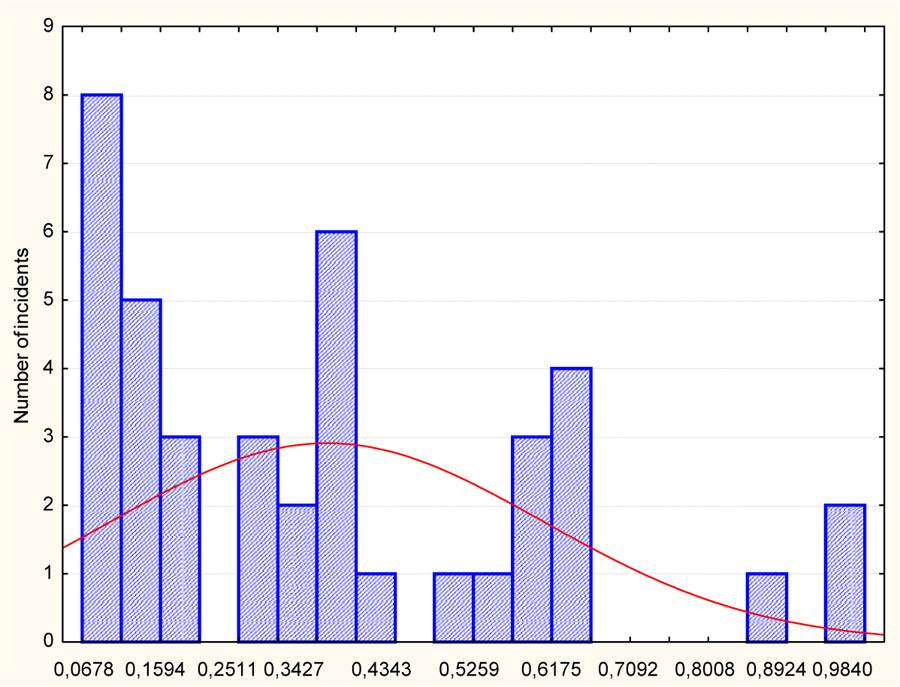
The assessment of the vitality of the Persicaria scabra individuals (the random sampling of 40 individuals) has been carried out by the four features: the weight of above-ground parts of plants (g), the height of individuals (cm), the total leaf surface area (cm2) and the number of inflorescences per individual (pcs). Using the above technique, the vitality of individuals has been assessed in unit fractions.
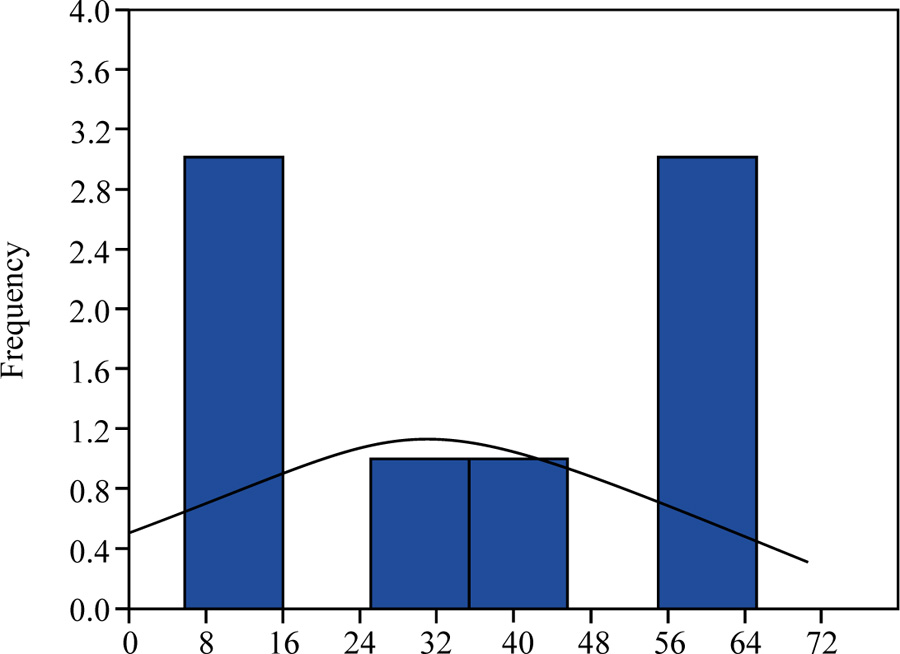
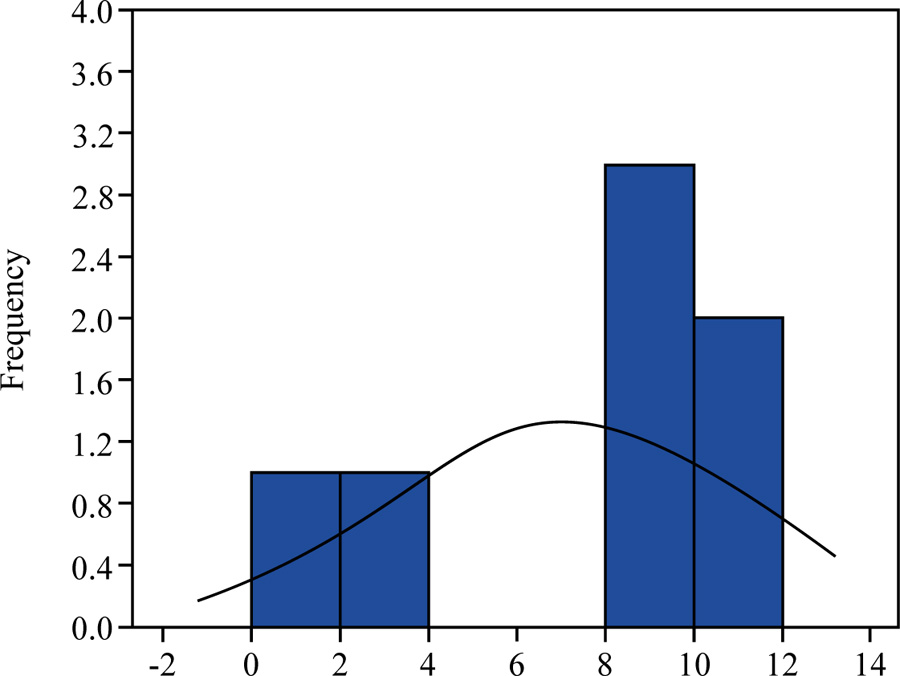
From the ranked statistical series (Fig. 2), it can be seen that the vitality of individuals varies from 0.06 to 0.98, and the population is dominated by individuals of low vital status. This can be more clearly represented as a histogram of a frequency distribution (Fig. 3). The analysis shows that the population of Persicaria scabra is dominated by individuals with low vitality from 0.06 to 0.40, significantly less than the individuals of intermediate state vitality (from 0.40 to 0.60). There are only three individuals with vitality ranging from 0.70 to 1.00.
In population studies, when analyzing the dissimilarity of individuals within a local population, they divide populations into three main types. Thus, when assessing populations by the ontogenetic state, invasive, normal, and regressive populations are distinguished, and the three groups of populations, namely, young, mature, and old, are identified (with transitional variants between them) in the Uranov-Zhivotovsky system as well [28]. This approach was implemented in the development of the algorithm of vitality analysis [29, 30].
In the basic algorithm of vitality analysis, individuals in the population are also divided into the three vitality classes: “a”, “b”, and “c”. In this regard, the interval of values of individuals in the range from 0 to 1 is divided into the three equal zones: more than 0.66, the highest class of vitality – class “a”, the vitality of individuals from 0.33 to 0.66 – class “b”, and intermediate and individuals, the vitality of which is lower than 0.33, class “c” – the individuals of low vitality. In accordance with the values Qindividual, a particular class of vitality is assigned to them.
This result for the considered model example is given in Table 4.
| Feature | Individuals, No. | ||||||
|---|---|---|---|---|---|---|---|
| 1 | 2 | 3 | 4 | 5 | 6 | 7 | |
| Qindividual | а | b | а | b | с | b | b |
Thus, 2 individuals of class “a”, 4 individuals of class “b” and 1 individual of class “c” have been obtained from the sampling of seven individuals of the model population.
The vitality of the population, from which the sampling of these individuals has been made, is determined on the basis of the division of individuals into the three classes of vitality.
Depending on the research goals, as one of the options, the total range of values of the vitality of individuals (from 0 to 1.0) can be divided not into three but into five parts – the classes of individuals’ vitality. Then
0 – 0.2 – сс (individuals of the lowest vitality)
0.2 – 0.4 – с (low vitality)
0.4 – 0.6 – b (intermediate vitality)
0.6 – 0.8 – а (high vitality)
0.8 – 1.0 – аа (individuals of the highest vitality).
2.4. The Third Stage – An Integral Assessment of the Population Vitality
Depending on the ratio of individuals of classes a, b, and c in the population, the population belongs to one of the three vitality types: prosperous, equilibrium, or depressed. Pre-absolute values of the number of individuals of a particular vitality class are normalized and converted into comparable units – frequency. To do this, the number of individuals in this class is divided by the total number of individuals in the sampling.
The type of population vitality is calculated by the formula:
 |
(2) |
where “a” is equal to the number of individuals of class “a”, and “b” is respectively equal to the number of individuals of class “b” which is divided by the total number of individuals in the sampling.
In our model example:
the proportion of individuals of class “а” – 2/7 = 0.285;
the proportion of individuals of class “b” – 4/7 = 0.571;
the proportion of individuals of class “с” – 1/7 = 0.143
Given that the values of the parameters “a”, “b” and “c” are normalized in the unit fractions, on the basis of the theory of limits, the boundary values of the index Q are determined as follows:
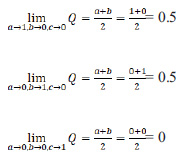 |
Therefore, the possible values of population vitality are in the range from 0 to 0.5.
This interval is divided into three equal parts: from 0 to 0.167, from 0.167 to 0.333, and from 0.333 to 0.500. The first of these intervals (Q is less than 0.167) corresponds to depressed populations, the second interval ranging from 0.167 to 0.333 is equilibrium, and the third one (Q is more than 0.333) is prosperous.
For the considered model example:
Qpopulation = ½ (а +b) = ½ (0.285 + 0.571) = 0.428
Therefore, the type of vitality of this population is prosperous.
For the population of Persicaria scabra:
Qpopulation = ½ (а +b) = ½ (3/40 + 16/40) = 0.238,
and the population is estimated as equilibrium.
When interpreting the results, it should be considered that the vitality of certain individuals is in the range from 0 to 1.0, and the vitality of populations is in the range from 0 to 0.5. Therefore, it is impossible to make a direct comparison of these values. Thus, a corresponding correction is required.
The level of statistical significance of values of vitality index Q is assessed by the criterion χ2, in comparison with the normal statistical distribution [29, 30]. This assessment is included in the program VITAL and made in the form of values of the level of statistical significance “p” for index Q.
3. RESULTS
3.1. Conclusion on the Basic Algorithm
To calculate the above parameters of plant individuals and populations, the most convenient is the statistical package “Statistics”, which provides for the possibility of computation automation via the command line. In this case, features are entered in the VAR columns.
It should be noted that neither 1.0 nor 0.5 is indivisible by 3. Periodical fractions are obtained. Therefore, the evaluation of individuals at the junction of classes “a” and “b” and classes “b” and “c” depends on the accuracy of calculations. The results were obtained using commercial calculators, where there are 2 decimal places, a regular calculator with 6 decimal places, and computers with a word length of 32 (32 decimal places), and computers with a word length of 64 (64 decimal places) may slightly diverge. But such divergences are of little consequence and random.
The division of populations into three types according to vitality is of general nature, like, for example, the division of populations into invasive, normal, or regressive according to the ontogenetic composition, when having the same type of structure, the populations being compared can differ considerably.
When assessing the vitality type of populations, the estimation of certain individuals’ varieties is an intermediate calculation, especially in the case of a random sampling of individuals from populations. Its results may not be considered by the researcher. But in solving a number of other problems of ecology and plant biology, such estimates of the vitality of each individual are very informative. If during the collecting of field samplings, the position of a particular individual is recorded in relation to the phytogenic fields of neighboring individuals, coenocells or in relation to any other local factors, the estimates of the individuals’ vitality enable to accurately establish the positive and negative ecological and phytocoenotic factors, which are essential for individuals of the studied species.
The analyzed algorithm of the assessment of vitality of a certain local population is also used in the determination of the vitality of certain local populations of the same plant species. In this case, the data of all analyzed populations are included in Table 1, and not the largest value of the feature in a certain local population, but the largest value of feature for this feature in the entire group of populations is taken as the maximum value of the feature. Other calculations are performed in a conventional manner. Thus, the method of assessing the population vitality is inherently comparative, which is considered as its advantage.
In the calculation procedure of the vitality analysis, the conversion of feature values from absolute values into unit fractions is essential. It ensures the equivalence of the contribution of each of the features used to the assessment of the vitality of individuals and populations as a whole.
In order to develop the vitality analysis for the comparative assessment of the level of population prosperity or depressiveness, A. I. Fedorova [31] has suggested the index of
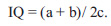 |
3 |
At the same time, populations with the value of IQ, which is greater than 1 are considered as prosperous, less than 1 ‒ as depressed, i.e. they are divided into only two classes.
V. G. Kyyak [32] has proposed an integral index to assess the viability (vitality) of populations
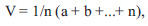 |
4 |
where а, b and so on are differentiative (integral) features of a population, n is the number of features. The population features are assessed visually in points from 0 to 1, and the viability of the population, depending on the average score, is divided into three classes. It would appear reasonable that this is a subjective and less accurate assessment.
In order to assess vitality, A. R. Ishberdin and M. M. Ishmuratova [33, 34] have proposed the index IVC calculated based on a set of quantitative features of generative individuals constituting the population. When calculating it, the valuation procedure is also used, but only in the form of the ratio of the feature value and its arithmetical mean value for the compared populations. In this case, the values of the calculated value of IVC is in the range from 0 to ad infinitum that makes it difficult to estimate the vitality structure of different populations of the same plant species and compare the vitality of populations of different plant species.
3.2. Special Cases and Additional Algorithms
In some plant species, according to the results of the factorial solution (see the first stage by the selection of plant characters for the assessment of their vitality), the contribution of features by the first, second, third, etc., factors varies significantly. In this case, only one feature has the greatest factorial load on the first factor. This case is most common in plant species with contrasting types of ecological and phytocoenotic strategy. They are:
а) some species with a competitive type of strategy (type C) that direct the main resources of organic substances not to reproduction, but to the development of vegetative organs ‒ shoots with leaves. The contribution of such parameters as the phytomass of aerial parts of plants, leaf surface area, the number of leaves to the first factor is significantly higher according to the factor analysis results. They are the key features to assess vitality,
b) plant species with the strategy of explerents (R-type), which mainly spend the resources of organic substance on the formation of generative organs and only their minimum required number on shoots and leaves. In these mainly annual plants the number of flowers, fruit or their weight contribute to the first factor of the factorial solution. For species of plants of this type, these are the features that determine their vitality.
In such special cases, it is advisable not to calculate the average value of the obtained values in unit fractions (Table 2) of the basic algorithm), but to determine the integral assessment of the vitality of each plant individual by a combination of estimates of the vitality a, b and c. For this, Table 5 follows.
It is useful to highlight in this regard that this method should be used only in the analysis of vitality of plant species with a clearly expressed primary strategy – competitors or explerents and only on the basis of the factor analysis results. For species of patients and all plant species with an intermediate type of strategy (and such plant species are the absolute majority), this method will give a distorted result.
We considered such an algorithm on the above numerical example, based on the same criteria: more than 0.66 – the highest vitality class – class “a”, the individual’s vitality from 0.33 to 0.66 – class “b”, intermediate and individuals, the vitality of which is less than 0.33, class “c” – individuals of the lowest vitality. The corresponding assessment is given in Table 6. Thus, with this assessment in the model example, we obtain the result according to which there are four individuals of the upper vitality class and three individuals of the middle class. This differs from the results of the main scheme of calculations and is the result of the fact that the first feature of the vitality of individuals is given more weight than the second and third features. In the basic algorithm of the vitality analysis, all features are considered as equivalent.
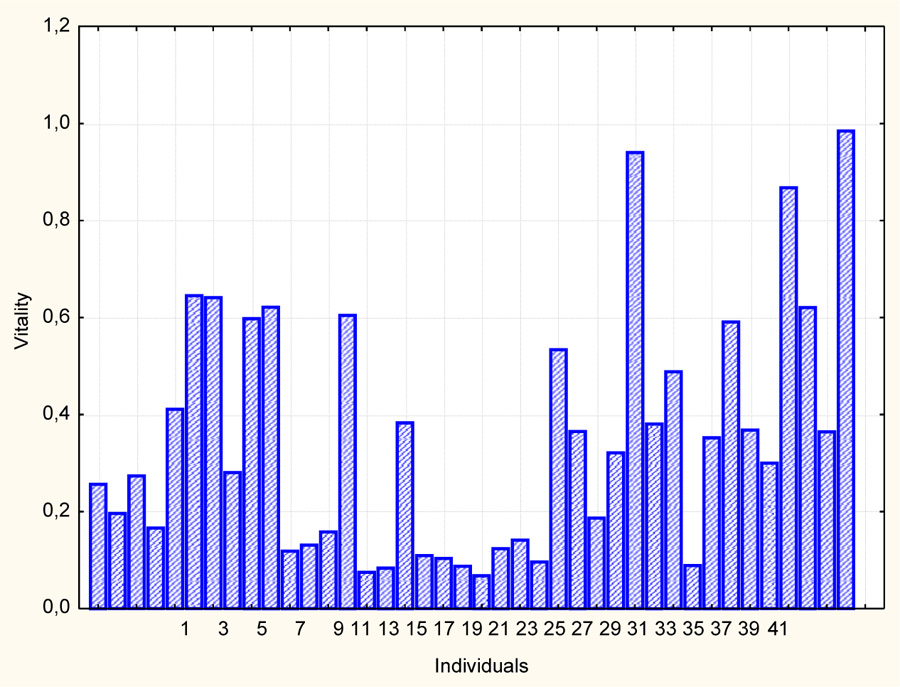
Another special case is the variant of vitality analysis, in which the range of vitality values is divided not into three equal classes but into three classes, the boundaries of which are determined on the basis of the normal frequency distribution curve. It has the following form (Fig. 4).
In this case, the boundary of the highest, intermediate and lowest vitality classes can be determined by the formula:
 |
5 |
where μ is the arithmetic mean, t0.05 is the Student’s t-test value at p = 0.05, and sμ is the arithmetic mean error. Individuals, which have this value greater than μ + t0.05·sμ, will constitute the highest class of vitality “a”, individuals, which have this value less than μ - t0.05·sμ – the lower class of vitality “c”. All other individuals will constitute the intermediate class “b”.
The application of such an approach can be used only in cases of full compliance of the feature values with the normal statistical distribution, and this is an extremely rare case. Typically, feature distribution is asymmetric or bimodal. Therefore, this approach can be used only in special cases.
Indeed, as can be seen from the Figs. (5–7), in the considered model example, there is no such correspondence. As a rule, it does not happen in real populations. Such statistical distribution curves are typical for plants of the formed phytocoenoses with a high rate of competition. Individuals in the process of ontogenesis in the life state fall into two main groups ‒ lagging with low vitality and successfully competing, with high vitality.
| Possible Combinations of Features of Individuals’ Vitality | ||
|---|---|---|
| aaa | bba | bca |
| aab | acc | bbb |
| aba | aca | bbc |
| baa | cca | cbb |
| aac | abc | bcb |
| aca | acb | ccb |
| caa | bac | cbc |
| abb | cab | bcc |
| bab | cba | ccc |
| Integral assessment of the individual’s vitality | ||
| Individuals of the highest vitality class ‒ а | Individuals of the intermediate vitality class ‒ b | Individuals of the lowest vitality class ‒ с |
| Feature | Individuals, No. | ||||||
|---|---|---|---|---|---|---|---|
| 1 | 2 | 3 | 4 | 5 | 6 | 7 | |
| F1 F2 F3 Vitality of individual Integral assessment of the individual’s vitality |
1.00 0.62 0.75 a,b,a a |
0.40 0.92 0.00 b,a,c b |
0.90 1.00 0.25 a,a,c a |
0.33 0.46 0.67 b,b,a b |
0.18 0.09 0.67 c,c,a b |
0.83 0.15 1.00 a,c,a a |
0.83 0.12 0.83 a,c,a a |


In general, additional particular variants of the algorithm for assessing the vitality of individuals and populations can be used only in special and relatively rare cases.
4. DISCUSSION
The vitality analysis of a number of rare plant species has enabled us to assess the status of populations, to monitor and predict trends in the state: Adenophora lilifolia [35], Helleborus abchasicus and Helleborus caucasicus [36], Oxytropis baschkirensis [37], Neottianthe cucullata [38], Allium angulosum [39], Dactylorhiza romana [40], Gentiana schistocalyx and Swertia iberica [41], Eрipactis helleborine, Listera ovatа, Platanthera chlorantha [42], Adonis vernalis [43], Isöetes lacustris [44] and a number of other species. L. M. Abramova and A. N. Mustafina [45] have analyzed the status of 20 populations of Dictamnus gymnostylis in the western piedmont of the Ural Mountains on the basis of the vitality analysis. I. Yu. Selyutina and others analyzed the four populations of a rare species Gueldenstaedtia monophylla, in Mongolia [46].
The vitality structure enables to reliably evaluate the status of the meadow grass stand. According to the vitality analysis of 27 populations, M. V. Lebedeva and L. M. Abramova have established the role of environmental factors for four types of Crassulaceae [47]. The method has proved to be effective in determining the reaction of a number of meadow grass species to moisture conditions [48] and identifying their ecological optimum [49]. The possibility of estimating their weather variability is shown in the example of Hypericum perforatum populations [50]. T. Yu. Samkova confirmed the vitality analysis efficiency in the study of vegetation of thermal fields in Kamchatka [51].
The vitality analysis enables to identify any change in the status of populations of forest herbs in the change of forest growth conditions [52-54], with different intensiveness of competition.
Useful information is obtained as a result of using the method of vitality in assessing the status of populations of meadow grasses in different types of meadow communities [9, 55, 56], steppe plants in the steppes [57, 58], weeds in agrophytocoenosis [59]. The assessment of the sustainability of populations of aquatic plants may be made on the basis of the vitality analysis [60].
The vitality analysis was informative in assessing the populations of several species of forest-forming tree species [61], including oak Quercus robur [62]. It is factual in assessing the state of the undergrowth of woody plants [63].
CONCLUSION
In general, the proposed variants of the algorithm to calculate the vitality of plant species and local populations or population loci are characterized by the high informative value and flexibility. The information on the vitality structure of populations should be included in quantitative models for predicting their dynamics. This will significantly increase the reliability of predictions of the state of phytopopulations, when using the models PVA.
ETHICAL STATMENT
This study is approved by the IUCN Policy Statement on Research Involving Species at Risk of Extinction and the Convention on the Trade in Endangered Species of Wild Fauna and Flora.
CONSENT FOR PUBLICATION
Not applicable.
AVAILABILITY OF DATA AND MATERIALS
Not applicable.
FUNDING
None.
CONFLICT OF INTEREST
The authors declare no conflict of interest, financial or otherwise.
ACKNOWLEDGEMENTS
Declared none.

