All published articles of this journal are available on ScienceDirect.

Soybean Productivity as Affected by Raised Seedbeds Under Dry Environments
Abstract
Background:
Raised seedbeds may be a practice for reducing waterlogging in the rooting zone in soils of the Red River of the North Valley (RRNV). However, it was not known if there would be a negative yield effect of raised beds in drier environments.
Aims / Method:
The objectives of this research were to evaluate soybean [Glycine max (L.) Merr.] response to early season iron deficiency chlorosis (IDC), agronomic characteristics, and productivity when grown on raised seedbeds compared with flat seedbeds. Soybean grain yield on raised seedbeds, averaged across six drier environments in 2012, was similar to flat seedbeds. Although grain yield did not increase on raised seedbeds, grain yield was not reduced in a dry year. Across environments there were no differences in vigor, IDC, canopy closure, plant height, thousand kernel weights, seed protein or oil content, number of seeds or pods per plant, or grain yield comparing raised with flat seedbeds. At the Rothsay environment, there was more IDC with flat seedbeds compared with raised beds. Soybean cultivars significantly differed in their IDC response and in most yield components measured. Averaged across hour of day, soil temperature was significantly higher in the raised seedbed treatments at Fargo and Hitterdal by 0.4 and 0.8 °C, respectively. When averaged across two cultivars and environments, soybean root mass was 0.37 g root-system-1 higher on raised seedbeds.
Result:
Raised seedbeds may be a useful tool to manage IDC and improve soybean productivity in the RRNV, and do not reduce grain yield in environments with below average moisture.
1. INTRODUCTION
In the United States of America (USA) over the last several decades, soybean [Glycine max (L.) Merr.] production has moved northward into the Red River of the North Valley (RRNV) region of Northwest Minnesota (MN) and Eastern North Dakota (ND).
The RRNV is known for fertile soil that was formed when ancient Lake Agassiz drained at the end of the Wisconsin glaciation 10 000 to 30 000 years ago, and deposited layers of fine silt over the existing mass of silt, clay, and gravel (glacial till) [1]. Internal soil drainage can be poor when intense rainfall events occur, causing water-saturated soil known as water-logged. Water-saturated soil has long been recognized as a major production constraint in the RRNV for soybean, maize (Zea mays L.), spring wheat (Triticum aestivum L. emend. Thell.), and other crops.
The soybean growing season in the RRNV typically starts in May and ends in September. This relatively short growing season can limit the amount of crop growth and can cause lower grain yield compared to other growing regions with longer growing seasons. Wuebker et al. [2] observed that flooding stress negatively influenced soybean germination percentage. Poor stand establishment may force producers to replant [3]. A third issue resulting from cool and wet spring growing conditions is delayed or stunted plant growth. The RRNV and surrounding production areas that are susceptible to soil waterlogging could benefit from a raised seedbed tillage system and other forms of water management which could reduce soil waterlogging and provide a more suitable rooting environment, providing potential for the producer to have increased grain yield and profitability [4, 5]. Subsurface drainage through the use of tile is another important water management practice that is increasing in the RRNV, as it has been proven to reduce soil water-logging in wet environments [6].
Raised seedbed formation is described as ridging soil with intentions to have the seedbed raised [7]. Raised seedbed designs can vary in height, width, and the number of crop rows planted on each bed [4, 8, 9]. An alternative raised seedbed system is a ridge system, commonly known as ridge-till. Ridge systems are beneficial in gentle sloping areas, soils that possess poor internal drainage, and fields with furrow irrigation [7]. In a ridge system crops are planted into previously formed ridges. The soil is left undisturbed after the crop is harvested to provide maximum residue cover on the soil. In-season cultivation is used to maintain the ridges at a desired height for use in subsequent growing seasons.
In the literature reviewed, the terms raised seedbed and ridge-till are both used. Throughout this paper the term raised seedbed will be used even if the original document called the system ridge-till. In poorly drained soils, world-wide crop production yields were higher on raised seedbeds than on traditional flat seedbeds [4, 5, 8, 9]. Bakker et al. [4] noted that the main benefit of raised seedbeds was that the soil remained unsaturated within the top 15 cm of the bed.
An experiment in Missouri, USA, compared maize grown on raised and flat seedbeds in a poorly drained Crowley silt loam soil. Maize on raised seedbeds had more biomass, taller plants, and had more root growth, which translated into 34% higher grain yield [10]. Bauder et al. [11] concluded that a raised seedbed system would be an appropriate tillage system in the northern corn belt due to plants producing greater total root length and uniform root distribution. Reduced surface compaction with a raised bed could increase plant emergence and stand establishment that could translate into higher yield [12].
Research conducted in central India concluded that soybean productivity increased when grown on raised seedbeds as compared to flat seedbeds [9]. Tomar et al. [9] also observed that root density, measured in mass per unit volume, was highest in plots with 6 m wide raised seedbeds, while lowest root density was in the flat control plots. Raised seedbeds are a common tillage strategy throughout the flat alluvial delta soils of the Mississippi River Valley and soybean grain yields are typically higher when grown on raised seedbeds [5, 8, 13-15]. One of the contributing factors to increased yield was more established plants on raised seedbeds early in the season after excessive rainfall created flooding and anaerobic conditions which killed germinating seeds in the flat seedbeds [8]. However, limited research data is available about the crop response when grown on raised beds in a drier environment.
1.1. Iron Deficiency Chlorosis
Soybean iron deficiency chlorosis (IDC) can be a severe limiting factor of grain yield. Research has documented that IDC can be a common condition in calcareous soils throughout the Upper Midwest, USA [16], and in parts of Western MN, Eastern ND [17-19]. Hansen et al. [16] reported that IDC can be difficult to research or manage due to temporal and spatial variability in appearance of chlorosis at the field scale. Symptoms can be patchy and oftentimes are noticed in low lying areas of a field. However, Franzen and Richardson [18] concluded that chlorotic patches were not consistent as soil types changed in a field.
Additional research has indicated that IDC can be correlated with soil moisture and soil temperature in calcareous soils. In an effort to manage IDC in calcareous soils, proper selection of IDC tolerant soybeans for optimal yield was suggested by Froehlich and Fehr [20]. Besides selecting for IDC tolerant soybeans, a raised seedbed system allows for soybean to grow in a more micro-managed environment with increased oxygen availability; thus, potentially reducing IDC and increasing grain yield.
1.2. Water and Heat Transport in Soil
Planting on a raised seedbed can increase germination rate while creating an environment that is well-suited for plant development [21]. Therefore, raised seedbeds could be an excellent tool for managing cool, wet spring conditions.
Soil temperature can greatly influence plant vigor and growth. Voorhees et al. [22] recognized that the optimum soil temperature for growth of most plants ranges from 20 to 30 °C. Buchele et al. [23] concluded that planting in a raised seedbed could improve stand establishment and early crop growth. The warmer soil temperatures found in a raised seedbed are partly due to gravitational water drainage within the raised seedbed and to the lower specific heat of dry soil, causing the soil to warm up faster compared with wetter soil [24].
The objectives for this soybean research were to: 1) evaluate growth and grain yield when grown on raised seedbeds within drier environments; and 2) determine if there is an interaction regarding grain yield among various soybean cultivars with differing IDC ratings to raised seedbeds.
2. MATERIALS AND METHODS
2.1. General Description of Field Studies
In 2012, field research was conducted at Fargo (46.93217˚ N 96.85899˚ W) and Prosper (47.00341˚ N 97.10975˚ W), ND, with three additional sites in MN near Barnesville (46.51549˚ N 96.49941˚W), Hitterdal (47.00666˚ N 96.40356˚ W), and Rothsay (46.41268˚ N 96.42948˚ W). Throughout this paper, experimental sites will be referred to as Fargo, Prosper, Barnesville, Hitterdal, and Rothsay. The Fargo site had two experiments, one on naturally drained land and the other on land with subsurface drainage. Therefore, the location will be referred to as Fargo for general characteristics, and Fargo (undrained) and Fargo (drained) for the specific results. The Prosper location was left out of the combined analysis for IDC due to no visual IDC, and not included in Tables (6 or 8) for IDC by environment interactions. A description of the experiment sites are presented in Table 1.
| Site | Soil series† | Taxonomic class† | Drainage | Slope† | pH‡ |
|---|---|---|---|---|---|
| --%-- | |||||
| Fargo | Fargo | Fine, smectitic, frigid Typic Epiaquerts | Poor to very poor | 0-1 | 7.7 |
| Ryan | Fine, smectitic, frigid Typic Natraquerts | Poor | |||
| Prosper | Kindred | Fine-silty, mixed, superactive, frigid Typic Endoaquolls | Somewhat poor | 0-2 | 6.7 |
| Bearden | Fine-silty, mixed, superactive, Frigid Aeric Calciaquolls | Somewhat poor | |||
| Lindaas | Fine, smectitic, frigid Typic Argiaquolls | Poorly drained | |||
| Barnesville | Hamerly | Fine-loamy, mixed, superactive frigid Aeric Calciaquolls | Somewhat poor | 0-2 | 7.7 |
| Hitterdal | Hamerly | Fine-loamy, mixed, superactive, frigid Aeric Calciaquolls | Somewhat poor | 1-4 | 8.0 |
| Flaming | Sandy, mixed, frigid, Oxyaquic Hapludolls | Moderately well | |||
| Rothsay | Hamerly | Fine-loamy, mixed, superactive, frigid Aeric Calciaquolls | Somewhat poor | 0-2 | 7.7 |
‡Soil pH data was from a depth of 0-15 cm, collected in the fall of 2011.
The experimental design used at all sites was a randomized complete block, with a split-plot arrangement and four replicates. The whole-plot factor was seedbed (flat vs. raised) and the subplot factor was soybean cultivar. Ten glyphosate-tolerant soybean cultivars were selected based on relative maturity and level of resistance to IDC.
The plots size at all sites were 3.04 m wide by 7.6 m long. Individual experimental units had four planted rows spaced 76 cm apart. Before seedbed formation, soil fertility levels were tested for each experimental site. Supplemental fertilizer was added to the soil as needed for a grain yield goal of 3 400 kg ha-1 based on NDSU Extension recommendations [26]. A Hipper Roller (Pitonyak Machinery Corp., Carlisle, AR) was used to form the raised seedbeds. Two raised seedbeds spaced 76 cm apart were formed and firmed per tractor pass by a 40.6 cm diameter steel drum at the rear of the bed former.
In preparation for the 2012 growing season, raised seedbeds were formed in the fall of 2011 in wheat stubble at Fargo, Prosper, and Barnesville, soybean stubble at Rothsay, and fallow at Hitterdal. Raised seedbed heights were measured with a straight edge lying on two raised seedbeds and a ruler perpendicular to the straight edge extending into the furrow. The average raised seedbed height was 19 cm from top of the ridge to bottom of the furrow. The raised seedbed bases were approximately 50 cm wide and the surface tops of the raised seedbeds were approximately 10 cm wide. In the spring of 2012, the raised seedbeds had settled to an average height of 16 cm and by the fall of 2012, the raised seedbeds had settled to an average height of 13 cm.
2.2. Seed Preparation
All soybean seed was company seed treated or was treated with the fungicide Apron Maxx RTA (Syngenta Crop Protection, Inc., Greensboro, NC) (a.i. mefenoxam and fludioxonil) at a rate of 3 ml kg-1 seed (a.i. mefenoxam 11.3 g L-1 and a.i. fludioxonil 7.55 g L-1). Seed was inoculated prior to planting with Rhizo-Stick (Becker Underwood Inc., St. Joseph, MO) peat-based powder soybean inoculant containing TA-11 NOD+ (Bradyrhizobium japonicum) at a rate of 6 mg product per g of seed. Germination tests were completed and seeding rate was 530 000 viable seeds ha-1.
2.3. Planting
Prior to planting at all sites, flat seedbed plots were lightly cultivated to prepare the seedbed. Due to suitable soil conditions in the raised seedbed plots, no pre-plant tillage or reforming of raised seedbeds occurred. Soybean was seeded into both flat and raised seedbeds on the same day at a seeding depth of about 5-6 cm. Real time kinematic (RTK) global positioning system (GPS) was used on the tractor for all plot work, and therefore planting the soybean directly on top of the ridges was done precisely.
2.4. Pesticide Application
Roundup WeatherMAX (a.i. glyphosate, N-(phosphonomethyl) glycine, in the form of its potassium salt) (Monsanto Co., St. Louis, MO) at a rate of 2.4 L ha-1 (a.i. 1.58 kg ha-1) was applied through TeeJet 8001 XR nozzle tips in 93.5 L ha-1 spray volume at 200 kPa spray pressure as a post emergence weed control measure. Post emergence weed control (Roundup WeatherMAX) was performed at V3 and again at the full bloom (R2). Two-spotted spider mite (Tetranychus urticae) pressure occurred late in the growing season. Insecticide was applied when leaf stippling (i.e. tiny white spots) was evident. At Hitterdal, Dimethoate 4E (a.i. Dimethoate: O,O-dimethyl-S-[(methylcarbamoyl) methyl] phosphorodithioate) (Cheminova, Inc., Research Triangle Park, NC) at a rate of 1.17 L ha-1 (a.i. 0.56 kg ha-1) was applied through TeeJet 8001 XR nozzle tips in 140 L ha-1 spray volume at 200 kPa spray pressure. Leaf stippling was also evident at Barnesville and Rothsay and Cobalt Insecticide (a.i. chlorpyrifos: O,O-diethyl-O-(3,5,6-trichloro-2-pyridinyl) phosphorothioate) (Dow Agro Sciences, Indianapolis, IN) at rate of 2.78 L ha-1 (a.i. 0.82 kg ha-1) was applied through 8001 XR nozzle tips in 140 L ha-1 spray volume at 200 kPa spray pressure. One insecticide application was effective in managing spider mite populations.
2.5. Data Collection
Throughout the growing season, agronomic data were collected from the two inside rows of the four row plots per experimental unit for stand counts, vigor, IDC, canopy closure, and plant height. At V2, plants in a 90 cm section of two rows were counted to determine plant population. Vigor scores of overall plant health and greenness were recorded twice within the growing season, early vigor at V4, and late vigor at R3. A visual score (1-9) was used, with one indicating poor plant vigor, and nine indicating best plant vigor. Ratings for IDC were scored for each plot at V4. A visual score (1-5) was used with one indicating no chlorotic plant tissue and five indicating necrotic/dead plant tissue [27]. Percent canopy closure was visually scored at the full seed growth stage (R6) as a percent of the area observed. Plant heights were measured twice per plot and averaged at R8 growth stage by measuring from the soil surface to the where the uppermost pod on the main stem of the plant was attached. Two random-representative plants from each plot of either non-data rows (one or four) were cut with a shears at the soil surface at R8. Lowest pod height (measured from the stem cutoff point to where the lowest pod was attached to the main stem), number of pods per plant with one, two, three, or four seeds per pod, total number of seeds per plant, and the average number of seeds per pod were recorded. Data were averaged across both plants for the analysis.
2.6. Root Analysis
Soybean plants of two cultivars, 01RY02 and NS 0853RR, were dug and removed from a random part of the plot in either non-data row (one or four) at R6 at Prosper, Hitterdal, and Barnesville. The sample size for soybean plants removed was equal to the width of a 19 cm spading fork per plot. The spading fork was used to remove the plants and roots from an approximate depth of 15 cm in the soil. Soybean roots were washed in water and separated by cutting the stem at the point where the cotyledon leaves had previously been joined to the main stem. Roots were placed in a paper bag and dried at 95 °C. After 100 h the roots were weighed. Average mass per plant root-system was calculated by dividing total sample root mass by total number of plant roots in each sample.
2.7. Soybean Harvest
Plots were harvested with a Wintersteiger Classic plot combine (Wintersteiger Ag, Ried, Austria). Only the two inside rows of the four row plots were harvested for grain yield. Harvest samples were cleaned and weighed. Test weight was determined with a GAC 2100 moisture and test weight tester (DICKEY-John Corp., Minneapolis, MN). Grain yield and thousand kernel weights were adjusted to a moisture content of 130 g kg-1. Seed protein and oil content were measured with a Diode Array 7200 NIR Analyzer (Perten Instruments, Springfield, IL) and expressed at a 130 g kg-1 moisture content. Dates of field measurements and applications are presented in Table 2.
| Location | |||||
|---|---|---|---|---|---|
| Measurement/Application | Fargo | Prosper | Barnesville | Hitterdal | Rothsay |
| 2011 | -----------------------------------Date----------------------- | ||||
| Raised seedbedformation - (1st time) | 9 Sept. | 7 Sept. | 16 Nov. | 3 Oct. | 1 Nov. |
| Raised seedbed Formation - (2nd time) | 19 Oct. | 20 Oct. | -- | 26 Oct. | -- |
| 2012 | |||||
| Soybean seeded | 10 May | 9 May | 11 May | 11 May | 14 May |
| Weed control | 14 May | 14 May | 14 May | 14 May | 14 May |
| 12 June | 5 June | 12 June | 12 June | 12 June | |
| 9 July | 29 June | 9 July | 9 July | 9 July | |
| Stand counts | 25 June | 6 June | 7 June | 5 June | 7 June |
| Vigor scores | 29 June | 28 June | 28 June | 28 June | 28 June |
| 20 Aug. | 21 Aug. | 20 Aug. | 20 Aug. | 20 Aug. | |
| IDC scores | 29 June | 28 June | 28 June | 28 June | 28 June |
| Canopy closure scores | 24 July | 24 July | 20 July | 20 July | 20 July |
| Insecticide applied | -- | -- | 14 Aug. | 6 Aug. | 14 Aug. |
| Root analysis | -- | 23 Aug. | 24 Aug. | 27 Aug. | -- |
| Plant heights | 12 Sept. | 12 Sept. | 12 Sept. | 12 Sept. | 12 Sept. |
| Plant analysis | 17 Sept. | 17 Sept. | 17 Sept. | 17 Sept. | 17 Sept. |
| Soybean harvested | 26 Sept. | 20 Sept. | 19 Sept. | 19 Sept. | 19 Sept. |
2.8. Soil Temperature and Ambient Rainfall and Temperature Sensors
Soil and ambient temperature sensors (HOBO Model U23 Pro v2 2x External Temperature Data Logger – U23-003) (Onset Computer Corporation, Inc., Pocasset, MA) were installed at Fargo (undrained) and Hitterdal to collect soil temperatures. These sites were selected based on differences in soil type. Sensors were installed in one flat and one raised seedbed plot per replicate, approximately 3 cm below the soil surface in flat seedbeds and 3 cm below the soil surface top in the raised seedbeds. Soil temperature sensors were programmed to start collecting data on 11 May soon after planting and were removed on 3 August, near R6 growth stage. Soil and ambient temperatures were logged every 30 minutes, and then averaged across the time of day for the entire time span of data collection. Three replicates per treatment per site were collected and analyzed.
Weather data including rainfall, mean maximum air temperatures and normal for the 2012 growing season were obtained for the experimental sites via the nearest weather station of the North Dakota Agricultural Weather Network [28]. Weather stations were (station, distance from field site): Fargo (Fargo, ND station, 6 km); Prosper (Prosper, ND station, 0 km); Hitterdal (Ulen, MN station, 16 km), Barnesville and Rothsay (Wahpeton, ND station, 32 km from Barnesville and 24 km from Rothsay).
2.9. Statistics
The statistical software SAS 9.2 with the PROC MIXED procedure (SAS Institute Inc., Cary, NC) and Type 3 ANOVA tests were used to analyze treatment data. Fixed effects in the analysis were seedbed and cultivar with all other factors considered random effects. The random term environment was used for each individual location or trial within a location (Fargo). At Barnesville replicate four was eliminated due to outside influences that were considered non-treatment effects. Residual mean squares of agronomic traits were homogenous across environments; and therefore, environments were combined for analysis. All treatment means were separated using a paired t-test at the 5% level of significance, except for soil temperature and root mass means which were analyzed at the 10% level of significance.
3. RESULTS
3.1. Weather
During the time period of April through October, total rainfall was below the 30-yr (1981-2010) normal at all locations. The critical period of R5 and R6 growth stages for seed filling in soybean (September) was extremely dry. The monthly maximum air temperatures at all six environments were mostly above normal except in October (Table 3).
| Fargo | Prosper | Hitterdal | Barnesville and Rothsay | |||||
|---|---|---|---|---|---|---|---|---|
| Month | 2012 | Normal‡ | 2012 | Normal | 2012 | Normal | 2012 | Normal |
| Rainfall | ---------------------------------------mm--------------------------------------- | |||||||
| April | 29 | 35 | 30 | 37 | 15 | 36 | 80 | 45 |
| May | 43 | 71 | 46 | 78 | 38 | 82 | 37 | 81 |
| June | 57 | 99 | 67 | 100 | 56 | 114 | 75 | 83 |
| July | 30 | 71 | 16 | 88 | 16 | 93 | 46 | 81 |
| Aug. | 21 | 65 | 23 | 67 | 36 | 70 | 52 | 62 |
| Sept. | 1 | 65 | 15 | 66 | 3 | 67 | 9 | 74 |
| Oct. | 62 | 55 | 45 | 62 | 50 | 57 | 38 | 61 |
| Total | 244 | 461 | 242 | 496 | 214 | 519 | 336 | 486 |
| Temp. | ---------------------------------------°C--------------------------------------- | |||||||
| April | 15 | 13 | 15 | 13 | 15 | 14 | 15 | 14 |
| May | 23 | 21 | 23 | 21 | 22 | 21 | 23 | 22 |
| June | 27 | 25 | 27 | 25 | 27 | 25 | 28 | 26 |
| July | 31 | 28 | 32 | 28 | 31 | 28 | 31 | 29 |
| Aug. | 28 | 27 | 29 | 28 | 28 | 27 | 27 | 28 |
| Sept. | 23 | 22 | 24 | 22 | 23 | 22 | 24 | 22 |
| Oct. | 11 | 13 | 11 | 14 | 11 | 13 | 12 | 14 |
3.2. Raised Seedbed
Levels of significance for agronomic traits for seedbed (flat or raised), cultivar, and various interactions averaged across environments are provided in Table 4. The 2012 growing season was dry throughout the region with below normal rainfall (Table 3), and no differences in agronomic traits were observed for the seedbed levels (Table 5). Yield components of plants ha-1, pods plant-1, and thousand kernel weight are reported as a reference dataset for soybeans in the geographic inference area of this research. Additionally, other yield component information such as number of pods with between one and four seeds per pod are reported to add to this reference dataset.
| SOV† | df | df‡ | SC | EV | LV | IDC§ | CC | PH | TKW | GY | |
|---|---|---|---|---|---|---|---|---|---|---|---|
| Environment (E) | 5 | 4 | - | - | - | - | - | - | - | - | |
| Rep (E) | 17 | 14 | - | - | - | - | - | - | - | - | |
| S[seedbed] | 1 | 1 | ns | ns | ns | ns | ns | ns | ns | ns | |
| S x E | 5 | 4 | ns | * | * | *** | * | * | ns | ns | |
| Error (a) | 17 | 14 | - | - | - | - | - | - | - | - | |
| C [cultivar] | 9 | 9 | *** | *** | ns | ** | ** | ** | *** | ns | |
| C x E | 45 | 36 | ns | ** | ** | *** | *** | *** | *** | ** | |
| S x C | 9 | 9 | ns | ns | ns | ns | ns | ns | ** | ns | |
| S x C x E | 45 | 36 | ns | ns | ns | ns | ns | ns | ns | ns | |
| Error (b) | 306 | 252 | - | - | - | - | - | - | - | - | |
| SOV† | df | PC | OC | LP | 1S | 2S | 3S | 4S | TS | TP | SP |
| Environment (E) | 5 | - | - | - | - | - | - | - | - | - | - |
| Rep (E) | 17 | - | - | - | - | - | - | - | - | - | - |
| S [seedbed] | 1 | ns | ns | ns | ns | ns | ns | ns | ns | ns | ns |
| S x E | 5 | * | ns | * | ns | ns | ns | ns | ns | ns | ns |
| Error (a) | 17 | - | - | - | - | - | - | - | - | - | - |
| C [cultivar] | 9 | *** | *** | *** | *** | *** | * | *** | *** | *** | * |
| C x E | 45 | ** | ** | ns | ns | ns | ns | ns | ns | ns | *** |
| S x C | 9 | ns | ns | ns | ns | ns | ns | ns | ns | ns | ns |
| S x C x E | 45 | ns | ns | ns | ns | ns | ns | ns | ns | ns | ns |
| Error (b) | 306 | - | - | - | - | - | - | - | - | - | - |
†SOV = source of variation, df =degrees of freedom, SC = stand count, EV = early vigor (28 June to 29 June), LV = late vigor (20 Aug. to 21 Aug.), IDC = iron deficiency chlorosis score, CC = canopy closure (at R6), PH = plant height, TKW = thousand kernel weight, GY = grain yield, PC = protein content, OC = oil content, LP = lowest pod height, 1S to 4S = number of pods per plant with one to four seeds, TS = total seeds per plant, TP = total pods per plant, SP = average seeds per pod.
‡df for five combined environments due to no visual IDC differences at Prosper.
§IDC is averaged over five environments due to no visual IDC differences at Prosper.
3.2.1. Environment x Seedbed
Analysis of variance showed an environment x seedbed interaction for IDC (Table 4). All environments besides Rothsay had no IDC effect with differing seedbed treatment. Ratings for IDC at Rothsay were 0.5 lower for plants grown on raised seedbeds while no differences were observed at the other environments (Table 6). In 2012, from the early to mid-part of the growing season, the Barnesville and Rothsay environments, as well as, many soybean fields across the RRNV region had noticeable IDC despite the dry weather.
| Seedbed | SC† | EV | LV | IDC‡ | CC | PH | TKW | GY | PC | OC |
|---|---|---|---|---|---|---|---|---|---|---|
| plants ha-1 | ----1-9§---- | 1-5¶ | % | cm | --g-- | kg ha-1 | ----g kg-1---- | |||
| Flat | 314 894 | 6.2 | 7.3 | 1.58 | 68 | 77 | 130.8 | 3 038 | 308 | 185 |
| Raised | 302 774 | 6.2 | 7.4 | 1.44 | 68 | 76 | 131.5 | 2 999 | 307 | 185 |
| LSD (0.05) | ns | ns | ns | ns | ns | ns | ns | ns | ns | ns |
| Seedbed | LP | 1S | 2S | 3S | 4S | TS | TP | SP | ||
| mm | --------------------------------------number------------------------------------ | |||||||||
| Flat | 116 | 3 | 11.3 | 15.1 | 0.4 | 72.5 | 29.8 | 2.4 | ||
| Raised | 114 | 3.3 | 12.1 | 16.8 | 0.5 | 80 | 32.7 | 2.42 | ||
| LSD (0.05) | ns | ns | ns | ns | ns | ns | ns | ns | ||
†SC = stand count, EV = early vigor (28 June to 29 June), LV = late vigor (20 Aug. to 21 Aug.), IDC = iron deficiency chlorosis score, CC = canopy closure (at R6), PH = plant height, TKW = thousand kernel weight, GY = grain yield, PC = protein content, OC = oil content, LP = lowest pod height, 1S to 4S = number of pods per plant with one to four seeds, TS = total seeds per plant, TP = total pods per plant, SP = average seeds per pod.
‡IDC is averaged over five environments due to no visual IDC differences at Prosper.
§Based on a visual score, with 9 being the most vigorous.
¶Based on the visual scale from Goos and Johnson (2008), with 5 being most chlorotic.
Soluble salts have been documented to induce IDC expression in soybean. Franzen and Richardson [18] found that electrical conductivity (EC) was correlated with chlorosis expression in soybean. At Barnesville and Rothsay, soil samples extracted from a 0 to 15 cm depth in a chlorotic plot of a flat seedbed treatment and a non-chlorotic plot of a raised seedbed treatment were tested for EC by the North Dakota State University Soil Testing Lab. Although soil sampling was not replicated, soil test results indicated that the EC at Barnesville was 2.3 and 1.5 dS m-1 in flat and raised seedbeds, respectively, and soil test results for Rothsay showed that EC was 2.8 and 1.6 dS m-1 in flat and raised seedbeds, respectively. The lower EC in the raised seedbeds might explain why IDC expression was lower on raised seedbeds at Rothsay. However, more replicated research is needed to confirm this finding.
| seedbed | Fargo (undrained) |
Fargo (drained) |
Barnesville | Hitterdal | Rothsay |
|---|---|---|---|---|---|
| ------------------------------------------1-5†------------------------------------------ | |||||
| Flat | 1.0 | 1.1 | 1.5 | 1.2 | 3.1 |
| raised | 1.1 | 1.0 | 1.4 | 1.2 | 2.6 |
| LSD(0.05) | ns | ns | ns | ns | 0.3 |
† Based on the visual scale from Goos and Johnson [27], with 5 being most chlorotic.
3.3. Cultivar
Cultivars were significantly different for stand count, early vigor, IDC, canopy closure, plant height, thousand kernel weight, protein content, oil content, lowest pod height, number of pods per plant with one to four seeds, total seeds per plant, total pods per plant, and average seeds per pod (Table 7). Cultivar 90-40 had the lowest stand count (230 253 plants ha-1) but produced the highest total seeds per plant (102.2) and highest total pods per plant (43) (Table 7). Total seeds per plant for cultivar DSR-0747/R2Y were second lowest (70.2), suggesting that at a high stand count, individual plants may produce fewer seeds.
In this research, cultivar 90Y70 had the least amount of IDC expression (1.28) and the second highest grain yield (3 129 kg ha-1) while cultivar 32RY08 had the highest expression of IDC (1.86) but the highest grain yield (3 180 kg ha-1).
3.3.1. Environment x Cultivar
In addition to a combined analysis significant effect for cultivar on IDC (Table 7), site-specific soybean variety selection is an interest of producers managing diverse fields and soil types (Table 8). Rothsay had higher overall IDC expression than any other environment. Cultivars DSR-0747/R2Y, 32RY08, and NS 0853RR tended to express the most chlorosis across all environments, except Hitterdal, where cultivars 90Y42 and 2703RR had the highest chlorosis expression (Table 8).
| Cultivar | SC† | EV | LV | IDC‡ | CC | PH | TKW | GY | PC | OC | LP | 1S | 2S | 3S | 4S | TS | TP | SP |
|---|---|---|---|---|---|---|---|---|---|---|---|---|---|---|---|---|---|---|
| plants ha-1 | ------1-9§------ | 1-5¶ | % | cm | g | kg ha-1 | ----g kg-1---- | mm | -------------------------number------------------------- | |||||||||
| AG 0231 | 320742 | 7.1 | 7.6 | 1.34 | 73 | 80 | 146.1 | 3002 | 305 | 179 | 100 | 2.6 | 9.9 | 15.0 | 0.5 | 69.3 | 28.0 | 2.46 |
| DSR-0747/R2Y | 333158 | 6.3 | 7.2 | 1.71 | 66 | 77 | 131.0 | 2952 | 306 | 181 | 111 | 2.8 | 10.7 | 14.5 | 0.6 | 70.2 | 28.7 | 2.44 |
| 90Y42 | 312723 | 6.4 | 7.5 | 1.46 | 70 | 79 | 131.9 | 3012 | 300 | 195 | 121 | 2.5 | 10.2 | 16.0 | 0.2 | 71.6 | 28.9 | 2.47 |
| 90Y70 | 316284 | 6.4 | 7.8 | 1.28 | 71 | 78 | 137.6 | 3129 | 314 | 186 | 139 | 2.6 | 10.9 | 16.0 | 0.4 | 74.0 | 29.9 | 2.48 |
| 32RY08 | 332416 | 5.9 | 7.2 | 1.86 | 64 | 78 | 131.6 | 3180 | 305 | 181 | 112 | 2.7 | 10.8 | 17.1 | 0.5 | 77.9 | 31.2 | 2.31 |
| HS 01RY02 | 286622 | 6.6 | 7.5 | 1.29 | 73 | 77 | 153.8 | 3074 | 303 | 181 | 110 | 2.7 | 9.9 | 15.0 | 0.6 | 70.3 | 28.3 | 2.49 |
| NS 0853RR | 309459 | 5.3 | 6.8 | 1.83 | 59 | 67 | 112.4 | 2968 | 312 | 185 | 110 | 2.2 | 11.5 | 15.7 | 0.1 | 72.7 | 29.5 | 2.36 |
| 90-40 | 230253 | 5.0 | 7.1 | 1.50 | 64 | 80 | 113.2 | 2877 | 303 | 190 | 120 | 4.9 | 17.5 | 20.3 | 0.3 | 102.2 | 43.0 | 2.35 |
| S02-K3 | 325355 | 6.3 | 7.3 | 1.45 | 66 | 77 | 129.1 | 2968 | 309 | 189 | 114 | 4.8 | 14.0 | 14.7 | 0.2 | 78.2 | 33.9 | 2.29 |
| 2703RR | 321329 | 6.4 | 7.6 | 1.40 | 73 | 74 | 124.5 | 3026 | 314 | 184 | 116 | 3.2 | 11.6 | 15.3 | 1.0 | 76.1 | 31.0 | 2.44 |
| Mean | 308834 | 6.2 | 7.4 | 1.51 | 68 | 77 | 131.1 | 3019 | 307 | 185 | 115 | 3.1 | 11.7 | 16.0 | 0.4 | 76.3 | 31.2 | 2.41 |
| LSD (0.05) | 35879 | 0.6 | ns | 0.33 | 8 | 6 | 7.1 | ns | 5 | 3 | 14 | 1.0 | 2.6 | 2.8 | 0.3 | 12.4 | 5.2 | 0.13 |
†SC = stand count, EV = early vigor (28 June to 29 June), LV = late vigor (20 Aug. to 21 Aug.), IDC = iron deficiency chlorosis, CC = canopy closure (at R6), PH = plant height, TKW = thousand kernel weight, GY = grain yield, PC = protein content, OC = oil content, LP = lowest pod height, 1S to 4S = number of pods per plant with one to four seeds, TS = total seeds per plant, TP = total pods per plant, SP = average seeds per pod.
‡IDC is averaged over five environments due to no visual IDC differences at Prosper.
§Based on a visual score, with 9 being the most vigorous.
¶Based on the visual scale from Goos and Johnson [17], with 5 being most chlorotic.
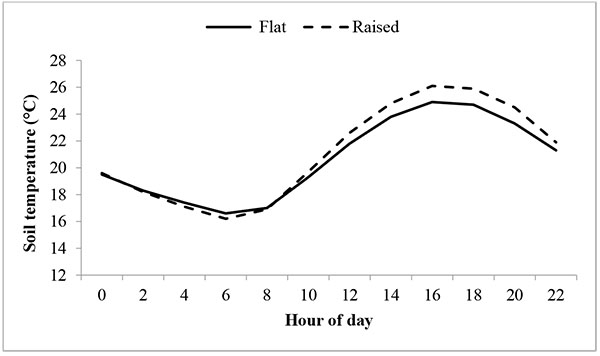
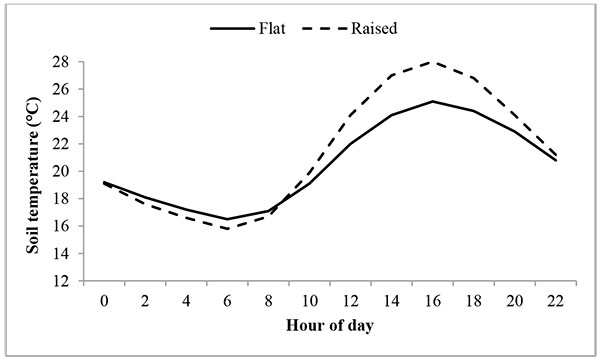
3.4. Soil Temperature
Analysis of variance (p≤0.10) across 60 days of sampling showed that soil temperature was significantly different between flat and raised seedbed treatments (Table 9). Soil temperature for hour of day was also significantly different, as expected, since the soil temperature would change according to air temperature throughout the day.
| Cultivar | Maturity Group |
Fargo (undrained) | Fargo (drained) | Barnesville | Hitterdal | Rothsay |
|---|---|---|---|---|---|---|
| -----------------------------------1-5†-------------------------------- | ||||||
| AG 0231 | 0.2 | 1.03 | 1.03 | 1.00 | 1.03 | 2.63 |
| DSR-0747/R2Y | 0.7 | 1.03 | 1.09 | 1.97 | 1.13 | 3.39 |
| 90Y42 | 0.4 | 1.00 | 1.00 | 1.10 | 1.48 | 2.69 |
| 90Y70 | 0.7 | 1.00 | 1.01 | 1.00 | 1.05 | 2.34 |
| 32RY08 | 0.8 | 1.19 | 1.14 | 2.20 | 1.30 | 3.51 |
| HS 01RY02 | 0.1 | 1.00 | 1.03 | 1.00 | 1.05 | 2.36 |
| NS 0853RR | 0.9 | 1.28 | 1.30 | 1.83 | 1.09 | 3.68 |
| 90-40 | 0.4 | 1.06 | 1.03 | 1.72 | 1.08 | 2.63 |
| S02-K3 | 0.2 | 1.06 | 1.04 | 1.20 | 1.18 | 2.75 |
| 2703RR | 0.3 | 1.00 | 1.00 | 1.12 | 1.43 | 2.44 |
| Mean | 1.07 | 1.07 | 1.41 | 1.18 | 2.84 | |
| LSD (0.05) | ns | 0.15 | 0.42 | 0.19 | 0.55 | |
†Based on the visual scale from Goos and Johnson [17], with 5 being most chlorotic.
| Mean square | |||
|---|---|---|---|
| SOV | df | Fargo | Hitterdal |
| Rep | 2 | 5.39 | 50.13 |
| S [seedbed] | 1 | 238.48* | 787.11* |
| Error (a) | 2 | 14.93 | 81.64 |
| H [hour] | 11 | 4 034.07*** | 5 057.47*** |
| S x H | 11 | 31.80 | 177.12*** |
| Error (b) | 4292 | 21.55 | 21.65 |
Averaged across hour of day, soil temperature was significantly warmer in the raised seedbed treatments at Fargo undrained and Hitterdal by 0.4 and 0.8 °C, respectively. At Fargo undrained, the soil temperature between the hours of 14:00 and 20:00 was significantly warmer in the raised seedbeds compared to the flat seedbeds. At Hitterdal, the soil temperature between the hours of 12:00 and 20:00 was also significantly warmer in the raised seedbeds than the flat seedbeds (Figs. 1-2).
3.5. Root Analysis
Two cultivars (01RY02 and NS 0853RR) at three environments (Prosper, Barnesville, and Hitterdal) were sampled and trends combined over both cultivars indicated an increase in root mass in raised seedbeds (Table 10). When averaged across cultivar and environment, root mass was 0.37 g root-system-1 higher for soybean grown on raised seedbeds.
| Seedbed | 01RY02 | NS0853RR | Mean |
|---|---|---|---|
| -------------g root-system-1------------- | |||
| Flat | 2.02 | 2.16 | 2.09 |
| Raised | 2.17 | 2.75 | 2.46 |
| LSD (0.10) | ns | ns | 0.30 |
4. DISCUSSION
4.1. Raised Seedbed
One of the main purposes of raised seedbeds is to promote growth and development of crops in poorly drained soils during wet conditions, which likely can translate into higher grain yield [4, 5, 17]. However, this current research was done in six environments during a year of below average moisture during the growing season (Table 3). The environments ranged from 150 mm below average from April through October, to 305 mm below average. Tomar et al. [29] suggested from research in India, that during periods of time with little rainfall, soybean grown on raised seedbeds may experience stress due to lack of moisture. However, our data show that in a dry year, grain yield from soybean grown on raised seedbeds was similar to the flat seedbed control. In addition, low IDC expression is expected with dry weather [19]. The results from these trials indicate that is not always the case, evident by the Rothsay IDC results (Table 8). Rothsay had higher overall IDC expression than any other environment and may be explained by the high EC at this site as indicated in the environment x seedbed results. It is important for agricultural producers to know that there is no negative effect on soybean yield on a raised seedbed under dry conditions. The expected yield benefit may be realized when excess rainfall events occur during the season.
Drainage categories of soils in this current research were not determined beyond what is characterized in the United States Department of Agriculture soil survey database in Table 1 [25]. However, all but one soil series in the trial are rated somewhat poorly drained or worse, indicating the general inference area of this research to be poorly drained soils. Bakker et al. [4] documented that crops grown on raised seedbeds in poorly drained soil conditions had increased grain yield each year of a five-year study, except for one dry year when grain yield was similar to the control.
4.2. Cultivar
Differences in IDC ratings for each cultivar in this research were expected since the cultivars were selected based on their known IDC expression. Froehlich and Fehr [20] found a linear relationship between the amount of chlorosis expression in plants and total grain yield reduction. At Rothsay where IDC was prevalent, a direct relationship between IDC expression and reduced grain yield was moderate (r2 = 0.62) and is similar to research by Froehlich and Fehr [20]. Yield components were made in diverse ways as reported in Table 7. Yield components for modern soybean varieties in ND and MN is lacking in published research. The dataset presented from this research can serve as a reference for the way yield components are made in dry environments.
4.3. Soil Parameters and Root Growth
Soil temperature was increased in the raised bed compared to the flat seedbed in both locations where these measurements were taken (Figs. 1-2). Research conducted by Benjamin et al. [21] and Shaw and Buchele [24] also found soil temperatures to be higher in raised seedbeds as compared to flat seedbeds. Given the limiting resource during the 2012 growing season in this research geographic area was moisture, the increased temperature found here might be most beneficial for plant when coupled with adequate soil moisture. Assuming the trend of higher temperature in a raised bed compared to a flat seedbed, warmer soil temperatures by a few degrees during the summer sunlight part of the day between approximately 9:00 and 21:00 hours could be beneficial during planting, germination, and early seedling growth. In theory, a warm-season broadleaf could benefit from accelerated germination and early season emergence, growth, and vigor, by warmer soil temperatures in a raised bed. Another benefit from warmer soil temperatures in the spring from a raised bed could be earlier planting of the crop, likely resulting in greater soybean yield.
The root mass data from this research showed a positive increase in root mass with raised beds compared to the flat seedbed. Root growth was likely due to lower soil bulk density in the raised seedbeds [4, 30]. Root mass in this study was taken on a small subset of the plots, and could have benefitted from a more robust sampling to further verify the findings. Research conducted in central India found that soybean productivity increased when grown on raised seedbeds and observed root mass to be the greatest in raised seedbeds when compared to the flat seedbed control [9].
CONCLUSION
Raised seedbed research across six environments in 2012 indicated that soybean growth and grain yield was not reduced when grown on raised seedbeds in a year with below normal seasonal rainfall at all environments. At the Rothsay environment where IDC was pronounced across the experiment area, IDC expression was reduced for plants grown on raised seedbeds. This research, under dry environmental conditions, suggests that raised seedbeds may be an effective annual practice in soybean production of the RRNV, or locations with similar soil type and weather patterns, assuming a positive yield response in years with average to above average moisture. Additional research is needed to confirm this in more environments.
Higher soil temperatures and greater root mass were observed in the raised seedbeds as compared to the flat seedbed control. Soil temperatures throughout the daylight hours of the day (10-20 h of day) were higher in the raised seedbeds at the two environments tested (Fargo and Hitterdal). Higher soil temperatures in raised seedbeds should accelerate seed germination and seedling growth in northern climates like the RRNV.
Root growth for this research was found to be greater in the raised seedbeds. Raised seedbed heights were formed to an initial height of 19 cm in fall 2011. Raised seedbeds were not reformed throughout the next year and settled to 13 cm by fall 2012. The higher soil temperatures and increased root mass noticed in raised seedbeds for this research suggest that raised seedbeds have a potential to increase soybean productivity; however, additional research is needed in diverse environments to be conclusive.
LIST OF ABBREVIATIONS
| CC | = Canopy closure |
| EC | = Electrical conductivity |
| EV | = Early vigor |
| GY | = Grain yield |
| IDC | = Iron deficiency chlorosis |
| LV | = Late vigor |
| LP | = Lowest pod height |
| MN | = Minnesota |
| ND | = North Dakota |
| NDAWN | = North Dakota Agricultural Weather Network |
| OC | = Oil content |
| PH | = Plant height |
| PC | = Protein content |
| RRNV | = Red River of the North Valley |
| SC | = Stand count |
| SP | = Average seeds per pod |
| TKW | = Thousand kernel weight |
| TP | = Total pods per plant |
| TS | = Total seeds per plant |
| 1S | = Number of pods per plant with one seed |
| 2S | = Number of pods per plant with two seeds |
| 3S | = Number of pods per plant with three seeds |
| 4S | = Number of pods per plant with four seeds |
ETHICS APPROVAL AND CONSENT TO PARTICIPATE
Not applicable.
HUMAN AND ANIMAL RIGHTS
No Animals/Humans were used for studies that are base of this research.
CONSENT FOR PUBLICATION
Not applicable.
CONFLICT OF INTEREST
The authors of this manuscript certify they have no affiliations of financial involvements in the subject matter discussed in this manuscript.
ACKNOWLEDGEMENTS
The authors are grateful to the North Dakota Soybean Council and DuPont Pioneer for financial support to the field research presented in this article and the graduate students assisting with this research.

