All published articles of this journal are available on ScienceDirect.

AgriSphere: A Smart Agriculture Framework Integrating IoT and Artificial Intelligence for Adaptive Crop Selection
 iD
iD
Authors Info & Affiliations
Abstract
Introduction
Rapid climate change, soil degradation, and changing environmental conditions make crop selection difficult for farmers. This study proposes an IoT- and AI-based framework to recommend suitable crops using current soil conditions and future weather forecasts. It also identifies the key environmental factors influencing crop selection.
Methods
A three-layer architecture was designed with data collection, communication, and data processing modules. Real-time data on nitrogen, phosphorus, potassium, pH, temperature, and humidity were collected through IoT sensors and combined with rainfall and historical agricultural data. A dataset containing multiple environmental features and 22 crop classes was used for model development. Machine learning and deep learning methods, including Random Forest, XGBoost, K-Nearest Neighbours (KNN), Support Vector Machines (SVM), Convolutional Neural Networks (CNN), Decision Trees (DT), Deep Neural Networks (DNN), and Long Short-Term Memory (LSTM), were applied for classification and forecasting. Performance was evaluated using accuracy, F1-Score, MAE, RMSE, and R2. Pareto analysis was also performed to identify the most influential parameters.
Results
Random Forest and CNN achieved the highest classification accuracy of 99.54% with an F1-Score of 0.995, while XGBoost also performed strongly with 99.32% accuracy. Regression analysis showed that ensemble models outperformed linear models. Pareto analysis revealed that rainfall, humidity, and potassium were the most influential factors in crop recommendation. In a real-time case study, the framework recommended rice as the most suitable crop for the given input conditions.
Discussion
The results show that integrating IoT sensing with AI-based forecasting supports proactive crop planning before sowing and improves sustainable farming decisions under changing climate conditions.
Conclusion
The proposed framework effectively combines real-time monitoring, predictive analytics, and intelligent crop recommendation, offering a practical foundation for scalable precision agriculture systems.
1. INTRODUCTION
Agriculture, the backbone of food security and rural economies, is entering an era of unprecedented uncertainty driven by rapidly changing environmental parameters. The interplay of shifting monsoon patterns, rising average temperatures, altered rainfall intensity and distribution, and increasing frequency of extreme weather events is disrupting traditional cultivation cycles [1]. Soil nutrient profiles are deteriorating due to continuous monocropping, overuse of chemical fertilizers, and reduced organic matter content, while salinity and pH imbalances are emerging in once-fertile regions [2]. Simultaneously, pest and disease dynamics are evolving, with new infestations occurring outside their historical geographical ranges due to microclimatic shifts [3]. Under such volatile conditions, farmers can no longer rely solely on generational experience or historical yield records to guide planting decisions. An incorrect crop choice in this uncertain agro-climatic context may lead to yield losses, translating into severe economic distress and threatening regional food supply chains [4].
The recent advances in Internet of Things (IoT), machine learning (ML), and deep learning (DL) present a transformative opportunity to mitigate these risks through precision, data-driven decision support systems [5]. The IoT-enabled agricultural sensor networks can continuously monitor and capture high-resolution data on critical soil health parameters, including nitrogen, phosphorus, potassium, micronutrient levels, pH, and microclimatic variables like ambient temperature, humidity, and rainfall. This continuous monitoring helps to identify deficiencies and guide countermeasures such as fertilizer application. By continuously applying fertilizers without predictive insight, soil degradation may accelerate, reducing future agricultural potential and potentially introducing health and environmental hazards.
Marginal degradation of soil, environment, and human health due to over-fertilization happens largely because farmers lack predictive insight into drastic climatic changes. With predictive knowledge of changing climate conditions, farmers can choose crops resilient to future shifts, thereby reducing excessive fertilizer use and maintaining a sustainable and profitable farming environment.
In line with this challenge, we propose a model that collects heterogeneous data streams from soil health and microclimatic IoT devices and combines them with historical data. This aggregated data is fed into an artificial intelligence framework using advanced ML and DL algorithms to generate insights about expected soil conditions and future climatic changes. The proposed model helps suggest optimal crops for specific regions based on predicted environmental conditions, unlike existing models that provide nutrient recommendations only after crop seeding. By enabling pre-seeding crop selection aligned with future climatic trends, the framework reduces fertilizer usage, preserves soil health, and promotes sustainable agriculture.
Hence, this work proposes a framework for integrating real-time environmental monitoring with adaptive AI-driven forecasting. The resulting decision support system can deliver region-wise recommendations on optimal crop varieties, sowing windows, irrigation schedules, and nutrient management plans. The framework leverages multi-modal sensor inputs, historical and forecasted climatic data, and advanced AI techniques to empower farmers with actionable intelligence, bridging the gap between computational research and pragmatic application in climate-stressed agriculture. This integration reduces the probability of catastrophic yield losses while supporting sustainable resource utilization, soil restoration strategies, and long-term agro-ecosystem resilience.
2. LITERATURE REVIEW
Recent research has increasingly focused on integrating the IoT, machine learning, and deep learning into agricultural decision support. IoT-enabled sensor networks can monitor key soil and microclimatic parameters such as nitrogen (N), phosphorus (P), potassium (K), pH, temperature, humidity, and rainfall with high temporal resolution [6]. When combined with ML and DL techniques, these real-time data streams enable predictive analytics and insights for optimizing crop selection, resource use, and yield stability [7]. This shift represents a strategic move away from experience-based decisions toward continuous, evidence-based recommendations that can adapt to changing environmental conditions [8].
Several IoT and ML crop recommendation systems have demonstrated the feasibility of such integration. The importance and advantages of edge computing in smart agriculture are described in [9], with its retail, financial, and agricultural benefits. The edge computing facility can provide better service than a traditional cloud-based system. Using real-time soil nutrient data, the work [10] recommends appropriate crops depending on environmental parameters using machine learning and deep learning models. While these works illustrate the potential of IoT–ML integration, they operate reactively - making recommendations from current-state data without modeling how soil and climate parameters will evolve, and without quantifying uncertainty in predictions [11].
Research on crop yield prediction further highlights the value of advanced modeling. Zhaoyu et al. reviewed 50 ML-based studies, identifying temperature, rainfall, and soil type as the most common features, and noting the increasing adoption of CNNs, LSTMs, and DNNs for capturing spatiotemporal dependencies [12]. Although such models are powerful for yield estimation, they are generally developed for specific prediction tasks and seldom integrated with IoT-based real-time sensing or crop recommendation workflows. Oleiro et al., describe architectures for real-time sensing, edge/cloud analytics, and adaptive control, but remain focused on operational monitoring rather than pre-sowing, climate-informed decision-making [13]. The more detailed literature review about the artificial intelligence-enabled smart agricultural systems is listed in Table 1.
| Ref. | Objectives of the Research | Research Outcome | Research Gaps and Future Scope |
|---|---|---|---|
| [14] | Combining smart sensors, IoT, and machine learning helped develop a system that optimized crop selection based on soil properties and weather patterns. | The accuracy score and energy usage of the prediction model meet the required criteria in terms of accuracy score and energy utilization. | Needs to be scaled by employing more sensors in the sensory layer to capture more data on parameters of soil for more refined prediction. |
| [15] | To develop integrative IoT–ML–AI frameworks for early disease detection and forecasting under climate change scenarios. | Demonstrated effective use of IoT sensors and ML models for real-time disease forecasting, improving early-warning systems in precision agriculture. | Limited generalizability across regions; future research should incorporate uncertainty quantification and multi-climate validation. |
| [16] | To compare DL and ML techniques in predicting crop yield and identify the best-performing models. | Found that DL architectures (e.g., Long Short-Term Memory (LSTM), Convolutional Neural Networks (CNN)) outperform classical ML models in capturing nonlinear crop–climate interactions. | High computational costs; future scope lies in lightweight, interpretable models and hybrid DL–ML approaches for broader adoption. |
| [17] | To predict agricultural drought indicators across varying climate and land-use conditions using ML. | Demonstrated ML models’ effectiveness for drought risk prediction across heterogeneous regions. | Did not include deep learning or spatiotemporal uncertainty modeling; future work could use DL with remote sensing for robust drought forecasting. |
| [18] | Proposed hybrid AI-based federated ML/DL models for soil component classification. | Introduced federated learning techniques for soil classification without centralizing data. | Focused only on classification; future work should extend federated frameworks to yield prediction, disease detection, and resource optimization. |
| [19] | To explore AI, ML, DL, and IoT for sustainable agriculture and future farming. | Presented a conceptual framework for sustainable farming using emerging technologies. | Largely theoretical; future scope involves real-world pilots, scalability testing, and integration with edge/fog computing for efficiency. |
| [20] | To identify IoT in hill areas for agriculture. | How IoT-enabled devices can integrate in hill regions. | Theoretical explanation, lack of how it can be implemented. |
| [21] | To present a comprehensive review of AI/ML models for environmental sustainability. | Surveyed AI applications in agriculture, climate monitoring, and sustainability practices. | In real-time deployment, the scalability of different machine learning models are resource-constrained environments. Future research may explore lightweight, explainable AI solutions. |
| [22] | To develop an ML-enabled IoT system for soil nutrient analysis and crop suggestion. | Proposed an IoT architecture with ML algorithms to predict soil nutrients and recommend crops. | Did not deeply incorporate predictive uncertainty and climate forecasts; future work could integrate DL forecasting and risk-aware recommendations. |
| [23] | To explore AI applications in climate-resilient smart crop breeding. | Identified AI techniques to enhance breeding strategies for resilience against climate change. | Lack of integration with IoT and real-time environmental data; future research could fuse genomics with IoT-driven crop monitoring. |
| [24] | With the help of ML models and remote sensing, the work designs a computing model for flood prediction and an early warning system. | Developed a fog-based ML model for flood forecasting and alerts. | Narrow scope limited to flood prediction; future scope includes integrating crop damage estimation and multi-hazard early warning systems |
| [25] | To review edge computing in agricultural IoT systems. | Provided a basic technological and challenges overview of edge-based agriculture. | Mainly theoretical; future work requires practical field validation and integration with ML/DL-based decision support. |
| [26] | A classification model is proposed for crop recommendation with edge computing and deep learning. | Demonstrated a DL-based system with edge computing for accurate real-time crop classification. | Focused on classification; future scope should expand to predictive analytics and uncertainty handling. |
| [27] | To optimize smart agriculture using AI and edge computing for enhanced crop management. | Introduced an integrated framework combining edge AI for better crop monitoring and resource optimization. | Limited evaluation across diverse climates and soil types; future research should validate framework scalability with large datasets. |
The vast body of research indicates that selecting the appropriate crops for the agricultural sector in light of the approaching climate change is essential to the final result. Production yields are impacted by soil conditions and current and upcoming climate changes. There are very few studies that concentrate on future climate change in the future and the 80/20 analysis [28]. This work projects the predictive behaviours of the most influential agricultural metrics using a variety of machine learning and deep learning models. This predictive projection helps to identify the most suitable crops for the farm fields. The Pareto analysis in this work aids in identifying the dataset's most significant characteristics that have a greater impact on plant development. The diverse set of algorithms and the cross-validation techniques in this work quantify how this predictive forecast of a 12-month horizon helps provide region-specific, pre-sowing crop recommendations that are robust, interpretable, and adaptable to projected climatic conditions.
3. PROPOSED METHODOLOGY
A three-layered IoT-enabled intelligent crop recommendation system is proposed in this work, and the architecture of this intelligent model is shown in Fig. (1). Layer one is a sensor-enabled layer, which can sense and measure the ambient soil and climatic properties in real time and send that information to an external MongoDB cloud server for storage and analysis [29]. Layer two is dedicated to uninterrupted data exchange between the cloud server and the IoT devices, and layer three is purely designed for pre-processing and analysis of collected data for region-specific crop suggestions with predictive climatic insights. The detailed overview of these three layers is described below.
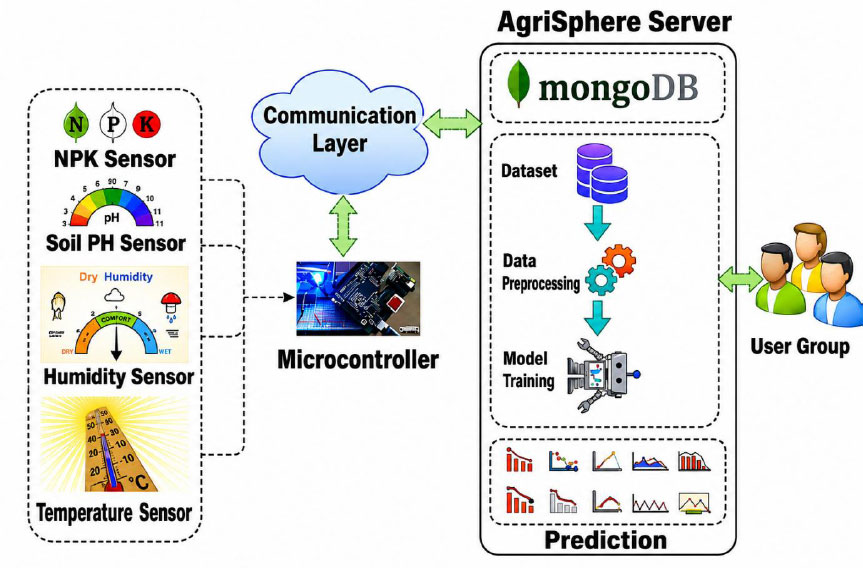
AgriSphere – the proposed model.
3.1. Data Collection Layer
The data collection unit has been designed so that all sensor modules collaborate to take data from various locations within a specific period of time. The NPK sensor measures the quantity of the three macronutrients potassium, phosphorus, and nitrogen in soil. The concentration of macronutrients in the soil is a way for a farmer to calculate the nutritional status [30]. The pH sensor identifies the acidity or alkalinity of the soil and therefore determines the suitability of a given soil for a specific crop. Temperature and humidity sensors are attached to calculate environmental data relevant to plant growth [31].
To create forecasted values of average rainfall using historical datasets, rainfall data is obtained from a repository maintained by different regions. The data collection layer assists in collecting baseline data at different locations to gain clear insight into drastic changes in soil and climate [32].
In this experiment, the openly available crop recommendation dataset from the IEEE data portal has been used, which includes 2,200 entries. The dataset has seven numeric inputs as follows: Nitrogen (N), Phosphorus (P), Potassium (K), temperature (T), humidity (H), pH, and rainfall. The parameters mentioned above are the major soil nutrients and climatic factors, which affect the growth of crops. Thus, all these values are used as the input variables for the regression and classification phases of the framework. There are 22 crop classes in the selected dataset, and these classes include: Rice, Pomegranate, Coffee, Chickpea, Pigeon-pea, Black-gram, Watermelon, Mung-beans, Mango, Banana, Grapes, Apple, Muskmelon, Maize, Lentil, Orange, Coconut, Kidney-beans, Jute, Cotton, Moth-beans, and Papaya. The dataset is well-balanced, and class imbalance is reduced because each class has 100 samples. Table 2 provides information on the statistical characteristics of the dataset and the distribution of each parameter.
| N | P | K | Temperature | Humidity | pH | Rainfall | |
|---|---|---|---|---|---|---|---|
| Count | 2200 | 2200 | 2200 | 2200 | 2200 | 2200 | 2200 |
| Mean | 50.56 | 53.3 | 48.16 | 25.62 | 71.48 | 6.48 | 103.4 |
| Std | 36.9 | 32.98 | 50.66 | 5.07 | 22.27 | 0.7 | 54.97 |
| Min | 0.00 | 5.01 | 5.01 | 8.84 | 14.27 | 3.51 | 20.22 |
| 25% | 21.0 | 28.0 | 20.0 | 22.70 | 60.27 | 5.90 | 64.56 |
| 50% | 37.01 | 51.00 | 32.01 | 25.60 | 80.46 | 6.44 | 94.88 |
| 75% | 84.26 | 68.00 | 49.0 | 28.57 | 89.96 | 6.93 | 124.28 |
| Max | 140.0 | 145.0 | 205.0 | 43.69 | 99.99 | 9.95 | 298.57 |
3.2. Communication Layer
The designed IoT architecture utilizes an ESP32 microcontroller to collect soil and environmental readings from the linked NPK, soil pH, and DHT11 humidity and temperature sensors at all times. The reading from each sensor is tagged with a unique device ID and region ID, thus allowing the system to differentiate between readings from distinct sensor nodes and regions. Once the sensor readings are collected, the microcontroller authenticates the readings and formats them into a JavaScript Object Notation (JSON) message that includes the device ID, region ID, timestamp, and the relevant environmental readings. The lightweight JSON message serves as an efficient and platform-agnostic means of conveying heterogeneous sensor readings with essential metadata. The JSON message generated by the system is sent wirelessly to the cloud using the built-in IEEE 802.11 Wi-Fi communication technology on the ESP32 module. In the cloud, the data is collected and stored by MongoDB, a NoSQL database system that allows storing document-oriented data in real-time coming from several distributed sensor nodes. The design of MongoDB allows storing heterogeneous data from different networks without using a fixed schema, thus allowing scalability when more sensors are added to the network. The stored data may then be processed, filtered, and exported in the Comma Separated Values (CSV) format for further analysis, prediction, and making recommendations on crop planting.
3.3. Data Processing and Prediction
The methodology suggested in the current research is based on a systematic approach consisting of data pre-processing, exploratory analysis, environmental parameter prediction, crop classification, model verification, feature prioritization, and real-time decision-making support. Given that the input data are gathered through the use of a heterogeneous sensor network, IoT devices, and a rainfall observation system, various problems related to measurement errors, missing values, and noise can occur during the process of collecting the data. For this reason, the collected sensory and rainfall data are subject to thorough pre-processing in terms of data cleaning, transformation, normalization, and quality control. Then, exploratory data analysis is conducted in order to study the properties of the dataset under consideration, whereas the correlation analysis is done to identify connections between soil and environmental parameters.
The dataset thus obtained is used in a two-level approach towards prediction. In the first level, different types of regression techniques, such as linear regression, ridge regression, lasso regression, ElasticNet, random forest, gradient boosting, XGBoost, and support vector regression (SVR), are applied in order to predict future environmental factors. The predicted environmental factors are then used as inputs for the crop recommendation system. In the second level, a few classifiers from machine learning and deep learning domains are tested to determine which classifier is best suited for making crop recommendations based on various climatic factors. The decision tree (DT) is used as an explainable base model, while random forest and XGBoost models make use of ensemble learning to model complicated nonlinear feature interactions. The support vector machine model is used because of its ability to build robust decision boundaries in high-dimensional feature space, while the K-Nearest Neighbors model uses an instance-based learning approach for comparison. Deep learning models are included in order to analyse their ability to learn complex feature representations. In particular, deep neural networks learn complicated nonlinear interactions among soil and climatic variables, CNNs learn discriminative feature representations from the multivariate data, and LSTM networks are used to model temporal dependencies among environmental and rainfall data.
The developed models will be trained using an 80:20 ratio of training to test set and validated using cross-validation techniques to achieve robustness, stability, and generalizability. Performance evaluation will be done using mean squared error (MSE), root mean square error (RMSE), coefficient of determination (R2), accuracy, F1-score [33, 34], and analysis of the confusion matrix. Detailed comparative performance evaluation of the regression and classification models is provided in sections 4.3 and 4.4. In addition, Pareto analysis will be used to determine the priority of the environmental and soil variables that have the greatest influence on the crop recommendation. Results of the feature prioritization are provided in section 4.5. In the final stage, the performing model will be embedded in the cloud-based decision-making platform, which provides real-time crop recommendations based on soil type under expected climatic conditions. The framework uses 7 environmental parameters for 22 crop types grown in different regions, and the cloud-based user interface displays predicted soil and atmospheric conditions along with crop recommendations.
4. RESULTS AND DISCUSSION
The experimental setup shown in Fig. (2) consists of three components: the cloud server, MongoDB repository, and microcontroller. A JSON-based MongoDB cloud-based NoSQL database is used to store sensor data. It is particularly suitable for Internet of Things applications due to its schema-less characteristics. This open-source platform makes real-time data collection, storage, and visualization possible. The connected cloud server allows real-time data analysis and prediction, promoting an understanding of smart farming. ESP32 is an open-source development board and firmware used for the easy integration of Internet of Things applications. The sensors-including NPK, soil pH, and DHT11 humidity/temperature-are installed in a laboratory set up in Ettimadai, Coimbatore, in the western part of India during the summer season at different fields located across multiple areas and are connected to the microcontroller. The measurements of soil nutrients were taken by RS485 Soil NPK Sensor with a range of 0–1999 mg/kg and an accuracy of ±5% for N, P, and K. The measurement of soil pH was taken by an RS485 Digital Soil pH Sensor with a measurement range of 0–14 pH and an accuracy of ±0.1 pH. The measurements of environmental parameters such as temperature and humidity were made using the DHT11 sensor with a measurement range of −40°C to 80°C (±0.5°C) and 0–100% RH (±2% RH). The environmental parameters were sampled at 1 Hz, and the recorded data were averaged and saved every 1 minute. The recorded data is sent to the MongoDB database within the defined time period.
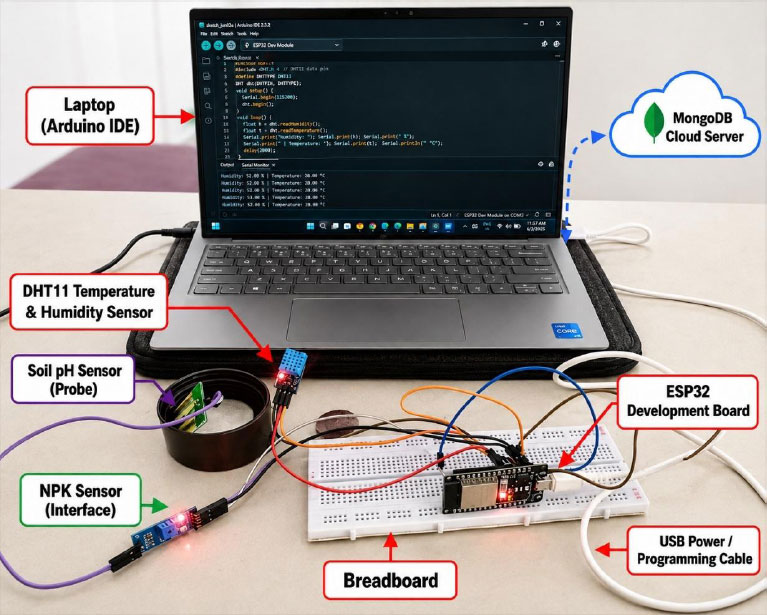
Experimental setup.
To determine the most suitable crops for the analyzed soil samples and to predict their expected behavior in the future, the system compares live sensor measurements with a learned model. Figure 3 shows the collected sensor data at the MongoDB server. Exploratory data analysis is performed for cleaning and preprocessing, correlation heatmaps are generated to identify relationships between dataset features, and final results are predicted using different ML and DL algorithms. Evaluation and performance comparisons are then carried out. Tables 3 and 4, illustrate the relative results of various algorithms and the findings of the proposed system regarding the most appropriate crops to be planted in the soil samples.
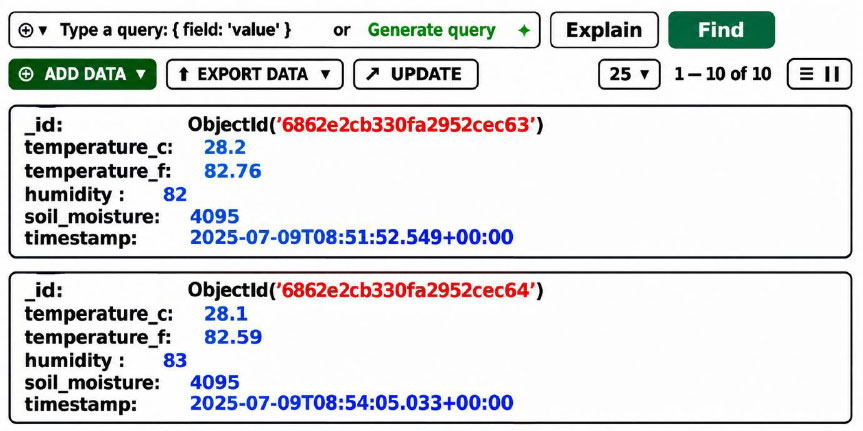
Sensor data at cloud server.
| Model | Accuracy | F1 Score |
|---|---|---|
| CNN | 0.995455 | 0.995452 |
| Random Forest | 0.995455 | 0.995452 |
| XGBoost | 0.993182 | 0.993116 |
| SVM | 0.984091 | 0.984038 |
| KNN | 0.979545 | 0.979283 |
| Decision Tree | 0.979545 | 0.979423 |
| DNN | 0.975000 | 0.974967 |
| LSTM | 0.970455 | 0.970399 |
| Model | MAE | RMSE | R2 Score | CV_Mean | CV_Std |
|---|---|---|---|---|---|
| Linear Regression | 6.683 | 11.863 | 0.699 | 0.729 | 0.017 |
| Ridge | 6.684 | 11.862 | 0.699 | 0.729 | 0.017 |
| Lasso | 6.683 | 11.859 | 0.699 | 0.729 | 0.017 |
| ElasticNet | 6.685 | 11.857 | 0.699 | 0.729 | 0.017 |
| Random Forest | 5.838 | 9.779 | 0.719 | 0.728 | 0.020 |
| Gradient Boosting | 5.912 | 9.916 | 0.714 | 0.735 | 0.017 |
| XGBoost | 6.644 | 11.364 | 0.694 | 0.715 | 0.014 |
| SVR | 7.965 | 14.288 | 0.653 | 0.668 | 0.011 |
4.1. Exploratory Data Analysis
The MongoDB server acts as a NoSQL database repository for storing the unstructured data. The generated data volume became very large due to the large number of sensor units connected to the server. The collected data are analysed to gain more insights about the farming fields, crops, and weather forecasting. To understand the data distribution, quality, and underlying patterns, univariate analysis is performed. This analysis helps to identify the patterns and trends without considering the relationships with other variables. Figure 4 displays the distribution of the four selected input features from the total seven input features that have been considered for recommending crops, which are nitrogen (N), phosphorus (P), potassium (K), temperature, humidity, pH, and rainfall. From the histograms, it is observed that there are various distributions in each feature because of the variation in soil nutrient values and environmental conditions in different regions. From the dataset observation, features such as nitrogen, phosphorus, potassium, and rainfall show different levels of skewness and multimodality, implying varied agricultural and climate environments.
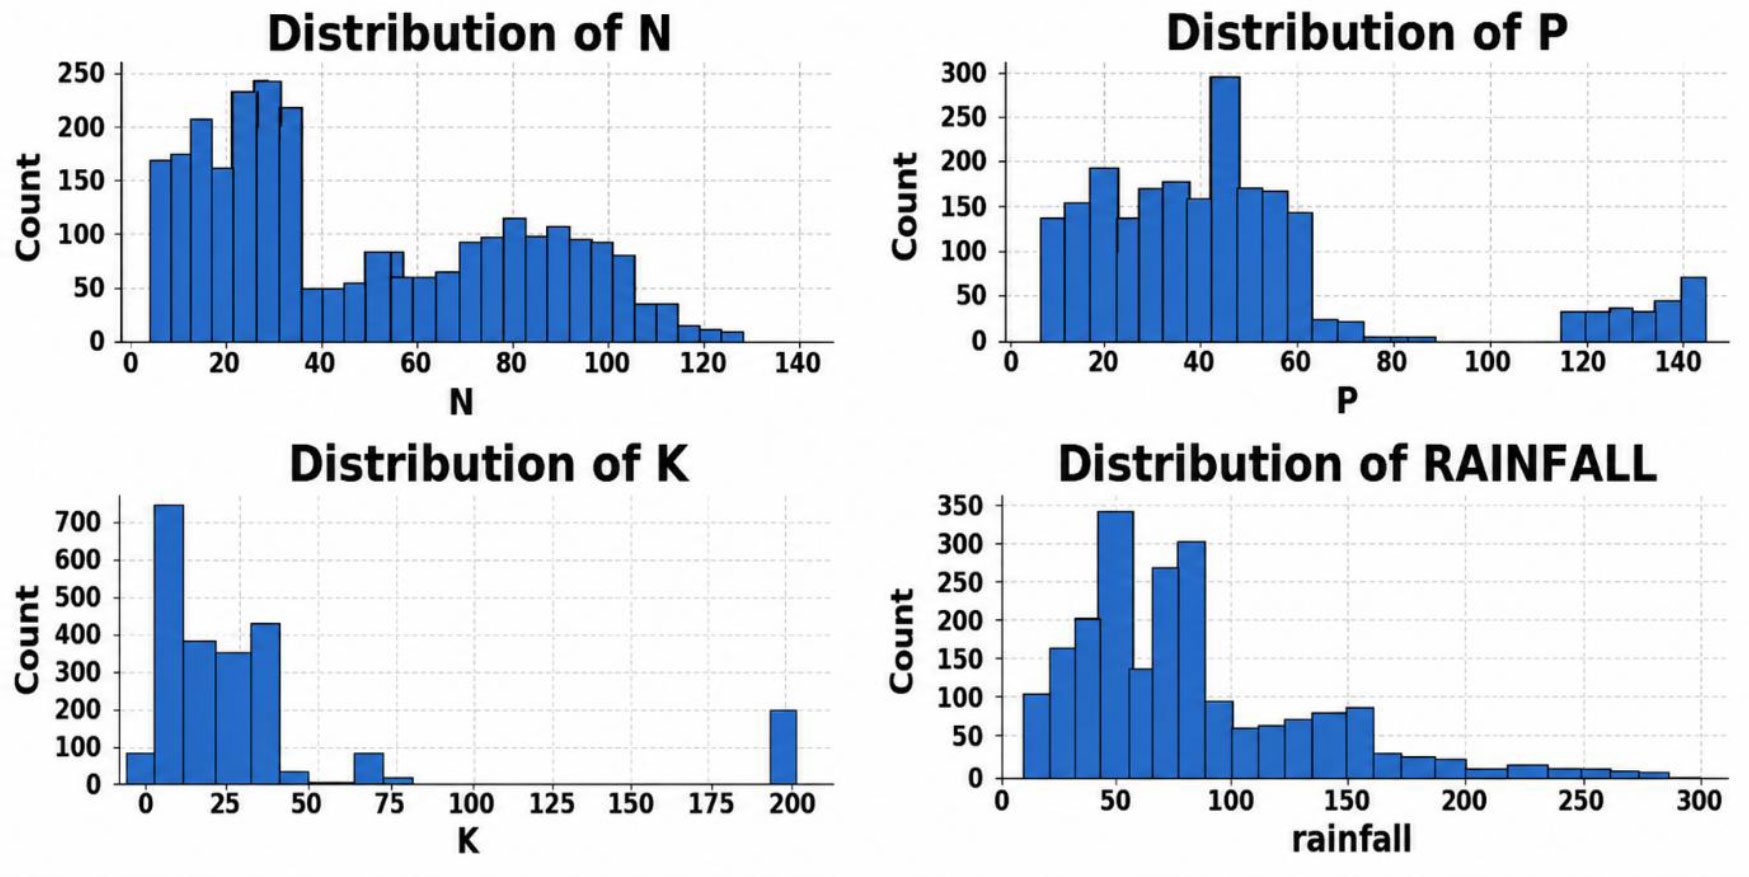
Univariate analysis (N, P, K, Rainfall).
The bivariate analysis identifies the relationship between the features of the dataset and the values that are required. The features of each dataset are plotted on the x-axis, whereas the target features are plotted on the y-axis. The scatter plot of the bivariate analysis helps in identifying outliers by showing the minimum and maximum distribution of the data of the target. Figure 5 is the plot representing the bivariate relationship between four environmental variables and six selected crop classes (rice, banana, mango, apple, cotton, coffee). As evident from the results of the analysis, the environmental and nutrient requirements of each crop class are unique, thus, making these variables effective in discriminating crop types. Nitrogen (N), phosphorus (P), and potassium (K) levels vary significantly across these crops, implying that the crops have unique nutrient requirements. For instance, there is a wide range of values of potassium among certain crops, signifying the effect of potassium on the crops.
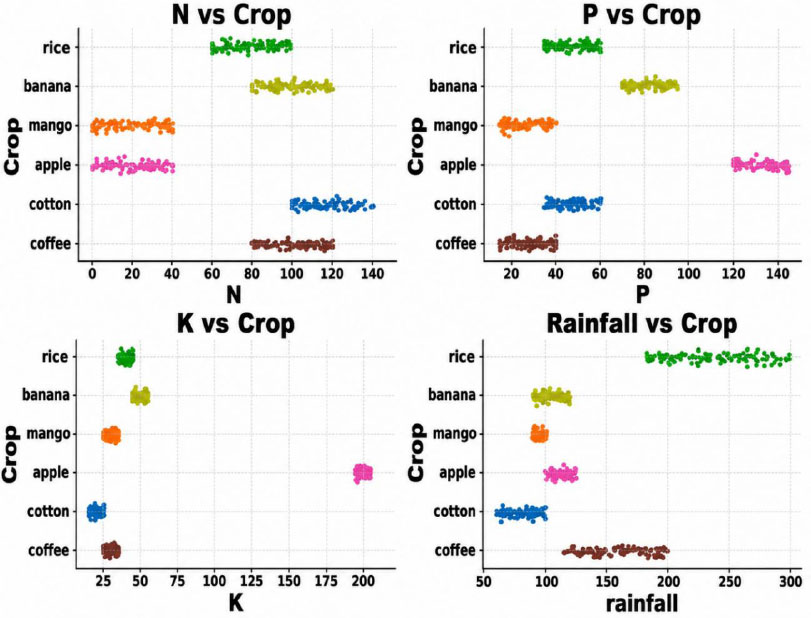
Bivariate analysis of crops: rice, banana, mango, apple, cotton, coffee.
On the other hand, the important climatic variable, rainfall, also varies uniquely depending on the type of crop. Some of the crops require narrow ranges of climatic conditions while others do not, hence signifying different levels of adaptability. The rainfall values vary more widely among different crops, thus making this environmental variable useful in distinguishing crops grown in different agro-climatic regions. From the foregoing, the bivariate analysis affirms that each environmental variable plays a unique role in crop discrimination and none of them, by itself, is enough for crop recommendation. The interaction of soil nutrient levels and climate variables makes a complete description of crop suitability.
Once all the features of the dataset are identified, the potential outliers of the dataset are identified with the help of boxplot visualization. Outlier identification and removal from the dataset help to improve the prediction accuracy. Boxplots of the selected six crops (rice, banana, mango, apple, cotton, coffee) with respect to the four features (N, P, K, rainfall) are shown in Fig. (6), which depicts their medians, interquartile range (IQR), variability, and any outlier values. Nutrient attributes (N, P, and K) display a certain degree of variation among these crops, suggesting that each crop has different nutrient needs, with potassium being the most variable among all the nutrient factors. The feature rainfall has a wider distribution due to varying climate needs between different crops. The outliers present are due to natural environmental variability and not inconsistencies in the data. From this, we can see that the features used are highly discriminative enough in terms of differences, making them appropriate for crop recommendation using machine learning and deep learning algorithms.
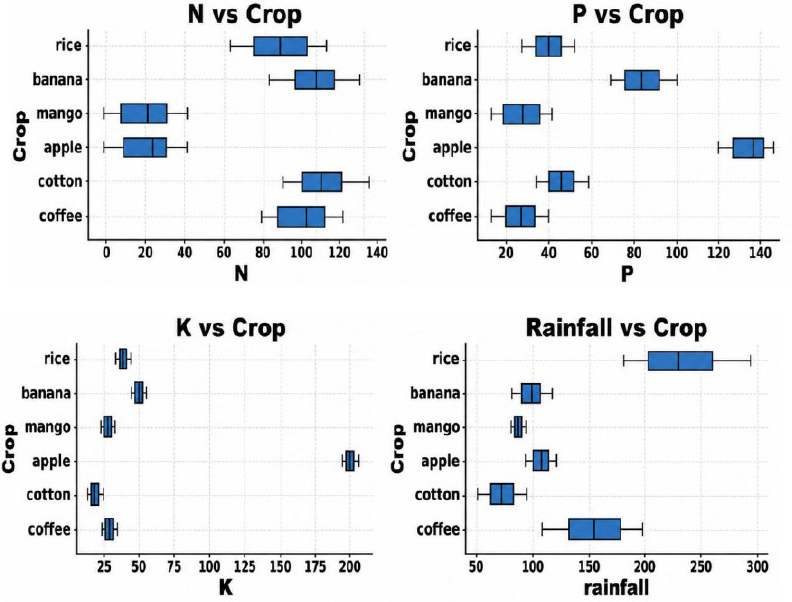
Box plot analysis of crops rice, banana, mango, apple, cotton, coffee.
4.2. Correlation Analysis
The correlation heatmap for the seven input features for crop recommendation is presented in Fig. (7). It can be seen that most of the variables have weak to moderate correlation with one another, meaning that all of these factors provide unique information during the process of prediction with no problems regarding multicollinearity. It was noted that there is a significant positive correlation between P and K (0.74). A weak positive correlation is seen between temperature and humidity (0.21). Other variable pairs have low positive or negative correlations (K (−0.35) and P (−0.49)). Therefore, it can be concluded that the selected features have very little dependency on one another and are applicable to machine learning and deep learning modelling.
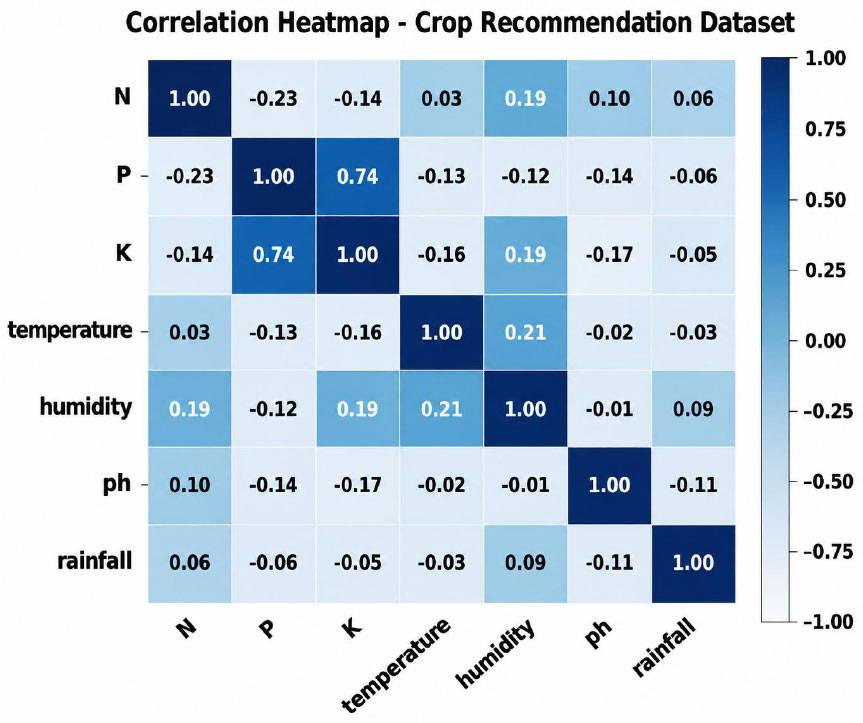
Correlation heat map.
To ensure the reproducibility and transparency of the proposed IoT-enabled intelligent crop recommendation framework, all machine learning and deep learning models were implemented using fixed experimental settings and standardized preprocessing procedures. The data were split in the ratio 80% training and 20% testing using a fixed random seed of 42, which ensured that in each repeat of the experiment, we had the same splits. Before training the models, the numerical features were normalized using Min-Max normalization. All the ML algorithms were configured with optimized hyperparameters based on the cross-validation technique. The RF classifier was run with 200 decision trees, 20 maximum tree depth, 2 minimum samples split, and the Gini criterion. XGBoost classifier was run with 200 estimators, a learning rate of 0.1, 6 maximum depth, 0.8 subsampling, and 0.8 column subsampling. The K-Nearest Neighbors (KNN) classifier was set to k = 5 and Euclidean distance. SVM classifier was set to an RBF kernel with C = 10 and γ = 0.01. DT classifier was run with 15 maximum depth and the Gini splitting criterion.
For deep learning models, the CNN is used; it has two one-dimensional convolutional layers with filters of 64 and 128, a kernel size of 3, and using ReLU as the activation function, which were followed by max-pooling, dropout (0.3), and fully connected layers. As for the DNN, it had three dense layers with 128, 64, and 32 neurons, respectively, ReLU as the activation function, and dropout of 0.3. On the other hand, the LSTM network had 64 hidden units along with a dense output layer and was trained on the input sequence of 10 time steps, i.e., the last ten observations to predict the future crop suitability. The LSTM network used the Adam optimizer with a learning rate of 0.001, a batch size of 32, and was trained for 100 epochs on the categorical cross-entropy loss function.
4.3. Performance Summary - Confusion Matrix
The tabular representation of the confusion matrix is effective for identifying the incorrect predictions the model made. The confusion matrix of the random forest classifier for the 22 crop categories from apple to lentil and from maize to watermelon, is shown in Fig. (8a and b). Most of the classifications are along the diagonal line. This shows that most of the crop categories have been correctly classified. A few non-diagonal elements can be seen, which show that there have been some classification errors, but these are very few because the crops are similar to each other. The confusion matrix of the XGBoost classifier for crops apple to lentil and maize to watermelon is shown in Fig. (9a and b), respectively. Just like the random forest model, the majority of the predictions are clustered along the diagonal, thus implying excellent classification performance for all the crop classes. Few mistakes have been made, which means that the algorithm can successfully differentiate between crops that grow under similar conditions. The results from the confusion matrix support the effectiveness and the generality of the XGBoost method in crop recommendation with changing soil and climatic conditions. The two algorithms have demonstrated high diagonal dominance with only a few numbers outside the diagonals. This shows that both algorithms have performed excellently in classification for the 22 different crop classes. Although both techniques have done a great job, random forest has made fewer mistakes for some crops compared to XGBoost.
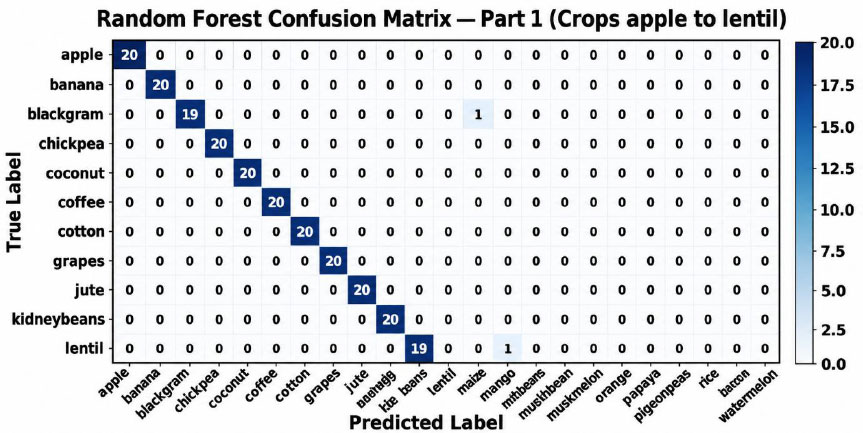
Random forest confusion matrix of crops apple to lentil.
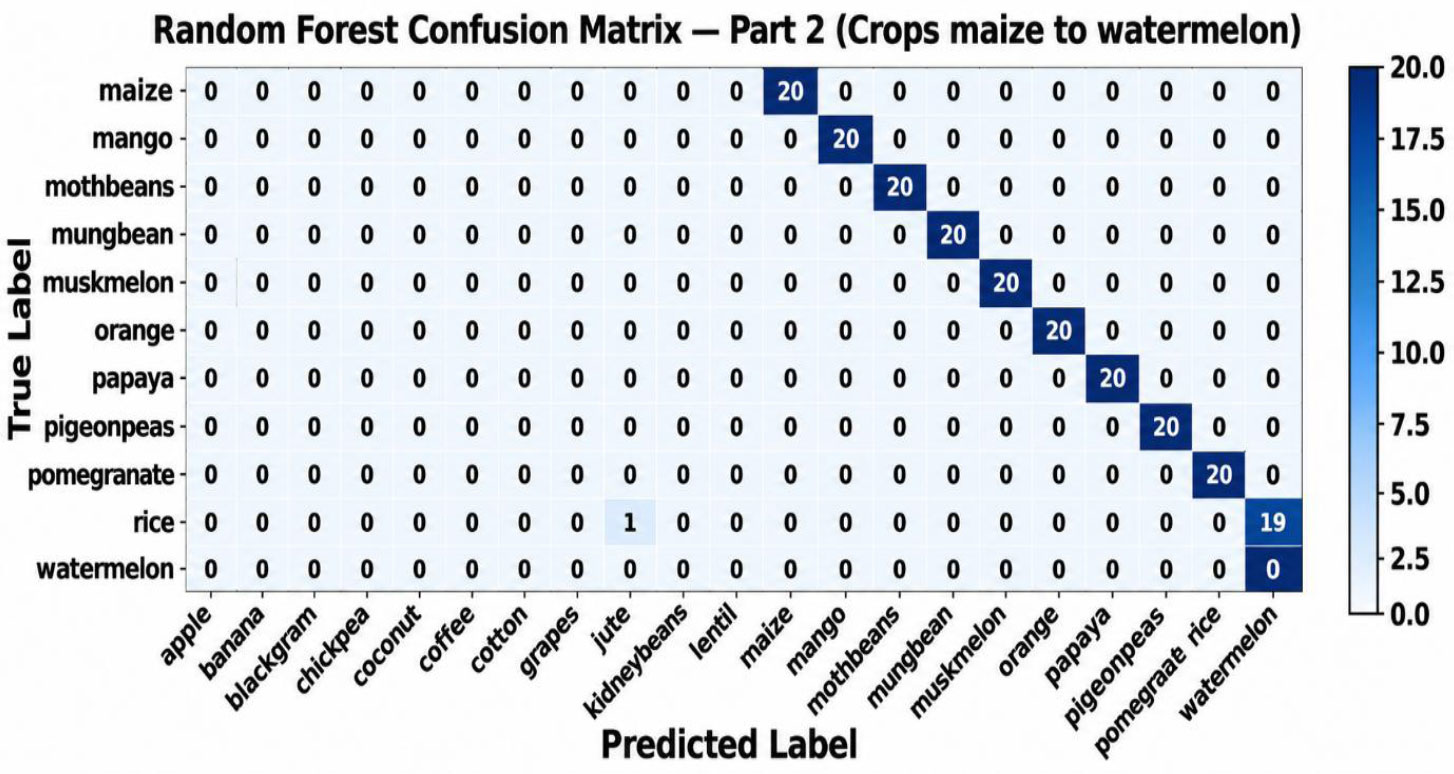
Random forest confusion matrix of crops maize to watermelon.
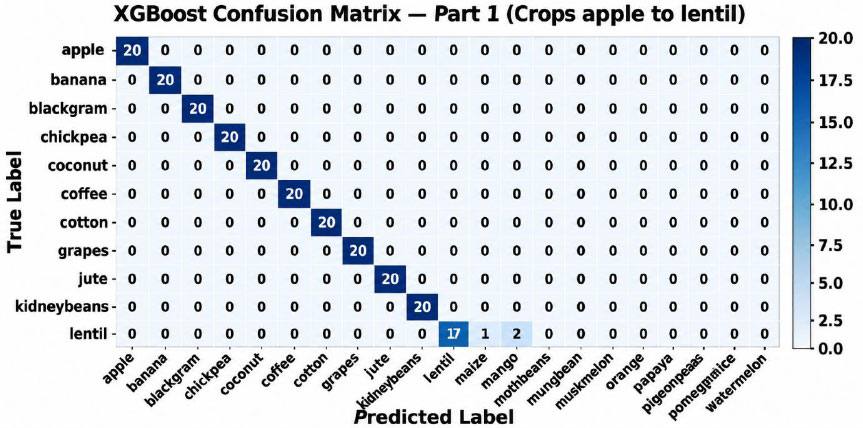
XGBoost confusion matrix of crops apple to lentil.
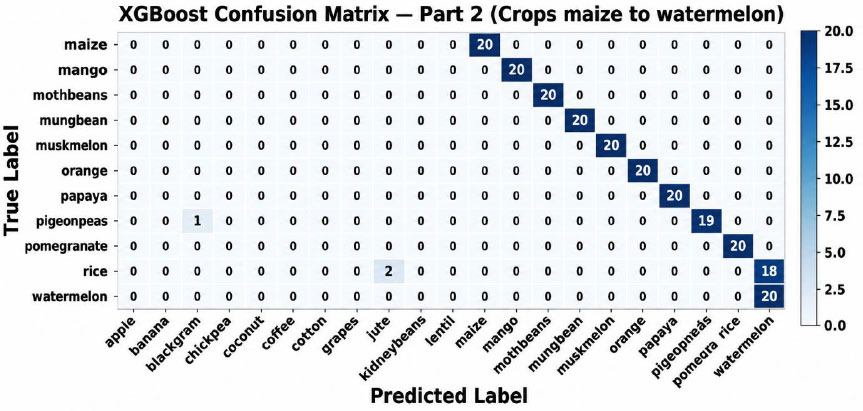
XGBoost confusion matrix of crops maize to watermelon.
4.4. Performance Measures
An important part of the process of developing effective machine learning and deep learning models is evaluating the performance of the model. The performance metrics measure the performance of a model on a specific task, and they are quantitative in nature. Such metrics serve to evaluate the efficiency of predictions, their accuracy, and the quality of the trained model. The offered crop recommendation system is statistically evaluated as follows:
4.4.1. Accuracy Score
It can be mathematically depicted in Eq. (1), where n is the overall number of occurrences in the dataset and yi and zi are labels of true and expected outputs, respectively.

Table 3 provides the accuracy score of the proposed system based on different machine learning and deep learning algorithms. Both CNN and the random forest models achieve 99% accuracy, with slight differences in the fractional values, which leads to the random forest model achieving the highest accuracy. In second place is XGBoost with 99.3% accuracy, followed by SVM with 98.4%, KNN with 97.9%, decision tree with 97.95, and DNN and LSTM with 97%.
4.4.2. F1-Score
F1-Score guarantees the accuracy of the model so that crucial crop forecasts are never overlooked. It also symbolises the harmony between accuracy and recall. It provides us with the precision and recall weighted averages. Since unequal numbers of occurrences in each class will distort the accuracy findings, it is typically more beneficial than accuracy. The F1-Score based on precision and recall is calculated based on Eq. (2).

The F1-Scores of all the models are available in Table 3. From the table, the F1-Score is highest for random forest (0.995), followed by CNN, XGBoost, SVM, KNN, decision tree, DNN, and LSTM.
4.4.3. Mean Squared Error
One popular metric for evaluating the effectiveness of regression models is mean squared error. Because it calculates the average of the squares of the discrepancies between the actual and anticipated values, it is extremely vulnerable to significant errors. In agricultural models, particularly those that forecast continuous variables like yield, temperature, or rainfall, mean squared error aids in measuring how closely the model's predictions match actual values. The fit is better when the mean squared error value is lower. However, because it employs squared errors, this may overweight the outliers. The mathematical formula of mean squared error is given in Eq. (3).
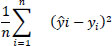
4.4.4. Root Mean Squared Error
The RMSE, or square root of the mean squared error, can be used to naturally read the model's prediction error in the same unit as the target variable. It displays the typical prediction error magnitude. When interpretability is crucial, as in the comparison of expected and actual crop yields, RMSE is especially helpful. Similar to MSE, a lower RMSE indicates greater performance, even though it is less susceptible to outliers. The regression analysis results are shown in Table 4, and its formula is as follows in Eq. (4).
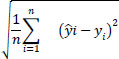
The relative effectiveness of various machine learning models in forecasting the adaptability of rice crops is shown in Table 4. Compared with linear models, ensemble models such as Gradient Boosting and random forests exhibit lower errors (MSE, RMSE) and higher predictive accuracy (R2). When modeling complicated data in agriculture, Gradient Boosting is reliable and robust since it has the highest R2 of 0.955 and a low cross-validation variance. The comparative plot of MSE, RMSE, and R2 is displayed in Fig. (10). The random forest model is more accurate than the others, suggesting that it has a strong predictive capacity because it has the best R2 and the lowest error rates. SVR is the least effective because it has the biggest inaccuracy and the lowest R2. Ensemble models like random forest, XGBoost, and gradient boosting are more accurate as compared to the linear methods.
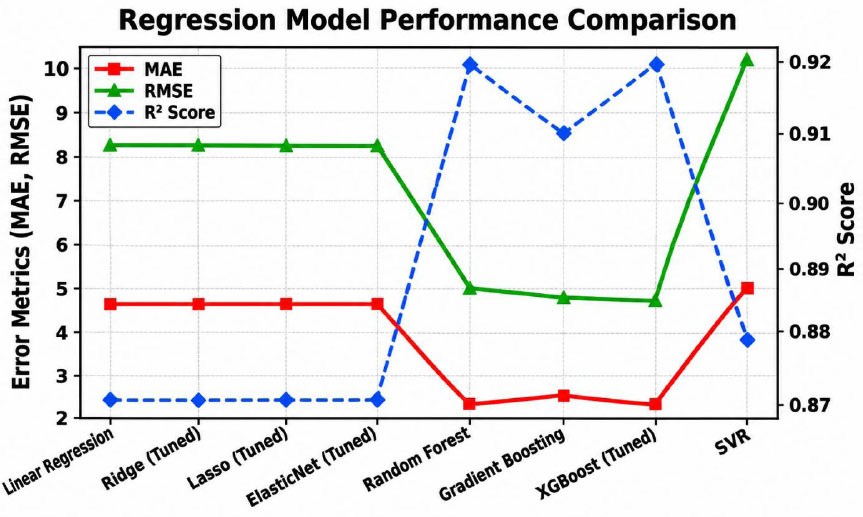
Regression scores.
4.5. Pareto Analysis
Another formal research method called Pareto shows different possibilities vying for the observer's attention. It is a useful criterion for making decisions while attempting to raise the bar for quality. Temperature, rainfall, soil pH, phosphorus, nitrogen, potassium, humidity, and rainfall-all of which are ascertained using this statistical analysis method-also affect the result. The most important portion of the study's crop suggestions can be prioritized using the Pareto rule. The rule states that 20% of the influence may be explained by 80% of the factors. The statistical frequency distribution approach is used to fill in the Pareto analysis by calculating the frequency of occurrence of each parameter that influences crop selection, as indicated in Table 5. The frequency values are listed in the table in decreasing order. The three factors-rainfall, humidity, and potassium (K)-have a greater influence on the crop recommendation, according to the total percentage of effects. The cumulative impact percentage curve graph from the Pareto analysis is shown in Fig. (11). The farmers will be able to plan their operations using the new knowledge and choose crops that are appropriate for the areas by combining this result with forecasts of future rainfall and humidity.
| Features | Frequency | Cumulative Frequency | Impact Percentage | Cumulative Impact Percentage |
|---|---|---|---|---|
| Rainfall | 226 | 226 | 22.5676 | 22.5676 |
| Humidity | 216 | 442 | 21.5975 | 44.1651 |
| K | 178 | 620 | 17.7675 | 61.9327 |
| P | 152 | 772 | 15.2106 | 77.1433 |
| N | 102 | 874 | 10.1705 | 87.3139 |
| Temperature | 74 | 948 | 7.3685 | 94.6824 |
| pH | 53 | 1001 | 5.3175 | 100.00 |
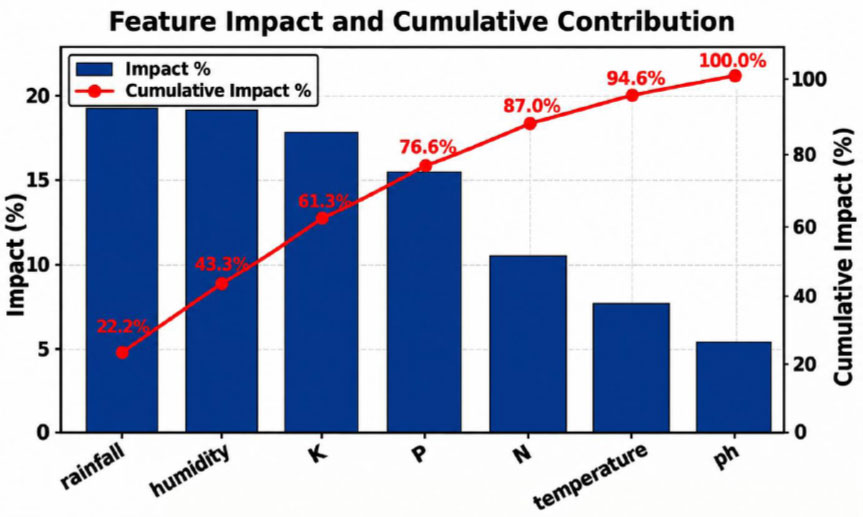
Pareto analysis of feature importance.
4.6. Real- time Crop Recommendation
The random forest regressor was chosen for the environmental parameter prediction based on the results, and it offers the lowest MSE (5.838), the lowest RMSE (9.779), and the highest coefficient of determination (R2 = 0.719). The random forest regressor provided superior regression results with smaller prediction errors, making it the preferred method for environmental parameter forecasting even though the gradient boosting method had a slightly higher cross-validation mean (CV_Mean = 0.736). The following NPK input values are used for the real-time demonstration based on the input soil nutrients: N = 90, P = 42, K = 43. The random forest regressor predicted the following environmental parameters: temperature = 23.13°C, humidity = 81.20%, pH = 6.57, and rainfall = 201.11 mm. Random Forest was selected as the model to utilize because of its excellent prediction performance during the regression and classification stages, even though both models produced identical classifications. It is evident from the anticipated environment that rice would be the recommended crop because it fits the climate best. Table 6 presents the projections' outcomes. Rice was selected by the model as the best crop for the input, and it will be recommended in areas with the anticipated humidity and temperature.
| N | P | K | Temp(0C) | Humidity (%) | pH | Rainfall(mm) | Reco. crop |
|---|---|---|---|---|---|---|---|
| 90 | 42 | 43 | 23.13 | 81.2 | 6.57 | 201.11 | Rice |
The model then forecasts the trends for temperature, humidity, rainfall, and soil pH over the following 12 months after identifying the best crop for a given area. Rainfall and temperature follow a monsoon pattern, peaking in months three through six. While pH stays constant, humidity decreases in the middle of the year before increasing once more. Figures 12 and 13 display the predicted outcomes and the crop's suitability map, which is updated in real time. Proactive crop planning based on seasonal environmental changes is supported by these forecasts.
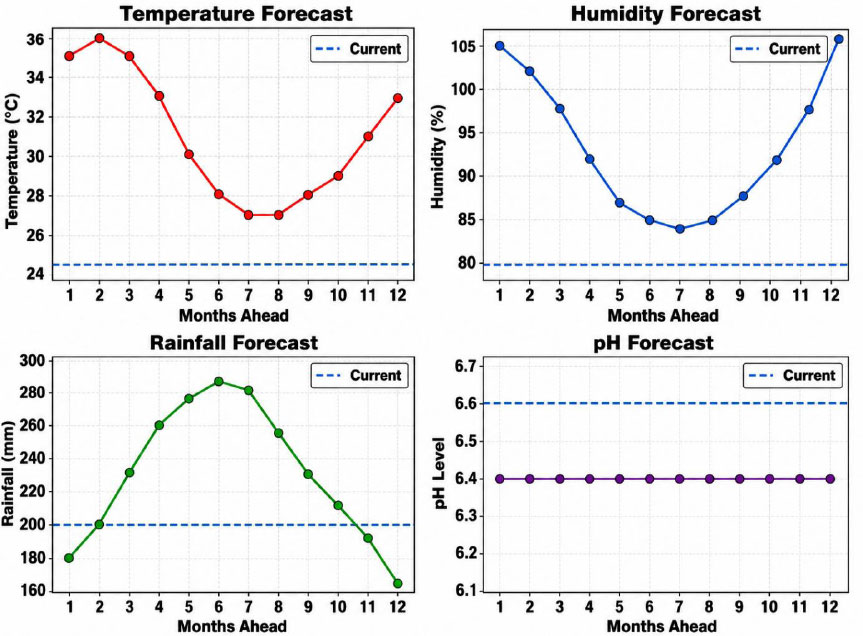
Forecasted environmental parameters over 12 months.
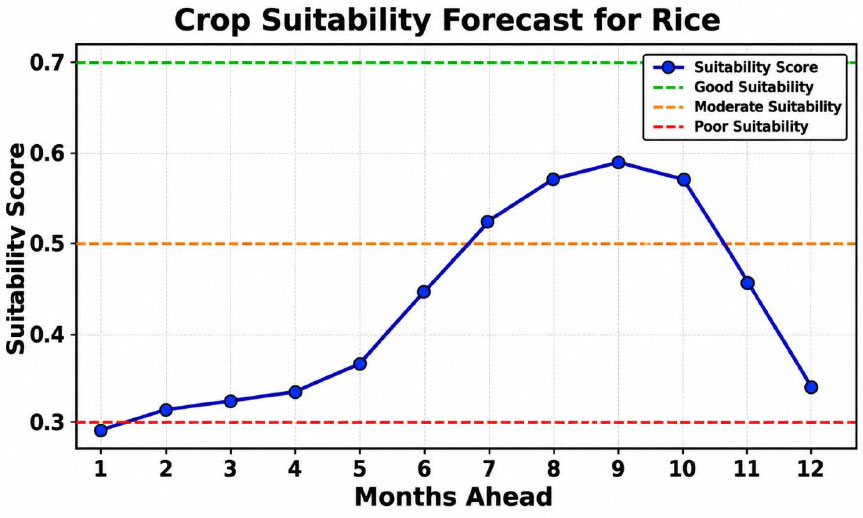
Suitability of crop.
CONCLUSION
This study proposes an IoT-based smart agricultural model that uses predictive weather patterns to recommend crops. In addition to providing more practical crop suggestions, the collaborative Pareto analysis assists the model in identifying the most important soil and climate characteristics. The IoT model that has been prototyped uses smart sensors to gather and store weather trends. It also uses machine learning and deep learning techniques to forecast predictive insights and choose the right crops. The accuracy F1- Score, MSE, RMSE, and R2 of the prediction model's output are all acceptable model evaluation measures. A hardware prototype was created to collect real-time data in a comparable manner, and the dataset utilized in this research was acquired from the IEEE data portal. More international datasets might be used to get more beneficial outcomes that would benefit the farming community as a whole. The proposed system can map high-dimensional input space to outputs and learn adaptively from the data. However, given the wide range of soil types prevalent worldwide, the suggestions' accuracy might be constrained. The system can be extended to gather more data on soil characteristics by adding more sensors to the sensory layer. Our long-term objective is to put into practice a personalized plant attention model that can concentrate, collect information about specific plants, and provide nutrients for precision farming.
LIMITATIONS AND FUTURE SCOPE
The proposed framework has shown promising performance for intelligent crop recommendation, but a few limitations are also present. The study was developed using a specific dataset with a limited set of soil and environmental parameters; this may not fully represent the diversity of real agricultural conditions across different regions. The prototype system was also evaluated on a relatively controlled setup, and large-scale field validation under different seasonal, climatic, and soil conditions was not extensively performed. In addition, important practical factors such as soil texture, micronutrient composition, pest attacks, irrigation practices, and regional farming patterns were not included in the present analysis. These factors may influence crop suitability in real-world environments. Future work will focus on expanding the dataset with more diverse regional samples, integrating additional sensor-based parameters, and conducting long-term real-time field experiments. Such improvements can enhance the robustness, adaptability, and practical usefulness of the proposed smart agriculture framework for precision farming applications.
AUTHORS' CONTRIBUTIONS
The authors confirm their contributions to the paper as follows: P. C. B. and A. S. P.: Study conception and design; S. S. and P. C. B.: Data collection; S. S.: Coding and implementation; S. S., P. C. B., D. R., R. T. V., and M. V. M.: Analysis and interpretation of results; S. S. and P. C. B.: Draft manuscript; M. V. M.: Proofreading, supervision, and final review. All authors reviewed the results and approved the final version of the manuscript.
LIST OF ABBREVIATIONS
| AI | = Artificial Intelligence |
| ANN | = Artificial Neural Network |
| Accuracy | = Classification Accuracy |
| CNN | = Convolutional Neural Network |
| CPU | = Central Processing Unit |
| CSV | = Comma-Separated Values |
| CV | = Cross-Validation |
| CV_Mean | = Mean Cross-Validation Score |
| CV_Std | = Standard Deviation of Cross-Validation Score |
| DHT11 | = Digital Temperature and Humidity Sensor |
| DNN | = Deep Neural Network |
| DT | = Decision Tree |
| Device ID | = Unique Sensor Device Identifier |
| ESP32 | = Espressif 32-bit Microcontroller |
| ElasticNet | = Elastic Net Regression |
| F1-Score | = Harmonic Mean of Precision and Recall |
| GB | = Gradient Boosting |
| GPU | = Graphics Processing Unit |
| H | = Humidity (%) |
| IEEE | = Institute of Electrical and Electronics Engineers |
| IoT | = Internet of Things |
| JSON | = JavaScript Object Notation |
| K | = Potassium |
| KNN | = K-Nearest Neighbors |
| LR | = Linear Regression |
| LSTM | = Long Short-Term Memory |
| Lasso | = Lasso Regression |
| MAE | = Mean Absolute Error |
| MSE | = Mean Squared Error |
| MongoDB | = Document-oriented NoSQL database |
| N | = Nitrogen |
| NPK | = Nitrogen, Phosphorus, and Potassium |
| NoSQL | = Not Only SQL |
| P | = Phosphorus |
| Precision | = Positive Predictive Value |
| RF | = Random Forest |
| RMSE | = Root Mean Squared Error |
| Recall | = Sensitivity |
| Region ID | = Geographic Region Identifier |
| Ridge | = Ridge Regression |
| R² | = Coefficient of Determination |
| SVM | = Support Vector Machine |
| SVR | = Support Vector Regression |
| T | = Temperature (°C) |
| Wi-Fi | = Wireless Fidelity (IEEE 802.11) |
| XGBoost | = Extreme Gradient Boosting |
| pH | = Potential of Hydrogen |
AVAILABILITY OF DATA AND MATERIALS
All data generated or analyzed during this study are included in this published article.
ACKNOWLEDGEMENTS
Declared none.