All published articles of this journal are available on ScienceDirect.

Prevalence of Cassava Mosaic Geminiviruses in the Volta Region of Ghana
Authors Info & Affiliations
Abstract
Introduction
Cassava Mosaic Disease (CMD), caused by Cassava Mosaic Geminiviruses and transmitted by Bemisia tabaci, is a major constraint to cassava production in Africa. The objective of the study is to determine the prevalence, spatial distribution, and diversity of Cassava Mosaic Geminiviruses in the Volta Region of Ghana.
Methods
A field survey was conducted between June and August 2019 to ascertain the prevalence, spatial distribution, and diversity of CMGs in the Volta Region. A total of five farms were selected from each of the three communities within each of the six districts, resulting in a total of 90 farms. From each farm, 30 plants (25 symptomatic and 5 asymptomatic) were randomly sampled, ensuring a minimum distance of 30 km between farms. Data were collected on disease incidence, disease severity, and whitefly population across all sites. Incidence and whitefly data were appropriately transformed prior to analysis, while severity scores were calculated. The resulting data were analysed using Analysis of Variance (ANOVA) in GenStat statistical software, version 11.
Results
The incidence and severity of CMD were high, ranging from 77.20 ± 1.64 in Hohoe to 96.67 ± 0.23 in Krachi Nchumuru, and from 2.93 in Adaklu to 4.37 in Hohoe, respectively. Whitefly populations were generally high, with Krachi Nchumuru and Adaklu recording 10.01 ± 0.22 and 5.93 ± 0.25, respectively.
Discussion
Pearson’s coefficient of correlation indicated a strong positive significant correlation (r=0.719; p<0.05) between whitefly population and incidence, and a significant weak negative correlation (r=-0.177; p<0.05) between rainfall and disease severity and temperature. A higher percentage (more than half) of leaf samples were co-infected with ACMV and EACMV than either species alone in all six districts surveyed.
Conclusion
The severe CMD prevalence in the Volta Region, compounded by whiteflies, susceptible varieties, and high ACMV–EACMV co-infections, highlights the urgency of resistant planting materials, farmer awareness, and enhanced monitoring to curb disease spread and prevent the emergence of new CMG species.
1. INTRODUCTION
Cassava Mosaic Disease (CMD), first reported in 1894, is a major constraint to cassava production in Africa [1, 2, 3]. CMD is caused by Cassava Mosaic Geminiviruses (genus: Begomovirus, family: Geminiviridae) [4]. The disease is transmitted by the whitefly Bemisia tabaci (Gennadius), a key vector incorporated into recent CMD transmission models [5].
Currently, multiple CMG species have been identified and characterised across Africa [6]. CMGs occur as a single infection or as co-infection with more than one CMG species (mixed infections), leading to more severe symptoms due to high accumulation of viral DNA [7]. A classic example is the co-infection of cassava with ACMV and a recombinant strain of EACMV, which led to a severe CMD pandemic in Uganda in the early 1990s [1]. Mixed infections of cassava with ACMV and EACMV species have become common in Africa [1], increasing the probability of recombination and evolution of new CMG species.
A number of factors, including an increase in whitefly abundance, emerging biotypes, and the movement of infected planting materials across regions, have contributed to the spread of CMD and CMGs in Africa [1]. Whitefly vectors transmit CMGs in a persistent manner, contributing to increasing prevalence and incidence across cassava-growing areas [8]. Furthermore, climatic factors such as temperature, rainfall, and wind affect the abundance of whitefly vectors [9]. The exchange of infected stem cuttings by farmers remains a major source of both local and long-distance spread of CMGs across Africa, facilitating the introduction of new CMG strains into previously unaffected regions, thereby increasing the risk of virulence shifts or recombination [1, 10].
Field surveys are essential for understanding the magnitude of CMD in Ghana, as they enable the identification and characterisation of CMG species, diversity, and assessment of disease prevalence in farmers’ fields. Field surveys are key components of plant disease epidemiology because they provide baseline data for pathogen identification and characterisation [11, 12]. In addition, because CMD expression varies across locations, field surveys generate critical information needed to develop effective management strategies [1].
Rapid and accurate identification of Cassava mosaic geminiviruses (CMGs) is essential for effective virus studies and management. Among available tools, the double antibody sandwich (DAS) ELISA [11, 13] and triple antibody sandwich (TAS) ELISA [11, 13] have been successfully applied in the field to detect CMGs. These diagnostic approaches support reliable differentiation of CMG species, including ACMV and EACMV, thereby strengthening surveillance and management strategies [14].
In Ghana, following the initial detection of EACMV and subsequent confirmation of widespread mixed infection with ACMV, recent molecular surveys continue to highlight the persistent and evolving nature of CMD. Current analyses reveal increasing genetic diversity among CMG populations, including the emergence of novel variants and recombinants that threaten host resistance and accelerate epidemic spread [14, 15].
Given the importance of cassava to Ghanaian smallholder farmers’ ability to generate revenue, ensure food security, and adapt to climate change, it is crucial to comprehend the current prevalence and geographic distribution of CMGs. Without updated epidemiological data, disease management strategies risk becoming outdated, leaving farmers vulnerable to yield losses surpassing 20–40% in severe outbreaks. Additionally, reference [16], together with recent studies such as [11] and [12], emphasises that in order to detect changes in viral populations and vector dynamics, efficient monitoring should be conducted regularly, ideally every two to four years. Therefore, the principal objective of this study was to determine the prevalence, spatial distribution, and diversity of Cassava Mosaic Geminiviruses in the Volta Region of Ghana.
Specifically, the study sought to determine the:
- Prevalence and spatial distribution of CMD in the Volta Region
- An abundance of whitefly population in farmers’ fields.
- Diversity of Cassava Mosaic Geminivirus species in the Volta Region.
2. MATERIALS AND METHODS
2.1. Field Survey for Prevalence and Spatial Distribution of CMGs
A field survey to assess the prevalence and spatial distribution of CMGs was conducted in all six (6) districts in the Volta Region during the 2019 cropping season (June to August). The eighteen (18) communities surveyed in this study are indicated in Fig. (1).
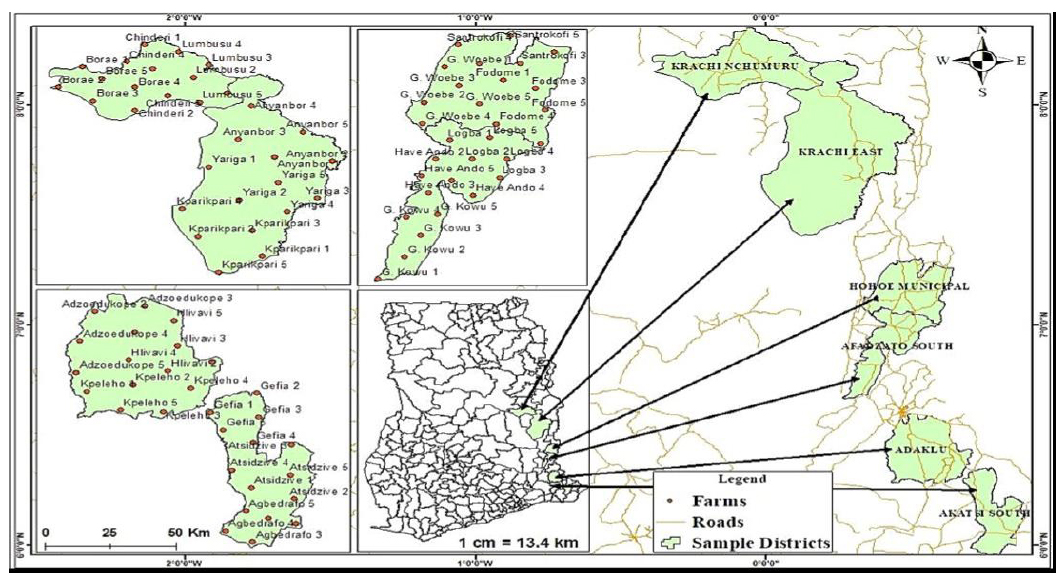
Map of Ghana (Volta Region) showing the surveyed area.
2.2. Sampling Techniques and Sample Size
The random sampling method was used to select cassava farms in the six communities. Five farms were selected from each of three communities in each district, and 30 plants (25 symptomatic and 5 asymptomatic) were sampled in each farm. Leaf material was collected from the younger leaves of 3- to 4-month-old plants (Fig. 2). In selecting the farms, an interval of 30 km or more was considered (this guaranteed representative sampling across broad areas while reducing bias from localized infection clusters) as suggested by [16, 17]. The stratified random sample design (SRSD) was used in sampling the test plants in farmers’ fields. Using this method, fields were divided into equal strata, and the test plants were selected from each of the strata. On average, each farm surveyed measured one acre or more. In total, data were collected on 2700 test plants (30 × 90 farms: 2250 symptomatic and 450 asymptomatic). In each of the districts, 375 diseased plants and 75 healthy plants were tested.
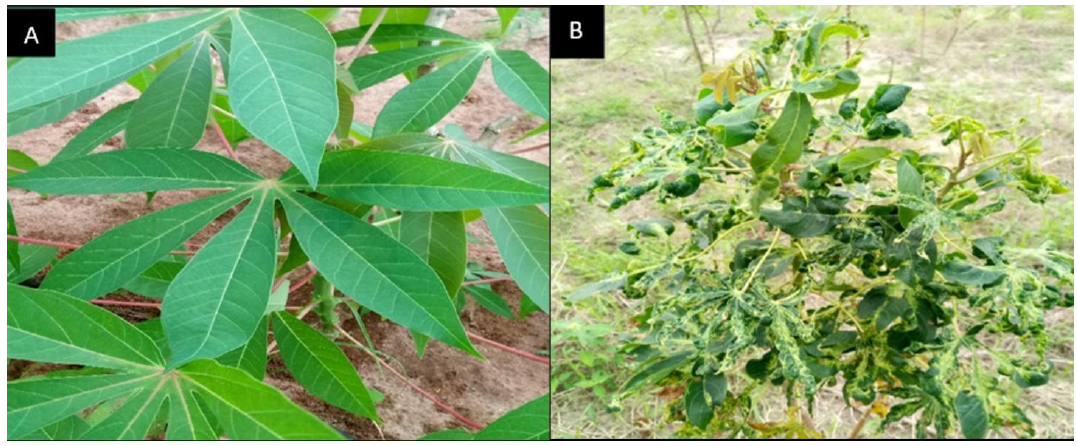
Typical asymptomatic plant (A) and symptomatic plant (B) in farmers’ fields.
2.2.1. Varieties Planted
Across the surveyed farms, farmers cultivated a diverse range of cassava varieties, although many were unable to provide formal varietal names. Several varieties carried locally derived names, often based on the farmer who first introduced the planting material or the community or district from which it originated, leading to names that were highly specific to particular communities or districts. Although some of these names corresponded to officially released varieties such as Sika, Ampong, and Afisiafi, many of the plants observed did not match the true morphological characteristics of these improved varieties.
Due to this localised and sometimes inconsistent naming system, it was not feasible to present an exhaustive list of all varieties encountered. However, the most commonly recorded names during the survey included Dogbo, Sika, Hushivi, Hushiga, Ampong, Grace, Ankra, Afisiafi, Gabon, Ho, Saboba, Aerante, and Abibiaga.
2.3. Detection of CMGs using Triple Antibody Sandwich (TAS) ELISA
Young leaf samples (both symptomatic and asymptomatic) were collected from all 2700 plants assessed. The samples were placed in labelled Ziplock bags and kept in a −18 °C freezer until processed. For the detection of CMGs using ELISA, microtitre plates were coated with IgG (20 μL diluted in 20 mL of coating buffer (0.75 M Na2CO3 + 1.75 M NaHCO3 + 0.15 M NaN3)). A total of 100 μL of the mixture was added to each well, covered, and incubated at 37 °C for 4 hours. The plates were then washed three times with phosphate-buffered saline (PBS) + 0.5 mL Tween 20 per liter and blocked with 100 μL of 2% skimmed milk. The plate was then covered and incubated for an additional 30 minutes at 37 °C, after which they were washed and tapped dry.
Sap from diseased and healthy leaves was extracted from 0.5 g leaf samples using 5 mL of extraction buffer (27.4 M NaCl, 0.294 M KH2PO4, 1.62 M Na2HPO4, 0.536 M KCl at pH 7.4), Tween 20 and 2% polyvinyl pyrrolidone in a ratio of 1:5 (1 g plant sample in 5 mL of buffer). 100 μL of the extracted samples were loaded in duplicate wells on the plate. Similarly, the positive (kit-provided) and negative (extract from serologically and molecularly confirmed healthy cassava leaves) controls were loaded onto the same plate. The plates were covered with rubber film and stored overnight at 4 °C. The plates were washed three times with washing buffer (PBS-T). The monoclonal antibody (MAb) was diluted in conjugate buffer (1:1000), and 100 μL of the mixture was loaded into each well and incubated at 37 °C for four hours. The plate was washed as previously described and RAM-AP diluted 1:1000 in conjugate buffer was loaded (100 μL) into each plate and incubated for an hour. The plate was washed three times at three-minute intervals, and 100 μL aliquots of a freshly prepared substrate (1 mg/mL para-nitrophenyl-phosphate in substrate buffer) was added to each well. It was then covered and incubated at 37 °C for one hour to aid colour development. The plate was visually assessed, and the absorbance read using a spectrophotometer (Multiskan Ascent VI.25-Version 1.3.1) at a wavelength of 405 nm. The ELISA kit was obtained from Leibniz Institute DSMZ.
2.4. Data Collection
2.4.1. Prevalence and Spatial Distribution of CMD
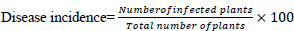
Data were collected on the whitefly population, disease incidence, and symptom severity in 90 farms (15 farms per district) in the Volta Region between June and August of the 2019 cropping season. GPS coordinates for each farm were recorded for all 90 farms visited. Total whitefly population was assessed by counting the number of adult whiteflies on the five topmost, fully expanded leaves of the selected plants [18]. This assessment was conducted in the early hours of the day, from 6:00 a.m. to 8:00 a.m., as described by [18]. Disease incidence was calculated as the percentage of plants showing CMD symptoms within each stratum on each farm [17] and has been applied in previous CMD epidemiological studies [19, 20]. CMD severity was assessed using a scoring scale rated 1 to 5 (Table 1), where 1 = no disease symptoms and 5 = severe chlorosis, distortion of leaves, and stunted growth [18].
Table 1.
| Rating | Symptoms | |||
|---|---|---|---|---|
| 1 | No symptoms observed | |||
| 2 | Mild chlorotic pattern on entire leaflets or mild distortion at the base of leaflets, appearing green and healthy | |||
| 3 | Strong mosaic pattern on the entire leaf, and narrowing cum distortion of the lower 1/3 of leaflets | |||
| 4 | Severe mosaic distortion of 2/3 of the leaflets and a general reduction of leaf size | |||
| 5 | Severe mosaic distortion of 4/5 or more of the leaflets, twisted and misshapen leaves | |||
2.4.2. TAS-ELISA Detection of CMD
Based on the ELISA absorbance values, samples were classified as either positive or negative for the virus. Samples with absorbance values greater than twice that of the negative control were considered positive[22].
2.5. Data Analysis
Mean whitefly counts were transformed using the square root transformation approach. The percentage disease incidence was calculated according to [23] and transformed using angular transformation prior to statistical analysis. Data on CMD severity for individual farms were first calculated using a formula (1), (2) by [22] before analysis: [23, 24]

The generated values were subjected to analysis of (ANOVA) using the GenStat statistical package, version 11 (VSN International), after testing for the assumptions of ANOVA. Means were separated by using LSD at 5% significance level.
3. RESULTS
3.1. Abundance of Whitefly Population in Farmers’ Fields in the Volta Region
The mean whitefly population was significantly higher (F5, 80 = 58.59, p< 0.05) in Krachi Nchumuru (10.01 ± 0.22 b), Krachi East (9.80 ± 0.29 b), and Akatsi South (9.03 ± 0.16 b) compared to Hohoe (5.58 ± 0.33 a), Afadjato South (5.92 ± 0.36 a), and Adaklu (5.93 ± 0.25 a) (Table 2). The lowest whitefly population was recorded in the Hohoe district (5.58 ± 0.33 a), while the highest whitefly population was recorded in the Krachi Nchumuru district (10.01 ± 0.22 b).
Table 2.
| Districts | Mean Whitefly Population/Plant |
|---|---|
| Hohoe | 5.58 ± 0.33a |
| Afadjato South | 5.92 ± 0.36a |
| Adaklu | 5.93 ± 0.25a |
| Akatsi South | 9.03 ± 0.16b |
| Krachi East | 9.80 ± 0.29b |
| Krachi Nchumuru | 10.01 ± 0.22b |
| LSD (0.05) | 0.77 |
Note: F5, 80 = 58.59, p< 0.05; this is the F statistics value from the study describing the degrees of freedom associated with the test.
3.2. Prevalence and Spatial Distribution of CMD in the Volta Region
In the Volta Region, CMD incidence across the six districts varied significantly (F5, 80 = 15.51, p< 0.05). The highest incidence was recorded in Krachi Nchumuru (96.67 ± 0.23%), followed by Krachi East (96.47 ± 0.31%), Akatsi South (86.67 ± 1.59%), and Adaklu (82.40 ± 1.95%) (Table 3). Similar to the whitefly population, CMD incidence was lowest in the Hohoe district (77.20).
Table 3.
| Districts | Mean Incidence (%) |
|---|---|
| Hohoe | 77.20 ± 1.64a |
| Afadjato South | 77.67 ± 1.68a |
| Adaklu | 82.40 ± 1.95ab |
| Akatsi South | 86.67 ± 1.59b |
| Krachi East | 96.47 ± 0.31c |
| Krachi Nchumuru | 96.67 ± 0.23c |
| LSD(0.05) | 4.93 |
3.3. Mean Severity of Cassava Mosaic Disease
Across the six cassava-growing districts in the Volta Region, all had varying levels of CMD severity (F5, 80 = 14.53, p< 0.05) (Fig. 3). The severity of CMD ranged from 2.93 in the Adaklu district to 4.37 in the Hohoe district. The CMD severity scores of 3.42, 3.52, and 3.69 were respectively recorded in the following districts: Akatsi South, Krachi East, and Krachi Nchumuru. Cassava plants in Hohoe displayed severe symptoms of CMD.
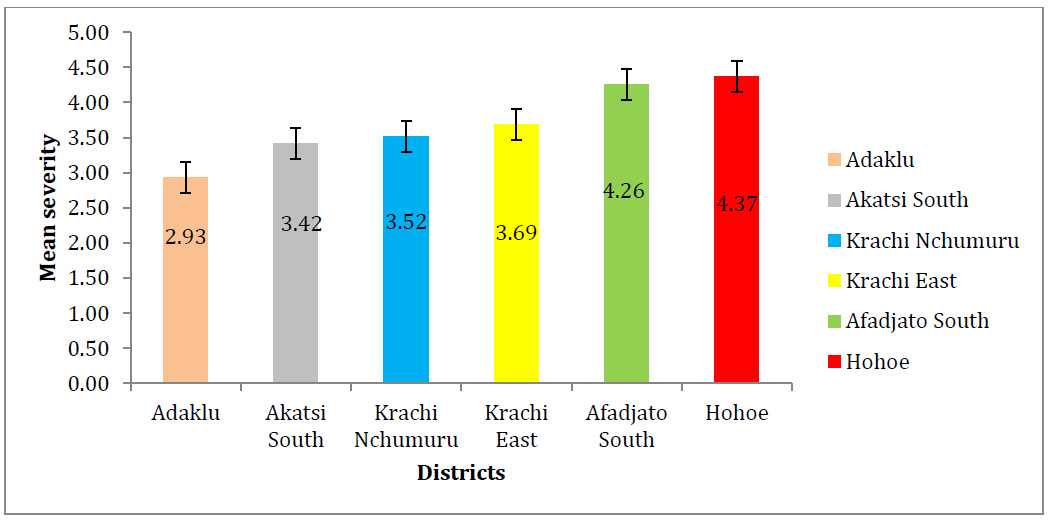
Mean severity of CMD across the six districts.
3.4. Relationship between Variables
To ascertain the relationships between different variables that measure Cassava Mosaic Disease (CMD), Pearson’s coefficient of correlation was calculated for whitefly population, incidence, severity, and climatic data. The results (Table 4) indicated a strong, positive, and significant correlation (r = 0.719; p < 0.05) between whitefly population and disease incidence, suggesting that the increase in whitefly population may contribute to higher disease incidence. Additionally, a weak but significant negative correlation (r = −0.177; p < 0.05) was observed between rainfall and disease severity, as well as temperature, indicating that increases in temperature or rainfall may potentially reduce disease severity.
| - | Incidence | Whitefly Pop | Severity (Average Percentage) | Month | Rainfall |
|---|---|---|---|---|---|
| Whitefly pop | 0.719*** | - | - | - | - |
| Severity (AP) | -0.291** | -0.302*** | - | - | - |
| Month | 0.476*** | 0.362*** | 0.224** | - | - |
| Rainfall | 0.065 | 0.052 | -0.177 | 0.186 | - |
| Temperature | 0.132 | 0.314*** | -0.519*** | -0.601*** | 0.050 |
3.5. Relatedness of Communities in terms of CMD Severity and Incidence, Temperature, and Rainfall
The relatedness of the six communities was examined using five parameters: incidence, severity, whitefly population, rainfall, and temperature. Three main clusters were observed at a dissimilarity coefficient of 0.3. Cluster A showed a close similarity between Krachi East and Krachi Nchumuru. Cluster B showed a close similarity between Afadjato South and Hohoe, and Cluster C showed the closeness of Adaklu and Akatsi South (Fig. 4).
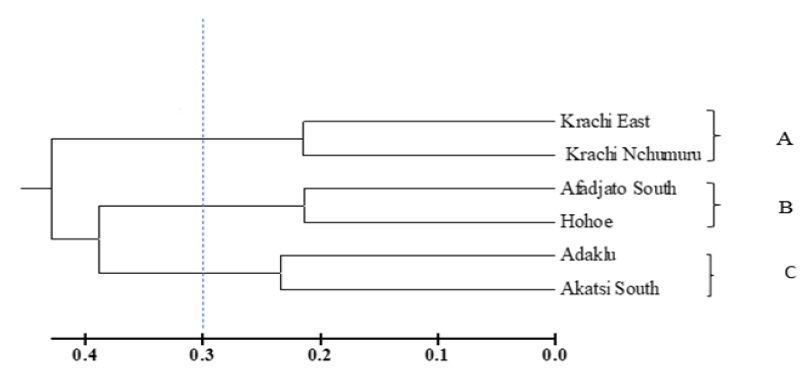
Dendrogram showing relatedness of communities in terms of CMD severity and incidence, temperature, and rainfall, constructed from PowerMarker using seventeen polymorphic markers with the UPGMA tree method across the three Agro ecological zones from which the district was selected (A-Savanah ecological zone, B-Forest ecological zone, C-Coastal Savannah ecological zone).
3.6. Cassava Mosaic Geminivirus Species Diversity in the Volta Region
Figure 5A shows the diversity of CMG species detected in symptomatic leaf samples using the TAS ELISA test. Both ACMV and EACMV species were detected either singly or as co-infections in samples collected from farmers’ fields across the six districts (Fig. 5A). EACMV was detected in a higher number of samples screened than ACMV in all districts except Hohoe. Across all districts, a higher proportion of leaf samples, more than half, were co-infected with ACMV and EACMV than infected with either species alone. The two forest zones, Hohoe Municipality and Afadjato South, recorded the highest incidence of mixed infection at 77.3% and 70.7%, respectively, while Adaklu recorded the lowest mixed infection of 21.3%. Leaf samples collected from Akatsi South District recorded the highest ACMV incidence (13.3%), followed by Adaklu (10.7%), with Krachi East District recording the lowest incidence (4%). For EACMV, Krachi Nchumuru District recorded the highest infection (25.3%), while Hohoe had the lowest (8%).
Of the 450 asymptomatic samples collected from farmers’ fields in the Volta Region, 165 samples were positive for CMGs. EACMV was detected in 80 samples, ACMV in 40 samples, and 45 samples were infected with both ACMV and EACMV species (Fig. 5B).
Overall, the percentage of ACMV in all districts was low and varied significantly. Akatsi South District recorded the highest ACMV incidence (13.3%), followed by Adaklu (10.7%), Hohoe, Afadjato South, and Krachi Nchumuru (6.7%), with Krachi East District recording the lowest incidence (4%).
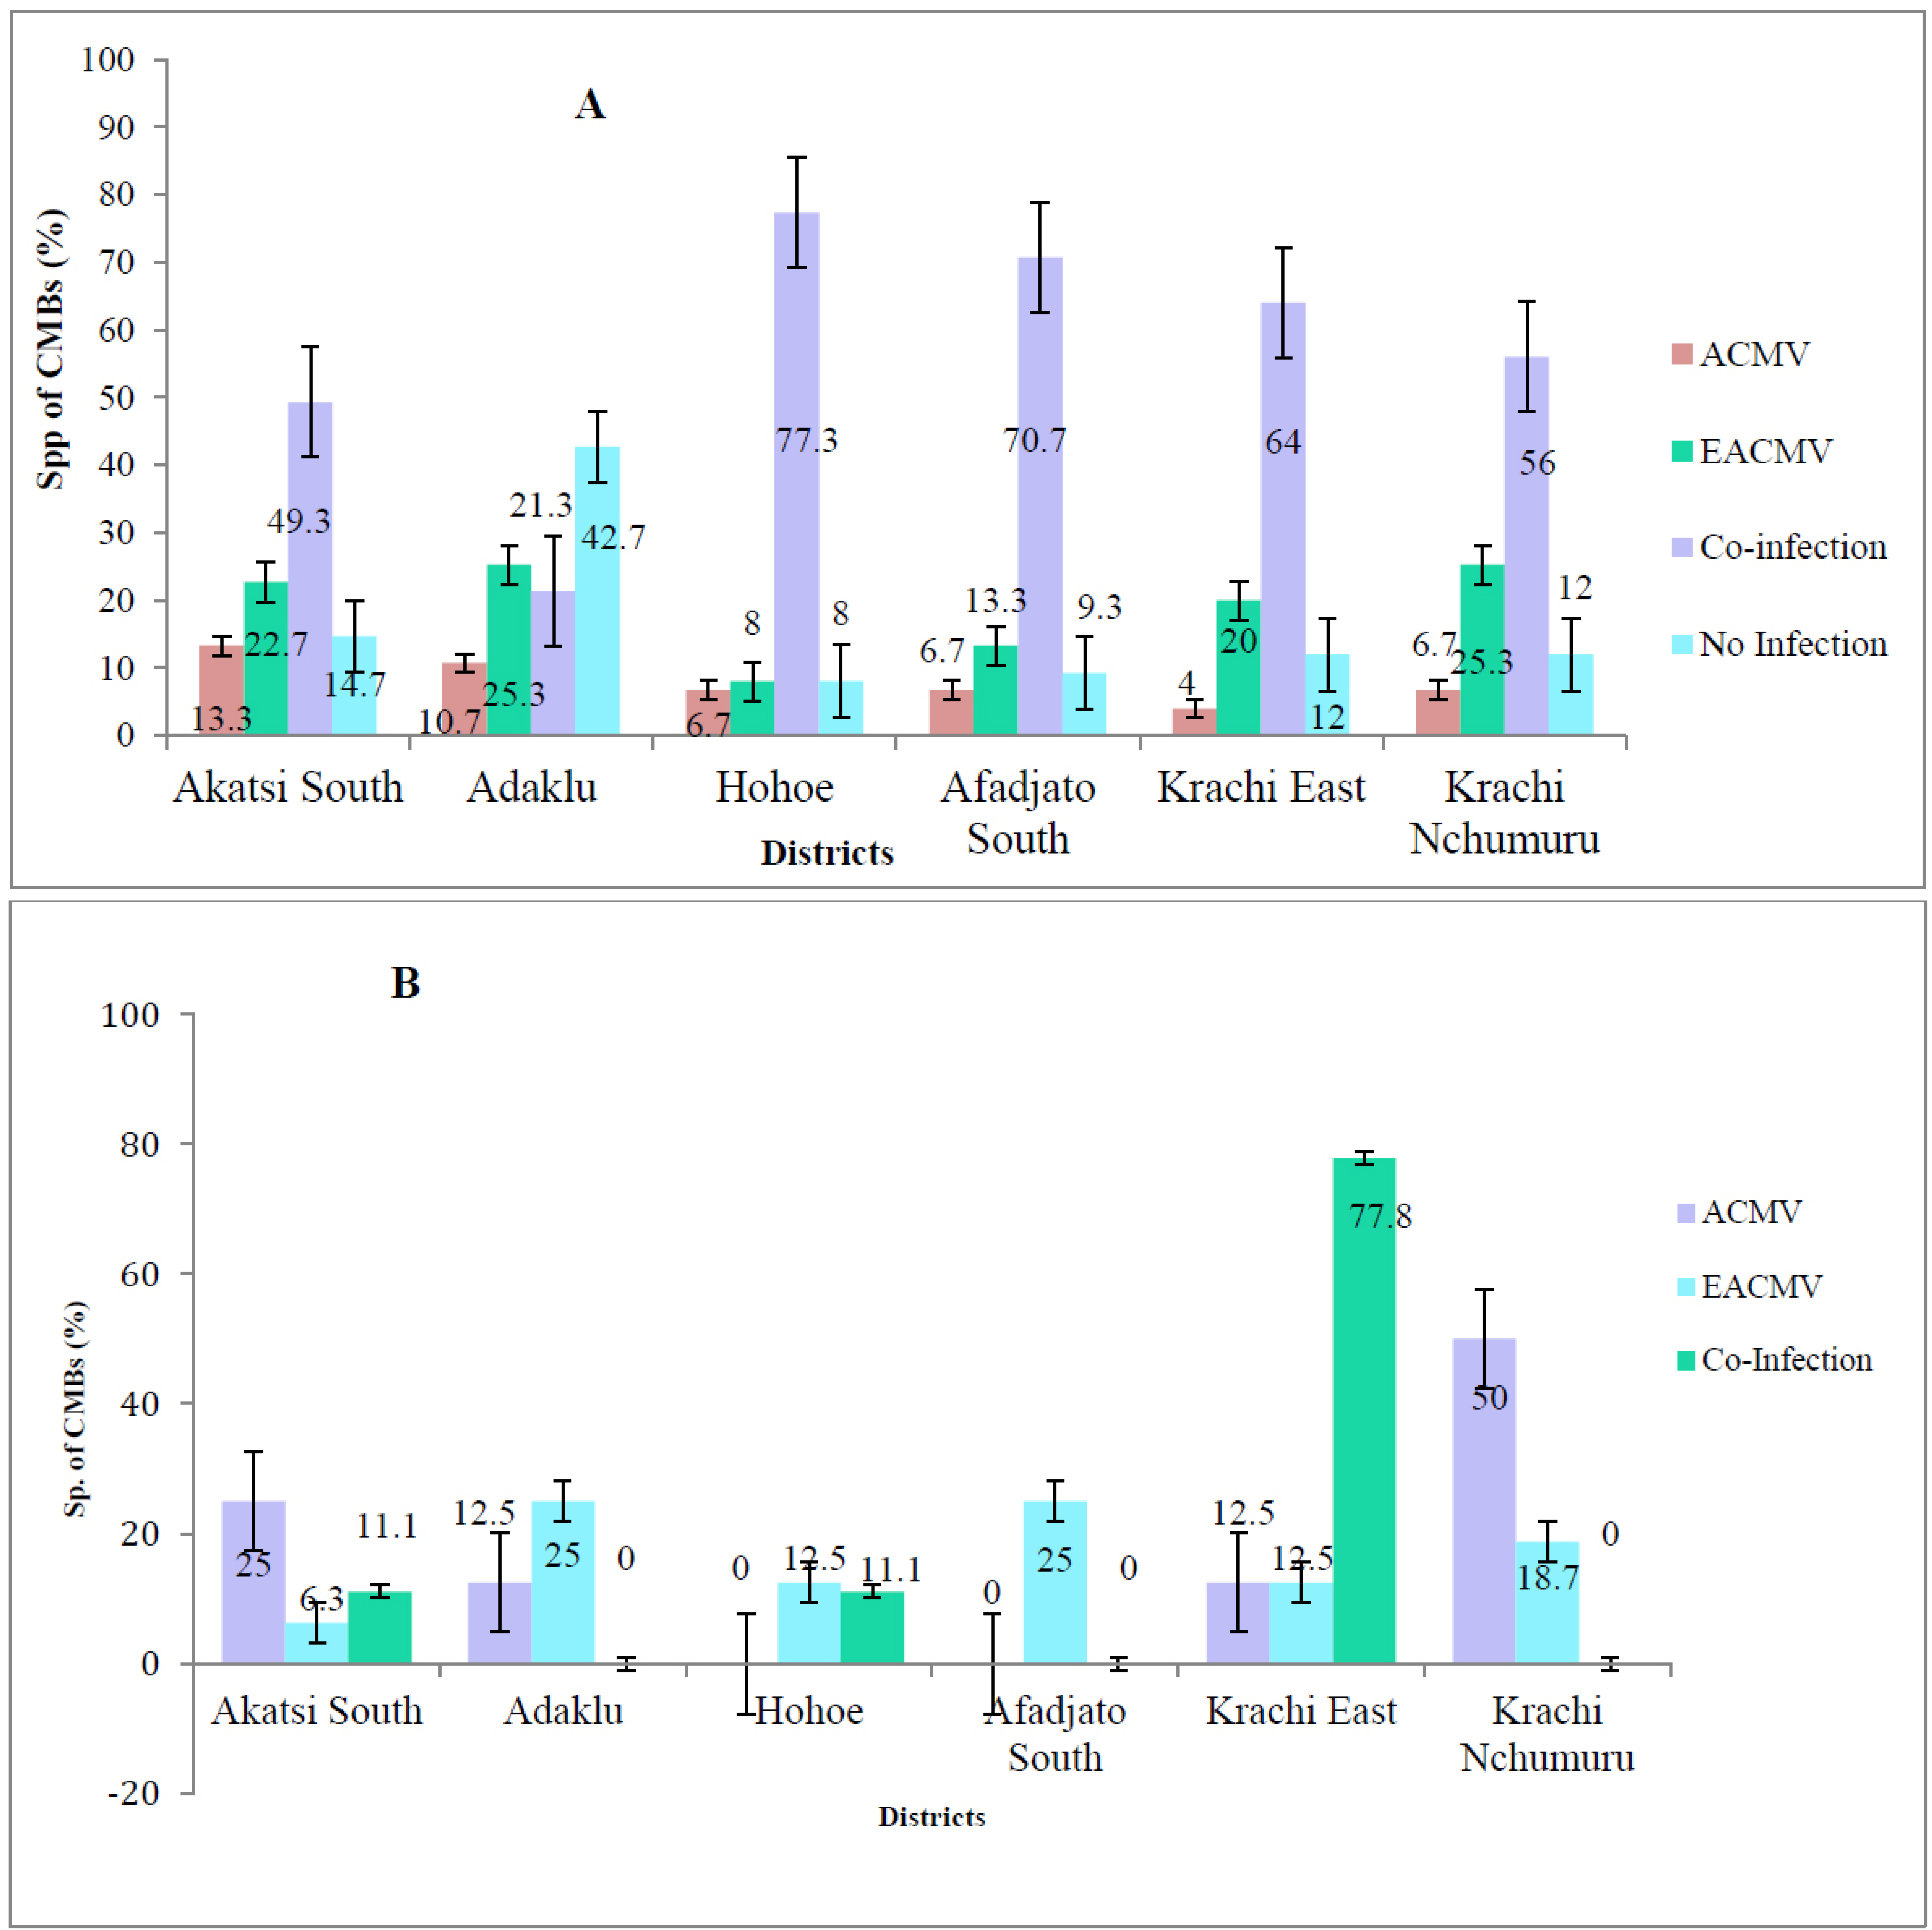
Cassava mosaic geminivirus species detected in (A) symptomatic and (B) asymptomatic leaf samples in the Volta region.
For EACMV infection in symptomatic samples (Fig. 5A), Krachi Nchumuru District and Adaklu District recorded the highest incidence (25.3%), while Hohoe had the lowest (8%).
Mixed infection of ACMV and EACMV was commonly detected in the field. The two forest zones, Hohoe Municipality and Afadjato South, recorded the highest incidence of mixed infection of 77.3% and 70.7%, respectively, whereas Adaklu recorded the lowest mixed infection of 21.3%.
4. DISCUSSION
4.1. Prevalence and Spatial Distribution of CMD in the Volta Region
Cassava production in Africa is severely constrained by CMD, which can reduce yields by up to 100% in susceptible varieties [25]. The disease is widespread across the continent, with high incidence and severity reported in cassava fields [26]. In the Volta Region of Ghana, this study observed high CMD incidence and severity, with plants exhibiting typical symptoms such as chlorosis, mosaic patterns, leaf distortion, and stunted growth.
Whiteflies, the primary vectors of CMD, were abundant in cassava fields, and their distribution varied across agro-ecological zones. Districts in the Coastal Savannah zones (Akatsi South, Krachi East, Krachi Nchumuru) recorded higher whitefly populations compared to the Forest zones (Hohoe, Afadjato South), where cooler temperatures and higher rainfall limited vector numbers [27, 9]. Adaklu, which spans Coastal, Transitional, and Forest zones, showed consistently lower whitefly counts, suggesting that mixed conditions may dampen sustained vector proliferation relative to hotter, drier areas. This zone-specific pattern underscores that whitefly abundance is shaped by local temperature–rainfall regimes and plant canopy dynamics, rather than geography alone [28]. Plant age also influenced whitefly abundance, with populations increasing between 3–7 months after planting (MAP) due to vegetative growth [29]. However, previous studies suggest that high whitefly numbers do not always correlate with high CMD incidence [26, 28], suggesting that other factors, such as widespread use of susceptible local varieties and farmers’ exchange of planting materials, play a major role in disease spread [30].
CMD severity in the Volta Region was high, with a mean severity score of 3.7, exceeding the epidemic threshold of 3.0 [9] and higher than the 2.7 reported by [31]. Mixed infections and the prevalence of EACMV, which is known to induce severe symptoms [11], likely contributed to this outcome. Additionally, the sensitivity of local cultivars to the different CMGs present in the study area may have amplified symptom severity. Co-infections increase viral DNA accumulation and symptom severity through synergistic interaction [32]. Districts such as Hohoe and Afadjato South, which had the highest co-infection rates, also recorded the most severe CMD symptoms, while Adaklu, with fewer mixed infections, showed milder disease expression.
The findings confirm that CMD in the Volta Region has reached epidemic levels, driven by susceptible local varieties, mixed infections, and vector dynamics. Effective management strategies, particularly the use of CMD-free planting materials, are urgently needed to reduce disease incidence and safeguard cassava production in Ghana.
4.2. Cassava Mosaic Geminivirus Diversity in the Volta Region
In Africa, the most common and widespread CMGs are EACMV and ACMV, which show location-specific distribution patterns [11, 28, 32]. In Ghana [33], it was reported that samples were positive for ACMV, with few single infections of EACMV, but high levels of ACMV–EACMV co-infection. Our findings similarly reveal the widespread occurrence of dual infections, which are concerning given their association with more severe CMD symptoms. The abundance of whitefly populations and the use of infected planting materials likely contributed to increased co-infection rates, consistent with earlier reports [34]. Notably, some asymptomatic plants tested positive for ACMV, EACMV, or both, reflecting the latent period before symptom expression, which is linked to viral titers [35]. These results underscore the importance of confirming CMD infections with serological or DNA-based assays rather than relying solely on visual symptoms.
CONCLUSION
CMD is highly prevalent in the Volta Region of Ghana, with incidence in many farms approaching 100%, and plants displaying severe symptoms. The study revealed that CMD severity is driven not only by whitefly populations but also by the widespread use of susceptible local varieties and the high incidence of ACMV–EACMV co-infections, which increase the risk of synergistic interactions and potential emergence of new species.
Given these findings, effective management must prioritize the use of CMD-free and resistant planting materials, coupled with farmer education on the risks of exchanging infected cuttings. Strengthening surveillance for mixed infections and promoting improved varieties adapted to local agro-ecological zones will be critical to reducing CMD incidence and safeguarding cassava production in Ghana.
AUTHORS’ CONTRIBUTIONS
It is hereby acknowledged that all authors have accepted responsibility for the manuscript's content and consented to its submission. They have meticulously reviewed all results and unanimously approved the final version of the manuscript.
LIST OF ABBREVIATIONS
| ACMV | = African Cassava Mosaic Virus |
| CMD | = Cassava Mosaic Disease |
| CMGs | = Cassava Mosaic Geminivirus |
| DNA | = Deoxyribonucleic acid |
| EACMV | = East African Cassava Mosaic Virus |
| MAP | = Month after Planting |
| TAS | = Triple Antibody Sandwich |
AVAILABILITY OF DATA AND MATERIALS
The data and supportive information are available within the article.
ACKNOWLEDGEMENTS
Declared none.

