All published articles of this journal are available on ScienceDirect.

Morphological Trait-based Prediction of Konjac (Amorphophallus muelleri Blume) Corm Yield Across Mother Corm Sizes Under Shaded and Potassium-fertilized Conditions
 iD
Azizah Misran1
iD
Juju Nakasha Jaafar1
iD
Arina Shairah Abdul Sukor3
iD
iD
Azizah Misran1
iD
Juju Nakasha Jaafar1
iD
Arina Shairah Abdul Sukor3
iD
Authors Info & Affiliations
Abstract
Introduction/Objective
Konjac (Amorphophallus muelleri Blume) is a tuberous crop grown for its glucomannan-rich corms, but yield determinants under semi-intensive production remain poorly understood. This study aimed to identify size-specific morphological traits that could serve as indicators of corm yield of A. muelleri and to determine the growth stage at which these traits showed the strongest relationships with final yield.
Methods
A factorial field experiment was conducted using two mother corm size classes (small and large) and four potassium (K) fertilization rates (0, 75, 150 and 225 kg K/ha) under 70% shade. Non-destructive and destructive measurements of root and shoot traits were taken at 12 and 18 weeks after planting (WAP), and simple linear regression analyses were conducted separately for each corm-size class to examine the relationships between selected vegetative traits and final corm yield.
Results
Adjusted coefficients of determination for the strongest fitted relationships ranged from 0.42 to 0.71. In plants derived from small mother corms, Root Fresh Weight (RFW) at 18 WAP showed the strongest association with yield, represented by the regression equation: Yield (t/ha) = 0.25 × RFW (g/plant) + 38.49 (adjusted R2 = 0.43). In plants derived from large mother corms, Petiole Fresh Weight (PFW) showed the strongest association with yield. The relationship at 12 WAP explained more variation in yield than that at 18 WAP and was represented by the regression equation: Yield (t/ha) = 0.08 × PFW (g/plant) + 33.98 (adjusted R2 = 0.71).
Discussion
The contrasting trait-yield relationships suggest different physiological limitations between corm sizes, with yield in small-corm plants being more closely linked to belowground establishment and resource acquisition, whereas in large-corm plants it is more influenced by canopy development and assimilate supply.
Conclusion
Final corm yield of A. muelleri was most strongly associated with RFW in plants derived from small mother corms and with PFW in plants derived from large mother corms. The strongest relationship was observed between PFW at 12 WAP and final yield in large-corm plants. These equations should be interpreted as exploratory, condition-specific trait–yield relationships rather than validated prediction models. Because they were derived from a single-location, single-season experiment conducted under 70% shade and a fixed management system, validation across locations, seasons, shade levels, and management practices is required before any predictive application.
1. INTRODUCTION
Konjac (Amorphophallus muelleri Blume) is a tuberous crop native to Southeast Asia that has gained increasing attention as a high-value industrial raw material. Its underground corms are rich in glucomannan, a water-soluble dietary fiber widely used in the food, pharmaceutical, and functional ingredients industries [1]. In Malaysia, although there are numerous reports of A. muelleri thriving in natural forests [2, 3] and its economic potential has been recognized, the crop is still relatively new and, to date, there are no records of large-scale commercial production. In contrast, in Indonesia, A. muelleri has rapidly emerged as an export commodity, with expanding planted area in community forests and agroforestry systems and growing demand from processing industries [4, 5]. Despite this economic potential, average corm yields remain modest and highly variable, partly because the crop is often managed with low fertilizer inputs, heterogeneous shading conditions, and limited technical guidance for farmers [6].
Unlike aboveground crops where yield components can be estimated visually before harvest, konjac corms develop underground and remain largely hidden until the canopy has senesced. This makes it difficult for farmers and buyers to assess performance in advance and plan for harvesting, storage, contract arrangements, and processing capacity [7, 8]. Identifying morphological traits that can be measured during the growing season and are associated with final corm yield is therefore important as an initial step towards developing future yield-estimation tools for supporting on-farm decision-making, scheduling labor and transport, and managing supply for glucomannan processing and marketing [7, 8]. This is more crucial in semi-intensive systems, where investments in fertilizer and planting material are higher, and producers require clearer information on expected returns.
Previous attempts to predict konjac yield have mainly been developed from large, heterogeneous field populations. In East Java agroforests [7], related corm traits to canopy diameter and bulbil number, while in smallholder fields in Tak Province, Thailand [8], showed that stem diameter at ground level can be used as a practical predictor of corm weight. Together, these studies demonstrate that simple morphological measurements can capture much of the variation in underground yield, but the resulting models do not distinguish between plants derived from different mother corm sizes or account for defined fertilizer regimes, which limits their applicability to semi-intensive production systems.
Recent studies also indicate that morphological development and corm growth in A. muelleri are influenced by both the production environment and plant developmental stage. Shading has been reported to affect shoot emergence, petiole and leaf morphology, and corm growth in A. muelleri [9]. At the physiological level [10], demonstrated marked changes in carbohydrate allocation between mother and daughter corms during the relay-growth cycle, reflecting the transition from dependence on reserves stored in the mother corm to assimilate accumulation in the developing daughter corm. These findings suggest that the morphological traits associated with final corm yield may vary according to the growing environment, initial planting material and developmental stage at which the plants are assessed.
There is therefore a need to evaluate yield determinants of A. muelleri under semi-intensive field conditions where key agronomic factors can be examined separately. In particular, little is known about whether the traits that best explain yield differ between plants derived from different mother corm sizes, and at which developmental stages these traits most reliably reflect final corm production. It was hypothesized that the morphological traits associated with final corm yield and the strength of these relationships would differ between plants derived from small and large mother corms and across growth stages. Therefore, the specific objectives of this study were to (i) identify the morphological traits most strongly associated with final corm yield in plants derived from small and large mother corms, and (ii) determine the sampling time at which these trait-yield relationships were strongest under shaded and fertilized conditions.
2. MATERIALS AND METHODS
2.1. Experimental Site and Weather Conditions
The experimental site was located at Field 15, Faculty of Agriculture, Universiti Putra Malaysia (2° 59' 07.7” N, 101° 44' 05.3” E) on a Munchong-Seremban soil series. During the experimental period (December 2024 – June 2025), monthly precipitation ranged from 100.7 mm (June 2025) to 357.47 mm (April 2025), while relative humidity ranged from 86.1% (February 2025) to 90.2% (December 2024). The absolute maximum and minimum daily temperatures recorded were 33.4°C and 19.0°C, respectively, whereas the mean daily maximum and minimum temperatures were 34.3°C and 23.6°C, respectively.
2.2. Planting Materials
The original A. muelleri planting material was sourced from Johor, Malaysia, and provided by Ladang Konjak Pte Ltd. Seed-derived A. muelleri corms were planted in November 2023 and harvested in August 2024. A. muelleri corms derived from seed-grown plants established in November 2023 and harvested in August 2024 were collected for dormancy storage (n=867), treated with fungicide Previcur 840 (propamocarb 47.3% + fosetyl 27.7% w/w; Bayer, Malaysia), and kept in an ambient shaded room with temperature at 27°C ± 1°C during dormancy. After three months (December 2024), the corms with an apical bud of 2.5 ± 1.0 cm were visually graded, and only healthy corms free from visible disease symptoms and mechanical injury were selected. The selected corms were then weighed and categorized based on two size classes: (small: 20-70 g, large: 100-150 g) before planting directly into the soil at about 10 cm depth. The handling and use of plant materials complied with applicable plant quarantine regulations of the Department of Agriculture Malaysia, and all field research activities were conducted in accordance with relevant institutional research protocols.
2.3. Agronomic Practices
The plot was treated with 1.5 t/ha of ground magnesium limestone (GML; 15% MgO, 40% CaO), ten days before planting. Lime was applied simultaneously with processed chicken manure at 5 t/ha. Planting beds with 35 ± 5 cm (height) × 105 ± 5 cm (width) × 175 ± 5 cm (length) were then constructed for each experimental unit and covered using UV polyethylene mulch. Each planting bed contained 26 plants arranged in two rows, with 13 plants per row. The distance between rows was 60 cm, while plants within each row were spaced 30 cm apart. The diameter of each planting point was 20 cm. The plants were grown under a 70% shade net and irrigated using a drip irrigation system. Irrigation was applied at a volume of 0.4 L/plant/irrigation event, twice daily on non-rainy days throughout the growing period. Irrigation was omitted on days when rainfall occurred. Christmas Island Rock Phosphate (CIRP; 30–31% P2O5; distributed by Phosphate Resources (M) Sdn. Bhd., Selangor, Malaysia; origin: Australia) at the rate of 200 kg/ha P2O5 was used as the source of P during planting, while ammonium sulfate (20.5% N; origin: China) at a rate of 50 kg/ha N was used as the source of N, at seven days of planting. After nine weeks of planting, the plants grown from both corm sizes were given four different rates of muriate of potash (MOP; 60% K2O; Twin Arrow Brand, packed by Twin Arrow Fertilizer Sdn. Bhd., Selangor, Malaysia), viz. 0, 75, 150 and 225 kg/ha K2O. All fertilizers were applied within the canopy of the plants.
2.4. Data Collection
Sampling was done at 12 and 18 weeks after planting (WAP) in each corm size. For each corm-size class, there were 16 experimental units, representing four K rate treatments × four replications, with 26 plants established in each experimental unit. This sample size reflected one destructively sampled plant from each experimental unit, while preserving sufficient plants for final corm yield assessment. Measurement of Petiole Height (PH) was taken from the surface of the soil to the midrib branching by using a measuring tape, while Petiole Diameter (PD) was measured at the lowest part of the petiole using a digital caliper (Model SCM DIGV-6, Mitutoyo, Japan). The relative chlorophyll content (SPAD) was determined by averaging three readings from the middle portion of the fully expanded leaflets using a chlorophyll meter (SPAD-502 Plus, Konica Minolta Optics, Inc., Japan). The whole plants were then separated into leaflets, petiole, and root. The fresh weight of each part (leaflet fresh weight; LFW, petiole fresh weight; PFW, and root fresh weight; RFW) was determined using an analytical balance. Leaflet areas were measured and recorded as total leaflet area per plant using an automatic leaf area meter (Model LI-300, LI-COR). When all the senescent plants had dried and entered dormancy at 27 WAP (June 2025), all the remaining corms were harvested. The corms were thoroughly washed to remove all the dirt and then left to dry overnight. The corm fresh weight was determined using a digital scale. The average fresh weight of all the corms (20 – 25 corms per experimental unit) was recorded. Yield was expressed in t/ha by multiplying the mean corm fresh weight per plant by the plant density (55,533 plants/ha). Missing or dead plants were not replaced. Only surviving plants were included in the determination of mean corm fresh weight. Morphological variables measured are illustrated in Fig. (1).
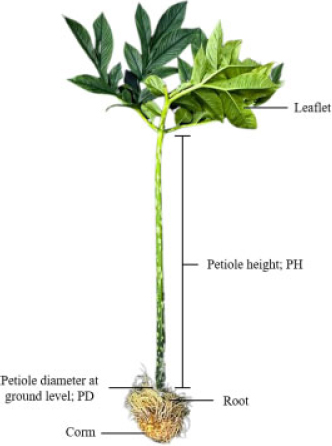
Data collected for yield prediction model in A. muelleri.
2.5. Experimental Design and Statistical Methods
The experiment was arranged as a 2 × 4 factorial in a Randomized Complete Block Design (RCBD) with four replications. The treatments consisted of two mother corm size classes, namely small (20–70 g) and large (100–150 g), and four K fertilization rates (0, 75, 150 and 225 kg K2O/ha), resulting in eight treatment combinations and 32 experimental units. Each planting bed represented one experimental unit. Normality of standardized residuals was assessed using Shapiro-Wilk tests and Q-Q plots, and basic descriptive statistics were computed for residuals to verify that model assumptions were met. Pearson’s correlation coefficient (r) was computed to assess the linear relationships between yield and other explanatory factors, with r ranging from −1 to +1, where negative values indicate negative correlations, positive values indicate positive correlations, and values close to zero indicate no association. The magnitude of r was interpreted following [11] as low (r = 0.10–0.29), medium (r = 0.30–0.49), and high (r = 0.50–1.0).
Factors showing a significant linear association with yield were subsequently considered as candidate predictors in a forward stepwise multiple regression analysis. Variables were entered into the model based on statistical significance (p < 0.05). In each fitted model, only one predictor met the criterion for inclusion, while no additional predictor significantly improved the model. Consequently, the final selected models contained a single predictor and were expressed as simple linear regression models. Final model selection was based on a significant F-test at α = 0.05 (p < 0.05), the highest coefficient of determination (R2), and the lowest standard error of the estimate (SE), following [8].
The factorial treatments were used to generate variation in plant growth and final corm yield under the tested production conditions. However, the objective of the regression analysis was not to quantify the main effects of mother corm size or K fertilization, but to identify morphological traits associated with final yield within each mother-corm size class. Mother corm size was therefore accounted for by dividing the dataset according to corm-size class and fitting separate models for plants derived from small and large mother corms. Observations from the four K rates were pooled within each corm-size class so that the models represented trait-yield relationships across the tested K fertilization range of 0-225 kg/ha K2O. Linear regression models were fitted separately for each corm class using n = 16 observations per model. All analyses were performed in JASP (v.0.19.3, University of Amsterdam, The Netherlands).
3. RESULTS AND DISCUSSION
3.1. Correlations between Vegetative Traits and Konjac Yield at Different Sampling Times in Plants Derived from Small and Large Mother Corms
Correlations between vegetative traits and yield differed between plants derived from small and large corms and between sampling times. For plants derived from small corms, none of the traits measured at 12 WAP were significantly correlated with yield (Table 1); therefore, no exploratory regression equation was fitted for this stage. At 18 WAP, Root Fresh Weight (RFW) showed the strongest association with yield (r = 0.69, p < 0.01), whereas other traits were more strongly intercorrelated with each other than with yield (Table 2). For plants derived from large corms, several vegetative traits were positively correlated with yield at 12 WAP, with Petiole Fresh Weight (PFW) showing the highest correlation (r = 0.86, p < 0.001; Table 3).
| Small Corm (12 WAP) | |||||||
|---|---|---|---|---|---|---|---|
| Variable | Yield | PH | PD | LA | LFW | PFW | RFW |
| PH | 0.07 | — | |||||
| PD | 0.06 | 0.58* | — | ||||
| LA | 0.25 | 0.26 | 0.04 | — | |||
| LFW | 0.29 | 0.34 | 0.12 | 0.98*** | — | ||
| PFW | 0.46 | 0.53* | 0.18 | 0.80*** | 0.83*** | — | |
| RFW | 0.23 | 0.10 | -0.13 | 0.86*** | 0.86*** | 0.65** | — |
| SPAD | 0.11 | -0.32 | 0.17 | -0.20 | -0.19 | -0.44 | -0.16 |
* p < 0.05, ** p < 0.01, *** p < 0.001
| Small Corm (18 WAP) | |||||||
|---|---|---|---|---|---|---|---|
| Variable | Yield | PH | PD | LA | LFW | PFW | RFW |
| PH | 0.27 | — | |||||
| PD | 0.34 | 0.79*** | — | ||||
| LA | 0.37 | 0.91*** | 0.80*** | — | |||
| LFW | 0.30 | 0.91*** | 0.76*** | 0.96*** | — | ||
| PFW | 0.32 | 0.92*** | 0.93*** | 0.92*** | 0.91*** | — | |
| RFW | 0.69** | 0.74** | 0.73** | 0.81*** | 0.81*** | 0.77*** | — |
| SPAD | 0.21 | 0.06 | 0.07 | 0.21 | 0.18 | 0.14 | 0.07 |
* p < 0.05, ** p < 0.01, *** p < 0.001
| Big Corm (12 WAP) | |||||||
|---|---|---|---|---|---|---|---|
| Variable | Yield | PH | PD | LA | LFW | PFW | RFW |
| PH | 0.52* | — | |||||
| PD | 0.55* | 0.71** | — | ||||
| LA | 0.26 | 0.04 | 0.22 | — | |||
| LFW | 0.60* | 0.55* | 0.59* | 0.53* | — | ||
| PFW | 0.86*** | 0.75*** | 0.73** | 0.33 | 0.71** | — | |
| RFW | 0.59* | 0.09 | 0.29 | 0.02 | 0.44 | 0.49 | — |
| SPAD | 0.10 | -0.04 | -0.02 | -0.60* | -0.22 | -0.10 | 0.21 |
* p < 0.05, ** p < 0.01, *** p < 0.001
At 18 WAP, yield remained significantly associated with multiple traits, and PFW again showed a strong correlation with yield (r = 0.68, p < 0.01), as well as strong intercorrelations with other vegetative variables (Table 4). These patterns indicated strong intercorrelations among the vegetative traits, particularly in plants derived from large corms.
| Big Corm (18 WAP) | |||||||
|---|---|---|---|---|---|---|---|
| Variable | Yield | PH | PD | LA | LFW | PFW | RFW |
| PH | 0.64** | — | |||||
| PD | 0.66** | 0.68** | — | ||||
| LA | 0.66** | 0.51* | 0.71** | — | |||
| LFW | 0.53* | 0.48 | 0.58* | 0.75*** | — | ||
| PFW | 0.68** | 0.85*** | 0.95*** | 0.74** | 0.64** | — | |
| RFW | 0.13 | 0.32 | 0.67** | 0.48 | 0.33 | 0.60* | — |
| SPAD | 0.33 | 0.13 | 0.02 | -0.12 | -0.12 | 1.83×10⁻³ | -0.24 |
* p < 0.05, ** p < 0.01, *** p < 0.001
Although the experiment was established as a factorial combination of mother corm size and K rate, the present analysis focused on the relationships between vegetative traits and final corm yield rather than on treatment comparisons. Mother corm size was incorporated into the analysis by conducting separate regression analyses for each corm-size class because plants derived from small and large mother corms followed different growth trajectories. Potassium rate was not included as an explanatory variable because the purpose of the regression analyses was to determine which plant traits were most strongly associated with final yield across the range of K conditions evaluated. Thus, the resulting regression coefficients describe pooled trait-yield relationships across the four K rates and should not be interpreted as evidence that K fertilization had no effect on plant growth or yield.
Based on the correlation analysis and the strong intercorrelations among several vegetative traits, the forward stepwise regression procedure retained only one predictor for each fitted model. Therefore, the final selected models were expressed as simple linear regressions. These were RFW for plants derived from small mother corms at 18 WAP and PFW for plants derived from large mother corms at 12 and 18 WAP. In plants derived from small mother corms, none of the traits measured at 12 WAP showed a significant relationship with final yield, whereas RFW showed a moderate positive relationship with yield at 18 WAP. In plants derived from large mother corms, PFW was strongly associated with final yield at both 12 and 18 WAP, although the relationship was stronger at 12 WAP.
3.2. Simple Linear Relationships between Selected Vegetative Traits and Konjac Yield
For plants derived from small corms, yield at harvest increased with root fresh weight at 18 WAP, as represented by the regression equation, Yield (t/ha) = 0.25 RFW (g/plant) + 38.49 (adjusted R2 = 0.43; RMSE = 5.64 t/ha), p=0.003. Root fresh weight at 18 WAP accounted for 43% of the variation in yield, with yield increasing by 0.25 t/ha for each 1 g increase in root fresh weight (Table 5). The RMSE indicated that the fitted yield values differed from the observed values by approximately 5–6 t/ha, on average, within the dataset used to derive the equation.
| Small Corm (18 WAP) | |||||
|---|---|---|---|---|---|
| Predictor | β₀ (Intercept) | β₁ (Slope) | p-value | Adjusted R² | RMSE |
| RFW (g/plant) | 38.49 | 0.25 | ** | 0.43 | 5.64 |
* p < 0.05, ** p < 0.01, *** p < 0.001
For plants derived from large corms, yield was positively related to petiole fresh weight. At 12 WAP, the regression equation, Yield (t/ha) = 0.08 PFW (g/plant) + 33.98 (adjusted R2 = 0.71; RMSE = 7.54 t/ha), p= 0.00002, indicated that PFW explained 71% of the variation in yield (Table 6). At 18 WAP, the corresponding regression equation, Yield (t/ha) = 0.06 PFW (g/plant) + 38.31 (adjusted R2 = 0.42; RMSE = 10.68 t/ha), p= 0.004 showed a weaker relationship, with 42% of the variation in yield explained and a 41.64% higher RMSE compared to 12 WAP, indicating larger average deviations between fitted and observed yield values within the analyzed dataset (Table 6).
| Big Corm (12 AND 18 WAP) | ||||||
|---|---|---|---|---|---|---|
| Stage (WAP) | Predictor | β₀ (Intercept) | β₁ (Slope) |
p-value | Adjusted R² | RMSE |
| 12a | PFW (g/plant) | 33.98 | 0.08 | ** | 0.71 | 7.54 |
| 18b | PFW (g/plant) | 38.31 | 0.06 | ** | 0.42 | 10.68 |
bThe following covariates were considered but not included - LA, PD, PH, LFW
RMSE = Root mean square error, PFW = petiole fresh weight , PD = petiole diameter, PH = petiole height, RFW = root fresh weight, LA = leaf area, LFW = leaflet fresh weight
* p < 0.05, ** p < 0.01, *** p < 0.001
The present study used a factorial field trial involving two mother corm sizes and four K rates under 70% shade, with plants derived from small and large mother corms analyzed separately. Only 16 plants per corm-size class and sampling time could be destructively sampled, resulting in relatively small sample sizes and moderate adjusted coefficients of determination (adjusted R2 = 0.42–0.71). Given these constraints and the multicollinearity among several vegetative traits, the analyses were limited to simple linear relationships with one predictor and should primarily be interpreted as trait-yield associations and should be interpreted as exploratory trait-yield associations rather than validated predictive tools. Furthermore, the regression relationships were derived from data collected at a single location during one growing season, under a single shade level and a fixed management system comprising uniform planting density, irrigation and fertilization practices. Consequently, the identified trait–yield relationships may be specific to the environmental and management conditions of this experiment. External validation using independent datasets across different locations, seasons, shade levels, soil conditions and management practices is therefore required before the regression equations can be considered for predictive application. These experimental constraints, particularly the relatively small sample size and restricted range of plant and environmental variation, may also explain why the adjusted R2 values obtained in the present study were lower than those reported from larger and more heterogeneous field populations.
In East Java agroforests [7], used multiple regression to relate corm traits to canopy diameter and bulbil number across substantial environmental and plant-age gradients and obtained high coefficients of determination (R2 = 0.88–0.99). Similarly, in Thailand [8], sampled 163 plants from smallholder fields and developed a simple log–log model in which stem diameter at ground level (D0) explained most of the variation in corm weight (R2 = 0.95). The higher R2 values in those studies likely reflect their larger sample sizes and the wider variation in plant size, age and growing conditions compared with the more restricted and controlled conditions of the present factorial trial.
The vegetative traits most strongly associated with final yield differed between plants derived from small and large mother corms, suggesting that corm size altered the principal physiological processes associated with daughter-corm development. These relationships should not be interpreted as evidence of direct causation; rather, RFW and PFW may function as integrative indicators of different growth processes operating within each mother-corm size class. Initial propagule size is known to influence early growth trajectories and source-sink relationships in A. muelleri [10, 12] and other tuberous crops such as potato [13, 14].
In plants derived from small mother corms, the stronger relationship between RFW and final yield at 18 WAP may reflect their greater dependence on successful root establishment and continued resource acquisition. Small mother corms contain more limited initial carbohydrate and nutrient reserves and may therefore depend more strongly on the developing root system to acquire water and mineral nutrients needed to sustain canopy growth and daughter-corm expansion. A larger root system may provide greater soil exploration and uptake capacity, thereby supporting continued assimilate production and allocation to the developing corm. This interpretation is consistent with the importance of root-system size, root distribution and root–shoot balance in maintaining tuber growth under resource-limiting conditions [15, 16]. The absence of a significant relationship at 12 WAP may indicate that differences in root development had not yet accumulated sufficiently to be reflected in final yield, whereas RFW at 18 WAP represented the cumulative outcome of establishment and resource acquisition over a longer period.
In contrast, plants derived from large mother corms began growth with larger stored carbohydrate and nutrient reserves, which may have reduced their early dependence on differences in root-system development. Under these conditions, variation in final yield was more closely associated with PFW, which may integrate several aspects of aboveground growth, including canopy development, tissue biomass and the capacity to support assimilate production and transport to the developing daughter corm. A larger and more vigorous petiole is generally associated with a better-developed canopy, which can increase light interception and photosynthetic assimilate supply during the main vegetative growth period. Thus, the association between PFW and yield in large-corm plants may indicate that daughter-corm expansion was more strongly linked to aboveground source capacity than to belowground establishment.
The stronger PFW-yield relationship at 12 WAP than at 18 WAP can also be interpreted in relation to the growth cycle of A. muelleri. The species produces a single compound leaf that expands during vegetative growth and subsequently senesces as the corm approaches dormancy [2, 9, 17, 18]. At approximately 12 WAP, the canopy was closer to its period of active expansion and assimilate production, making PFW a more representative indicator of source capacity. By 18 WAP, progressive senescence, tissue dehydration, and remobilization of assimilates from the canopy to the corm may have weakened the relationship between petiole biomass and final yield. Therefore, the weaker relationship at 18 WAP likely reflects developmental changes in canopy function rather than simply a decline in statistical performance.
In both agroforestry and smallholder systems [7], and [8] fitted their models on log-transformed scales, which linearize relationships between size traits and yield and help stabilize variance across very wide size and age ranges. In the present factorial trial, trait distributions within each corm size class were more restricted and regression assumptions were adequately met on the original scale, so both the explanatory traits and yield were retained in raw units rather than being transformed. Residuals of all fitted regression equations in this study were approximately normally distributed, as indicated by Q–Q plots (Figs. 2, 3) and non-significant values of Shapiro–Wilk.
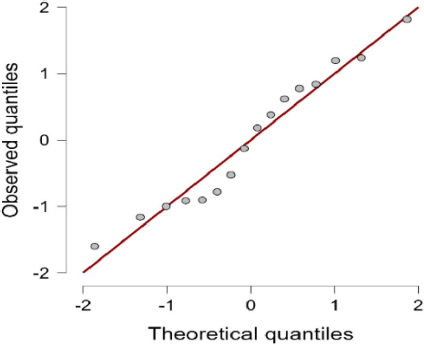
Q-Q plot of regression model for plants derived from small corm at 18 WAP.
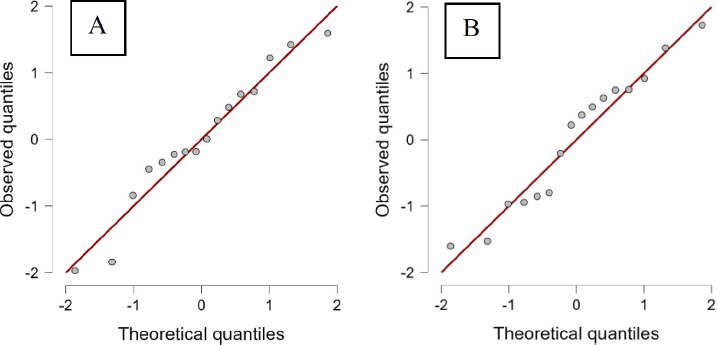
Q-Q plot of regression model for plants derived from big corm at 12 WAP (A) and 18 WAP (B).
Although RFW and PFW showed the strongest relationships with final corm yield, both traits have restricted practical value for routine field-based yield assessment because their measurement is destructive. Determining RFW requires uprooting the plant and removing the root system from the soil, which terminates the sampled plant and prevents its subsequent harvest. Similarly, measuring PFW requires removal of the functional canopy, thereby eliminating the monitored plant from production. Fresh-weight measurements may also vary with short-term plant water status, environmental conditions, and the interval between sampling and weighing, which could reduce measurement consistency under field conditions.
These limitations contrast with previously reported non-destructive indicators of konjac yield. In East Java agroforestry systems [7], related corm yield to canopy characteristics, including canopy diameter, whereas [8] identified stem diameter at ground level as a practical indicator of corm weight in smallholder fields in Thailand. Such traits can be measured repeatedly on standing plants using simple field equipment without reducing the final harvested population, making them more suitable for routine farm-level assessment than RFW or PFW. Although the destructive traits identified in the present study provided useful information on the organs most strongly associated with final yield under the tested conditions, they should not be regarded as readily applicable field tools for commercial yield estimation.
Therefore, RFW and PFW are better interpreted as destructive calibration traits that provide insight into the contrasting physiological basis of yield formation in plants derived from small and large mother corms. Future studies should evaluate whether these relationships can be represented by non-destructive measurements, such as petiole diameter, plant height, canopy dimensions or image-based canopy characteristics, and should validate these indicators using larger independent datasets across different production environments.
CONCLUSION
Under 70% shade and across four K fertilization rates (0–225 kg/ha K2O), final corm yield of A. muelleri was most strongly associated with RFW in plants derived from small mother corms and with PFW in plants derived from large mother corms. In large-corm plants, the relationship between PFW and final yield was stronger at 12 WAP than at 18 WAP, when plants were approaching senescence.
AUTHORS’ CONTRIBUTIONS
The authors confirm their contribution to the paper as follows: M.N., O.G., M., M.Y., A.S, A.S., J.N., J., A., M.: Study conception and design; M.N., O.G.: Data collection; M.N., O.G., A.S., A.S.: Analysis and interpretation of results; M.N., O.G., A.S., A.S., M., M.Y.: Draft manuscript. All authors reviewed the results and approved the final version of the manuscript.
LIST OF ABBREVIATIONS
| GML | = Ground magnesium limestone |
| K | = Potassium |
| LFW | = Leaflet fresh weight |
| MOP | = = Muriate of potash |
| PD | = Petiole diameter |
| PFW | = Petiole fresh weight |
| PH | = Petiole height |
| Q–Q | = Quantile–quantile |
| RFW | = Root fresh weight |
| RMSE | = Root mean square error |
| SE | = Standard error |
| SPAD | = Soil Plant Analysis Development |
| UV | = Ultraviolet |
| WAP | = Weeks after planting |
| w/w | = Weight by weight |
AVAILABILITY OF DATA AND MATERIALS
All data generated or analyzed during this study are included in this published article.
FUNDING
The authors would like to express their gratitude to Universiti Putra Malaysia (UPM) for the financial support provided through the Industrial Research Grant in collaboration with Ladang Konjak Ltd. (Vot No: 6300420) under the project title “Evaluation of Different Local and Imported Konjac Varieties for Growth, Yield Potential and Enhancing the Accumulation of Glucomannan in Konjac Grown at Two Different Locations”.
ACKNOWLEDGEMENTS
The authors gratefully acknowledge the lab assistants from the Department of Crop Science and the Department of Land Management, Faculty of Agriculture, Universiti Putra Malaysia (UPM), for their technical support during sampling and analyses. They also thank Mr F, Mr N, Mr Z and Mr H for their assistance with data collection. They are thankful to the Malaysian Agricultural Research and Development Institute (MARDI) for granting study leave, and to Y K for providing financial assistance throughout the study period.