All published articles of this journal are available on ScienceDirect.

Effect of Water Deficit Stress on Reproductive Stage of Durum Wheat Near Isogenic Lines Carrying the NAM-B1 Gene
Authors Info & Affiliations
Abstract
Background
In wheat, the NAC family plays a crucial role in conferring cellular responses to different abiotic stresses, particularly drought. The functional NAM-B1 allele in durum wheat accelerates senescence, while its homologous genes contribute to improved water deficit stress tolerance. Therefore, the main objective of this study was to investigate the role of the NAM-B1 gene in durum wheat subjected to water deficit stress at two reproductive stages.
Materials and Methods
Three Near-Isogenic Lines carrying a functional NAM-B1 allele and their recurrent parent, Langdon (LDN), were used in this study. The study assessed NILs and LDN performance under varied water conditions (well-watered, 60%, and 80% water deficit of pot capacity) during flag leaf and anthesis stages. The agronomic performance of the three NILs and LDN was assessed for 16 traits, including plant height, grain yield, and thousand kernel weight. Additionally, physiological measurements, including stomatal resistance, chlorophyll content (SPAD values), and chlorophyll fluorescence (Fv/Fm) were taken.
Results
Significant genotypic effects were observed on seven agronomic traits, while 15 traits were influenced by the water stress treatment. The NILs exhibited accelerated maturity and a shorter grain-filling period, which were particularly pronounced under stress conditions. Severe water deficit resulted in reduced grain weight and thousand-grain weight in tested genotypes. Interestingly NILs carrying functional NAM-B1 showed taller plants and had higher tiller and spike numbers when compared to LND. Significant genotypic effects were observed for seven traits, and water stress treatments affected 15 traits. The NILs exhibited accelerated maturity and reduced grain weight under severe water deficit. Physiological measurements showed genotype and water-deficit differences, with NIL #504 displaying higher SPAD values, particularly under stress conditions, and a significant genotype X treatment effect was observed for stomatal resistance at the anthesis stage.
Discussion
Limited treatment × genotype interactions for most traits highlight the complexity of drought tolerance in the tested lines, which might be attributed to its quantitative nature influenced by multiple genes. The study emphasizes the necessity for future research to explore the role of other NAM-related genes in response to water deficit stress and their interactive effects with the NAM-B1 gene at different growth stages in wheat plants subjected to diverse stress conditions.
Conclusion
In conclusion, this study reveals pronounced genotypic effects, particularly in agronomic traits, such as maturation rate and grain filling period, under severe water deficit stress. Future studies are needed to understand the genetic mechanisms mediated by NAM-B1 genes in accelerating maturity in response to stress.
1. INTRODUCTION
Wheat (Triticum spp.) is one of the most important cultivated crops in the world. It ranks first among cultivated plants in terms of cultivated areas around the globe [1]. It is considered a major staple food for over 35% of the world's population, providing more than 20% of their daily protein and calorie needs [2]. Durum wheat (Triticum turgidum ssp. durum) constitutes approximately 10% of the total cultivated wheat area and is predominantly cultivated in the Mediterranean region under rainfed conditions [3]. Its distinctive vitreous grain structure and high protein content make it suitable for various uses, including the production of pasta, semolina, flatbreads, couscous, and bulgur [4, 5].
Climate change and associated conditions, including changes in temperature, precipitation patterns, and the frequency and intensity of extreme weather events [6], are expected to have a significant impact on the productivity of many crops, including wheat [7]. Drought is one of the most common environmental stresses that can have a significant impact on the growth and development of wheat plants [8]. Under such conditions, wheat production and quality are adversely affected, especially during critical growth stages, such as heading and grain-development phases [9]. For instance, severe drought stress in wheat plants during the grain-filling stage reduced yields by 44% [10]. In another study, prolonged mild drought stress at the heading stage reduced grain yield by 58% [11]. Several yield-related traits, including spike length, grains per spike, total biomass, and grain yield, are expected to be affected under drought conditions [6, 7]. Hence, there is an urgent need to breed new wheat varieties with climate-smart traits capable of tolerating various abiotic stresses, including drought [12].
The identification and utilization of key regulatory genes associated with stress tolerance is considered a priority for producing new varieties with improved drought tolerance [13]. In this regard, transcription factors play essential roles in controlling multiple gene expression pathways and are considered key regulatory genes for many cellular processes [14]. In plants, the NAC (NAM-ATAF-CUC2) or NAM (No Apical Meristem) transcription factor family plays a major role in regulating various cellular processes, such as hormonal signaling, plant development, and responses to biotic and abiotic stresses [15]. Additionally, NAM genes play important roles in regulating gene expression changes during leaf senescence, and several NAM genes have been found to promote Reactive oxygen species (ROS) accumulation and significantly accelerate age-dependent as well as drought- and Abscisic acid (ABA) -induced leaf senescence [16, 17]. NAM genes associated with abiotic stress tolerance have been cloned and successfully used to improve stress tolerance, particularly drought tolerance, in different crop species [18-21].
In wheat, the NAM-B1 gene was cloned as a major locus for grain protein content and senescence [22]. The NAM-B1 gene is considered a positive regulator of senescence and is associated with increased protein, Fe, Mn, and Zn contents in wheat grains [23]. Kaznina et al. [24] demonstrated that wheat plants carrying a functional allele of the NAM-B1 gene exhibit good growth under zinc deficiency conditions without any decrease in yield. In nature, this gene is only functional in wild emmer and a few domesticated emmer wheat varieties, while frame-shift mutations or deletions in its coding sequence have been identified in modern bread or durum wheat genotypes, resulting in loss-of-function alleles and delayed senescence [21, 25]. This gene has been introgressed into new durum and bread wheat cultivars, and near-isogenic lines (NILs) carrying NAM-B1 have been developed [21, 26, 27]. Furthermore, lines carrying a functional copy of NAM-B1 have shown higher yield potential compared to local checks across different environments, including dry areas [28]. This could be attributed to the early maturity and abiotic stress tolerance associated with NAM-B1 introgression.
Recent phylogenetic analysis of the NAC family in wheat identified several stress-responsive gene candidates, including two NAM-B1 homologous genes (NAM-A1 and NAM-D1) [29, 30]. The overexpression of TaSNAC8-6A (NAM-A1) in wheat plants has resulted in improved drought tolerance and enhanced water use efficiency, thus confirming its major role in stress tolerance [29]. Additionally, a natural allele called TaSNAC8-6AIn-313, which was found to be highly expressed under stress conditions, has been found to confer drought tolerance at the seedling stage in selected bread wheat genotypes [29]. These findings highlight the potential role of NAM-A1 and its homologous genes in conferring drought tolerance in wheat plants. This study aimed to investigate the role of NAM-B1, a homologous gene to the stress-responsive NAM-A1 gene, in conferring tolerance to water deficit stress at two reproductive stages by using NILs carrying the NAM-B1 allele. For this purpose, we evaluated the agronomic performance of the selected NILs and analyzed their physiological responses under water deficit stress conditions. The results obtained from this study would contribute to ongoing research efforts aimed at dissecting the role of NAM-B1 in enhancing drought tolerance in wheat and improving crop productivity in water-limited environments.
2. MATERIALS AND METHODS
2.1. Plant Material
In this study, three durum wheat NILs, namely, IR51-8 (PI 656794), IR17-47 (PI 656795), and 504 (PI 656796) were obtained from the U.S. Department of Agriculture - Agricultural Research Service (USDA-ARS) national small grains collection. The three lines were developed at UC Davis (CA, USA). They were selected from a cross between the durum wheat cultivar Langdon (LDN) and RSL65, a recombinant inbred chromosomal line of Langdon carrying the NAM-B1 gene, which was used in this study [21, 26]. The selected NILs carry a chromosome 6BS segment with a functional NAM-B1 gene from T. turgidum subsp. dicoccoides (accession FA15-3), while the rest of their genome resembles LDN. The durum wheat cultivar LDN (CItr 13165) was used as a control. It carries a nonfunctional NAM-B1 gene resulting from a 1 bp indel at the start of the gene, causing a frame-shift mutation and a non-functional allele [21].
2.2. Water Deficit Experiment
The water deficit stress experiment was conducted in the greenhouse facility at the School of Agriculture, The University of Jordan, starting from November 1st, 2019, until the plants reached physiological maturity (Zadoks scale: GS87) [30, 31]. Two seeds from each genotype were sown in a 6 L plastic pot filled with 5.5 kg of acid-washed sand. The pots were initially watered until they reached their “pot capacity,” estimated by adding 500 ml of distilled water to reach a pot weight of 6 kg. Subsequently, the pots were placed under greenhouse conditions to promote seed germination and were watered daily with the same amount of water until the emergence of one-leaf stage seedlings (Zadoks scale: GS11) [31]. At this stage, a thinning process was performed to leave one seedling in each pot, ensuring homogeneity with the remaining seedlings in the experiment. The pots were then irrigated with 1× Hoagland solution [32] to maintain the moisture content at “pot capacity” until the flag leaf emergence stage (Zadoks scale: GS37) [31], where the initiation of water deficit stress treatment started.
To assess the impact of water deficit stress on the four selected genotypes, water deficit treatments at two reproductive stages were imposed by allowing the pots to reach either 60% or 80% water depletion from their full “pot capacity” for intermediate and severe stress treatments, respectively. This was achieved by withholding the watering with 1× Hoagland solution and weighing the pots to achieve the targeted pot capacity for each stress treatment. At these levels, the pots were kept without irrigation for three days before irrigating them again to reach a pot capacity of 60% and 40% for the intermediate and severe stress treatments, respectively. This cycle was repeated and maintained until the plants reached the anthesis growth stage (Zadoks scale: GS69) [31]. At that point, the water deficit stress regime was replaced with a “watering every 4 days” regime until physiological maturity, with 300 ml and 150 ml of water added for the intermediate and severe stress treatments, respectively. As a control treatment, the remaining pots were irrigated with 500 ml of 1× Hoagland solution to reach full pot capacity and were kept well-watered until the end of the experiment. For each treatment, the physiological responses of the treated plants were monitored three days after the onset of stress treatments at the two different growth stages: at the heading stage (Zadoks scale: GS59) and anthesis (Zadoks scale: GS69) [31]. Furthermore, agronomic measurements were taken at the end of the experiment, when the plants reached the physiological maturity stage (Zadoks scale: GS87) [31].
2.3. Agronomic Traits
Agronomic data were recorded to evaluate the performance of the three selected NILs and LND under water deficit stress. These measurements included: duration of heading (HD), calculated as the number of days from seed emergence to the point when the plant in the pot produced a fully developed spike (Zadoks scale: GS59) [31]; duration of physiological maturity (MD) was recorded as the number of days from seed emergence to the day when the plant in each plot had reached the physiological maturity stage (Zadoks scale: GS87) [31]; the grain-filling period (GFP) was determined by subtracting MD from HD; plant height (PH in cm) measured from the plant base to the top of the spike excluding awns; tiller number (TN) as the final number of tillers counted from each plant in the pot; spike number (SN) as the final number of spikes counted from each plant in the pot; spike length (SL in cm) measured from the spike base to the top excluding awns; awns length (AL in cm) measured from the apical spikelet to the top of awns; spikelet number (SpN) as the final number of spikelets per spike estimated as an average of three selected main spikes in the pot; fertile florets (FFL) as the number of fertile florets/spikelets estimated as an average of three selected main spikes in the pot; total weight (TW in g) measured as the total weight of the whole above-ground material including grains that was harvested from each pot; spikes weight (SW in g) measured in g by weighing the harvested spikes from each plant; grain weight (GW in g) measured by weighing the grains (after threshing) from each plant in the pot; grain number (GN) measured as the total number of grains counted from all harvested spikes from each plant in the pot; grains/spike (GpS) as the number of fertile spikelets/spike calculated as grain number divided on spike number; and thousand kernel weight (TGW in g) was analyzed using the MARVIN seed analyzer machine (Marvin-GTA, Sensorik GmbH, Version 5.0) using threshed grains from each plant in the pot.
2.4. Physiological Measurements
During the experiment, the physiological responses of the treated plants were assessed under water deficit and well-watered conditions. These physiological measure- ments were recorded at specific time points corresponding to the two different growth stages mentioned earlier. To determine the relative water content (RWC) of treated plants, a 5 cm piece was excised from a fully expanded leaf at the three selected growth stages. Immediately after excising the leaf, the fresh weight (FW) was recorded. Subsequently, the excised leaf piece was gently dried on a paper towel to remove excess water, and the turgid weight (TW) was recorded. Finally, the leaf samples were dried for 24 hours at 50 °C, and their dry weight (DW) was recorded. The RWC was calculated using the following formula, based on Barrs and Weatherley [33]: RWC (%) = [(FW - DW) / (TW - DW)] × 100.
Stomatal resistance (s.m-1) was measured using a “steady-state” Porometer (AP4 model, Delta T devices, Cambridge, UK) attached to the abaxial side of the leaves at the two growth stages. Two readings per treatment were taken during midday (11:00 am-12:00 pm) on fully expanded leaves, and the average value was used for further analysis. Chlorophyll fluorescence (maximum yield of PSII (Fv/Fm)) was measured at the two growth stages with a pulse-modulated Fluorometer (OS1-FL modulated chlorophyll Fluorometer, ADC BioScientific Ltd., Hertford, UK). For relative measurement of chlorophyll content, a single-photon avalanche diode machine SPAD-250 (MC-100 Chlorophyll Meter, Apogee instruments, USA) was used to measure the chlorophyll content (SPAD index) using a fully expanded leaf with two readings, and the average value was used for further analysis.
2.5. Statistical Analysis
A split-plot design with four replications was used, where each replicate contained three subplots for well-watered, intermediate, and severe water deficit stress treatments, respectively. Each plot contained four genotypes randomly distributed in each subplot. Collected physiological and agronomical data were analyzed by using the GenStat program (Release 16.1, 2013; VSN International Ltd, UK). Analysis of variance (ANOVA) was performed for water deficit treatment and genotypes and their interactions, and the least significant difference test (LSD, p ≥ 0.05) was used for mean separation. Pearson’s correlation coefficients were calculated in R using the corrplot package as described previously [34]. The pheatmap package v1.0.8 in R (https://cran.r-project.org/ web/packages/pheatmap/index) was used to construct a heatmap and a hierarchical cluster using Euclidean distance and Ward.D2 method using the means of the tested genotypes.
3. RESULTS
3.1. Agronomic Data Analysis
The analysis of variance (ANOVA) indicated clear variation among water-deficit treatments for all agronomic traits, with the exception of SL (Table 1). Regarding the genotypic effect, significant variations were detected in 7 out of the 16 agronomic traits, specifically in MD, GFP, PH, TN, SN, FFL, and GpS. The interactive effect between genotype and treatment exhibited significant differences only in MD and GFP (Table 1). For the coefficient of variations (CV), the values varied for the agronomic traits where MD displayed the least variation, with a CV of 0.66%, and conversely, SN showed the highest variability with a CV of 14.43% (Table 1).
| Source of variation | DF | HD | MD | GFP | PH | SL | AL | TN | SN |
|---|---|---|---|---|---|---|---|---|---|
| Rep | 3 | 0.02 | 0.03 | 0.02 | 1.83 | 1.01 | 1.02 | 0.41 | 0.53 |
| Treatment | 2 | 21.94 ** | 431.58** | 264.15** | 312.15** | 5.14 | 35.51** | 203.40** | 175.69** |
| Error I | 6 | 1.35 | 1.36 | 2.98 | 6.56 | 0.11 | 0.85 | 0.70 | 1.13 |
| Genotype | 3 | 0.58 | 189.69** | 183.47** | 28.94* | 0.19 | 0.32 | 6.08** | 7.14** |
| Treatment × Genotype | 6 | 0.33 | 10.69** | 8.51* | 4.26 | 0.26 | 0.16 | 2.20 | 1.24 |
| Error II | 27 | 0.93 | 1.31 | 2.49 | 6.71 | 0.28 | 0.59 | 0.92 | 0.84 |
| Grand Mean | - | 140.06 | 177.04 | 36.98 | 127.83 | 9.27 | 9.81 | 7.77 | 7.38 |
| C.V. (%) | - | 0.83 | 0.66 | 4.67 | 2.00 | 3.52 | 9.41 | 10.78 | 14.43 |
| Source of variation | DF | SpN | FFL | GpS | GN | TW | SW | GW | TGW |
| Rep | 3 | 0.52 | 0.04 | 11.23 | 523.19 | 7.85 | 0.14 | 1.17 | 0.35 |
| Treatment | 2 | 16.01** | 2.01** | 757.14** | 236189** | 3816.38** | 690.38** | 387.01** | 49.34** |
| Error I | 6 | 0.93 | 0.07 | 7.08 | 513.82 | 5.09 | 1.42 | 1.84 | 0.57 |
| Genotype | 3 | 1.04 | 0.27** | 124.32** | 11.81 | 1.45 | 2.01 | 1.84 | 21.50 |
| Treatment × Genotype | 6 | 0.31 | 0.03 | 5.79 | 399.39 | 7.09 | 2.14 | 0.92 | 0.93 |
| Error II | 27 | 0.74 | 0.06 | 16.79 | 661.69 | 4.71 | 1.51 | 0.76 | 1.60 |
| Grand Mean | - | 22.87 | 2.36 | 31.78 | 235.07 | 30.82 | 12.94 | 9.44 | 39.71 |
| C.V. (%) | - | 4.21 | 11.28 | 8.37 | 9.64 | 7.32 | 9.21 | 14.36 | 1.91 |
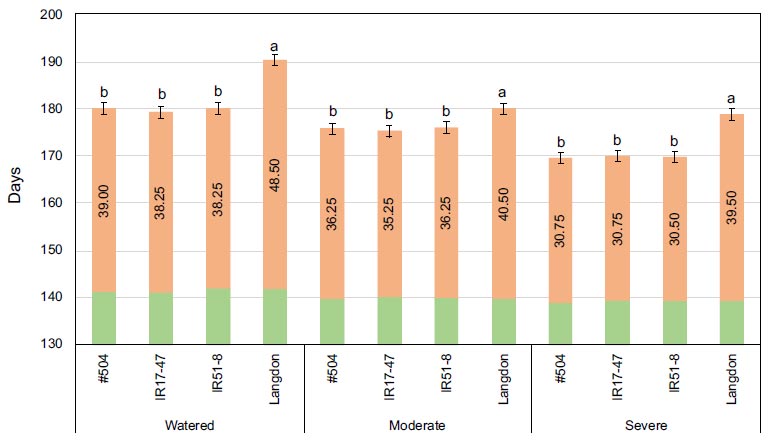
Mean values of heading date (in green), maturity dates (in orange), and grain filling period (numbers within columns) for three tested durum wheat NILs and LND grown under three different watering regimes. Bars represent LSD test values at p ≤ 0.05 to compare maturity date means (n=4) for the combined analysis and genotypes means across all treatments, while letters represent LSD test values at p ≤ 0.05 for specific comparison of maturity date means (n=4) of the tested genotypes within each specific stress treatment.
No significant differences were detected for HD among the tested genotypes under various stress conditions (Fig. 1). Conversely, significant differences were evident for MD and GFP among the tested genotypes under different stress conditions. As expected, the NILs exhibited a significantly faster maturation rate with shorter GFP compared to LND (Fig. 1). Water stress treatments accelerated maturity in all tested genotypes, with a clear, pronounced effect on the tested NILs, especially as stress intensity increased, while no significant differences were observed for LND.
The deleterious effects of severe water deficit treatment were prominently evident in 13 agronomic traits, with a significant reduction in various parameters, including PH, SL, AL, TN, SN, SpN, FFL, GpS, GN, TW, SW, GW, and TGW, when compared to well-watered treatment conditions (Table 2). For instance, under severe water deficit treatment, the mean value of TW significantly decreased to 17.74 g compared to 26.87 g under moderate stress and 47.86 g in the well-watered treatment. A similar trend was observed in TGW, where it decreased to 37.97 g under severe water deficit treatment compared to 39.68 g under moderate stress and 41.49 g in the well-watered treatment. Spike number (SN) also exhibited a significant decline, with a mean value of 11.19 spikes in the well-watered treatment compared to 5.19 spikes under severe water deficit conditions, showing no significant difference from the moderate water deficit treatment (5.75 spikes) (Table 2). The SW ranged from 19.96 g in the well-watered treatment to 6.94 g in the severe water deficit treatment, with significant differences between the three treatments. Similarly, GW varied from 14.59 g in the well-watered treatment to 4.80 g in the severe water deficit treatment. Additionally, GN demonstrated a substantial reduction with the well-watered treatment, yielding a mean value of 364.95, while only 124.19 grains were obtained under severe water deficit conditions (Table 2).
The genotypic effect analysis through ANOVA revealed significant differences in several agronomic traits, including PH, TN, SN, FFL, GpS, and TGW (Table 3). For instance, LND exhibited the highest mean values for both TGW (41.65 g) and GpS (36.56), which were significantly higher than the values observed in the three NILs carrying the NAM-B1 gene (Table 3). On the other hand, LND produced significantly the lowest SN mean value compared to NILs carrying the NAM-B1 gene. Furthermore, LND plants produced the lowest mean of PH at 125.67 cm when compared to the NIL plants (Table 3).
| Treatment | HD | PH | SL | AL | TN | SN | SpN |
|---|---|---|---|---|---|---|---|
| Watered | 141.37 a* | 132.06 a | 9.77 a | 11.15 a | 11.88 a | 11.19 a | 23.85 a |
| Moderate | 139.68 b | 128.19 b | 9.38 a | 10.08 a | 6.00 b | 5.75 b | 22.90 b |
| Severe | 139.12 b | 123.25 c | 8.65 b | 8.21 b | 5.44 b | 5.19 b | 21.85 c |
| Grand mean | 140.06 | 127.83 | 9.27 | 9.81 | 7.77 | 7.38 | 22.87 |
| LSD(0.05) | 1.01 | 2.22 | 0.28 | 0.80 | 0.72 | 0.92 | 0.83 |
| Treatment | FFL | GpS | GN | TW | SW | GW | TGW |
| Watered | 2.71 a | 32.82 a | 364.95 a | 47.86 a | 19.96 a | 14.59 a | 41.49 a |
| Moderate | 2.37 b | 38.08 b | 216.08 b | 26.87 b | 11.91 b | 8.95 b | 39.68 b |
| Severe | 2.00 c | 24.44 c | 124.19 c | 17.74 c | 6.94 c | 4.80 c | 37.97 c |
| Grand mean | 2.36 | 31.78 | 235.07 | 30.82 | 12.94 | 9.44 | 39.71 |
| LSD(0.05) | 0.23 | 2.30 | 19.61 | 1.95 | 1.03 | 1.17 | 0.66 |
| Genotype | PH | TN | SN | FFL | GpS | TGW |
|---|---|---|---|---|---|---|
| #504 | 129.00 a | 8.33 a | 7.83 a | 2.28 b | 30.24 b | 39.42 b |
| IR17-47 | 128.92 a | 7.83 a | 7.50 a | 2.28 b | 30.74 b | 38.57 b |
| IR51-8 | 127.75 ab | 8.17 a | 7.92 a | 2.31 b | 29.59 b | 39.23 b |
| Langdon | 125.67 b | 6.75 b | 6.25 b | 2.58 a | 36.56 a | 41.65 a |
| Grand Mean | 127.83 | 7.77 | 7.38 | 2.36 | 31.78 | 39.71 |
| LSD (0.05) | 2.17 | 0.80 | 0.77 | 0.21 | 3.43 | 1.06 |
3.2. Physiological Data Analysis
The ANOVA revealed significant differences among water-deficit treatments for all physiological traits, except for SPAD at the heading stage, emphasizing the impact of water stress conditions on the measured parameters (Table 4). For the genotypic effect, significant variations were identified in five physiological traits that included SPAD and Fv/Fm, both assessed at the heading and anthesis stages, along with stomatal resistance (SR) at the anthesis stage. The interactive effect between genotype and treatment demonstrated significant differences only for SR at the anthesis stage (Table 4). The coefficient of variation (CV) values ranged from 3.31% to 22.14%, with the highest value observed for SR at the heading stage, while the lowest was recorded for RWC at the heading stage.
Significant effects of water deficit treatment were observed on RWC and SR at both growth stages (Table 5), with stressed plants that displayed significant differences in their mean values compared to well-watered plants. For SPAD at the anthesis stage, no significant differences were observed between well-watered and moderate stress treatments, while the severe stress treatment produced significantly the highest mean value. The mean values of the maximum efficiency of photosystem II (Fv/Fm) at both growth stages were significantly higher in well-watered plants compared to those subjected to stress treatment.
| Source of variation | DF | RWC (H) | RWC (A) | SPAD (H) | SPAD (A) | Fv/Fm (H) | Fv/Fm (A) | SR (H) | SR (A) |
|---|---|---|---|---|---|---|---|---|---|
| Rep | 3 | 1.43 | 8.58 | 194.66 | 549.83 5.49e-04 2.11e-04 2.54 2.74 | ||||
| Treatment | 2 | 799.23** | 1429.45** | 1246.27 | 5102.21** 19.2e-03** 0.023** 985.21** 4431.84** | ||||
| Error I | 6 | 8.03 | 27.02 | 545.00 | 446.50 2.14e-04 9.13e-04 3.15 4.24 | ||||
| Genotype | 3 | 10.55 | 2.70 | 1693.21* | 8918.62** 1.48e-03** 2.61e-04** 1.86 66.24** | ||||
| Treatment × Genotype | 6 | 2.76 | 5.78 | 80.95 | 217.18 4.26e-04 1.31e-03 1.46 66.44** | ||||
| Error II | 27 | 9.82 | 7.98 | 378.25 | 379.97 2.95e-04 5.06e-04 1.89 6.10 | ||||
| Grand Mean | 85.55 | 6.39 | 422.68 | 403.07 | 0.59 | 0.60 | 8.02 | 15.05 | |
| C.V. (%) | 3.31 | 5.20 | 5.52 | 5.24 | 2.46 | 5.05 | 22.14 | 13.69 | |
Regarding the genotypic effect, SPAD mean values for NIL #504 were significantly higher than those of other tested genotypes at both growth stages (Table 6). For Fv/Fm, LND consistently produced the highest mean values at both growth stages compared to NILs carrying the NAM-B1 gene. On the other hand, LND produced the lowest mean value of SR at the anthesis stage, which was statistically significant when compared with the other tested genotypes (Table 6).
| Treatment | RWC (H) | RWC (A) | SPAD (A) | Fv/Fm (H) | Fv/Fm (A) | SR (H) | SR (A) |
|---|---|---|---|---|---|---|---|
| Watered | 93.53 a* | 91.38 a | 387.23 a | 0.63 a | 0.64 a | 1.43 a | 2.29 a |
| Moderate | 83.02 b | 80.01 b | 399.56 a | 0.59 b | 0.58 b | 5.93 b | 8.98 b |
| Severe | 80.09 c | 72.62 c | 422.42 b | 0.56 b | 0.57 b | 16.70 c | 33.88 c |
| Grand mean | 85.55 | 81.34 | 403.07 | 0.59 | 0.60 | 8.02 | 15.05 |
| LSD(0.05) | 2.45 | 4.5 | 18.28 | 0.01 | 0.02 | 1.54 | 1.78 |
H: Heading growth stage; A: Anthesis growth stage.
| Genotype | SPAD (H) | SPAD (A) | Fv/Fm (H) | Fv/Fm (A) | SR (A) |
|---|---|---|---|---|---|
| #504 | 440.38 a* | 443.71 a | 0.59 b | 0.60 b | 15.91 a |
| IR17-47 | 415.93 b | 393.72 b | 0.59 b | 0.59 b | 17.19 a |
| IR51-8 | 415.68 b | 388.21 b | 0.59 b | 0.59 b | 15.38 a |
| Langdon | 418.74 b | 386.64 b | 0.61 a | 0.62 a | 11.72 b |
| Overall Mean | 422.68 | 403.07 | 0.59 | 0.60 | 15.05 |
| LSD (0.05) | 16.29 | 16.33 | 0.01 | 0.03 | 2.07 |
H: Heading growth stage; A: Anthesis growth stage.
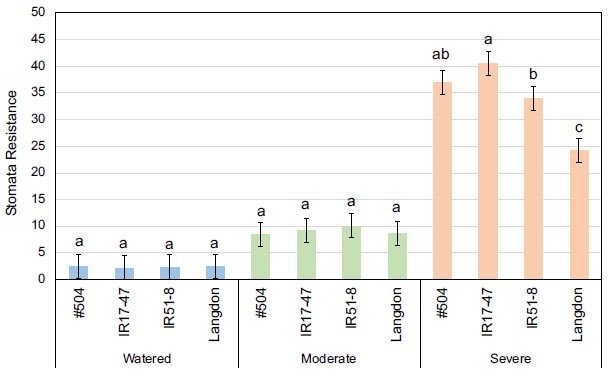
Mean values of stomata resistance at the anthesis stage for three tested durum wheat NILs and LND grown under three different watering regimes. Bars represent LSD test values at p ≤ 0.05 to compare stomata resistance means for the combined analysis and genotypes means (n=4) across all treatments, while letters represent LSD test values at p ≤ 0.05 for specific comparison of stomata resistance means (n=4) of the tested genotypes within each specific stress treatment.
Concerning the genotype × treatment interactive effect, only SR at the anthesis stage demonstrated statistical significance, with the mean values of the tested genotypes increasing with the severity of the stress treatment (Fig. 2). Notably, under severe stress conditions, NILs carrying NAM-B1 exhibited significantly higher mean values than LND, indicating a lower transpiration rate in the NILs.
3.3. Correlation and Heatmap Analysis
In general, significant positive correlations (p ≥ 0.05) were detected among the examined traits, with negative correlations primarily observed between the tested traits and SR (Fig. 3a). The MD exhibited a positive correlation with all parameters except PH, TN, SN, and SPAD at the heading stage. Furthermore, GW showed positive correlations with all traits, excluding G/S, SPAD, and SR. The heatmap cluster analysis showed three 303 distinct clusters aligned with the stress treatment levels, remarkably out-grouping LND within each cluster (Fig. 3b). From this perspective, higher estimated values for LND were obvious for MD, GFP, FFL, and TGW regardless of the stress treatment. Additionally, a clear increase in Fv/Fm values was observed only under severe stress treatment. Interestingly, NIL #504 exhibited higher estimated values for SPAD, showing a substantial increase with rising stress levels (Fig. 3b).
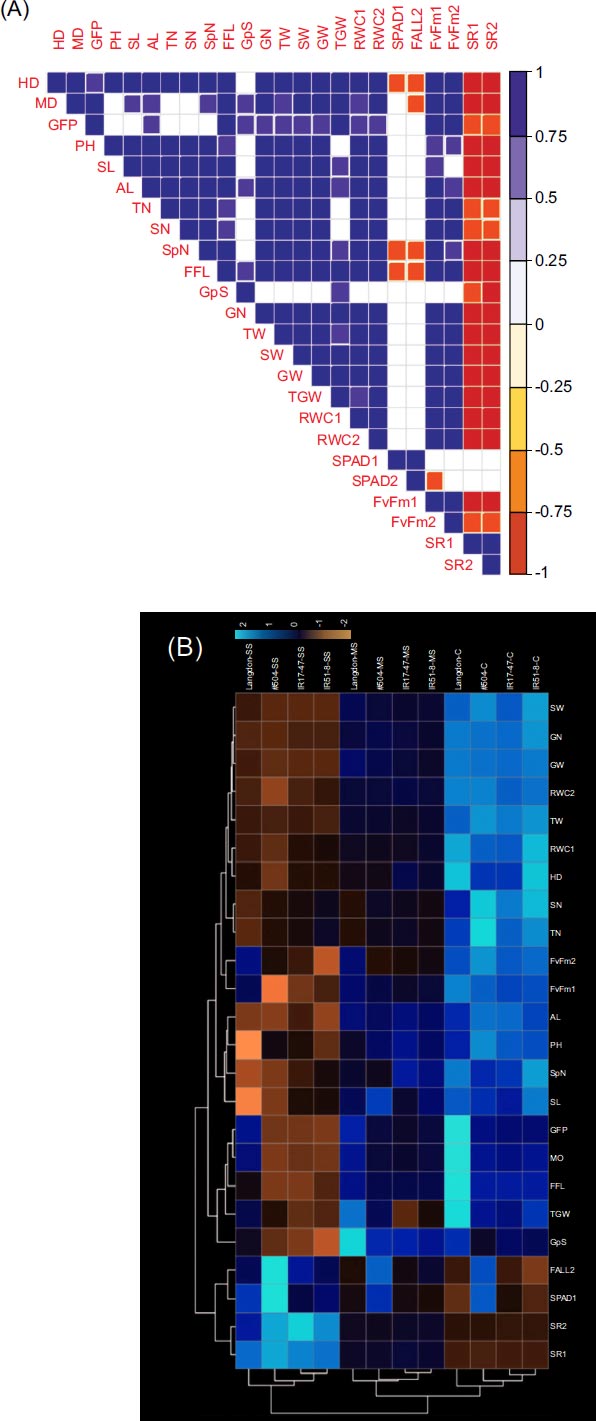
(a) Pearson's coefficients and pairwise correlations among traits in three tested durum wheat NILs and LND under three distinct watering regimes (blank squares denote non-significance at p ≤ 0.05 level); (b) Heatmap clustering based on the data from three tested durum wheat NILs and LND cultivated under three distinct watering regimes (C: well-watered; MS: moderate stress; SS: severe stress). The color intensity in each figure reflects the magnitude of the corresponding estimate.
4. DISCUSSION
In this study, we investigated the role of NAM-B1 in durum wheat in response to water deficit stress conditions at two reproductive stages. For this purpose, a selected set of durum wheat (Triticum turgidum spp. durum) NILs differing in the NAM-B1 gene was used. The check genotype (LND) was the only genotype that did not carry the NAM-B1 gene, while the other three lines carried chromosomal segments from Triticum turgidum ssp. dicoccoides with the NAM-B1 functional allele. NAM-B1 is a well-studied gene in wheat that encodes a transcription factor involved in accelerating senescence and enhancing protein, iron, and zinc content in grains [35]. Recently, it was found to act as a positive regulator of nutrient translocation from vegetative tissues to grains [36]. NAM-B1 gene plays diverse roles, including nutrition remobilization, enhancing grain protein content, altering grain micronutrient content, and accelerating monocarpic senescence in wheat [20, 37]. The NAM-B1 expression was detected predominantly in the flag leaf, declining at early booting and post-anthesis stages [38].
The study revealed significant differences in several agronomical and physiological traits in response to stress treatment, indicating clear negative effects of water deficit across genotypes (Table 1). Water deficit stress led to reductions in multiple traits, including GW, GN, TW, PH, and TN, which is consistent with previous findings [39]. These detrimental effects on wheat agronomical and physiological performance, particularly yield, are well-established [40]. Similar negative effects under stress conditions were observed in previous studies for various agronomic traits [41]. Leaf water potential, osmotic potential, and relative water content also exhibited significant reductions under drought stress [42]. Physiological traits like transpiration rate, chlorophyll content, and RWC were significantly reduced under post-anthesis drought stress in wheat [43]. In contrast, genotypic effects were less pronounced in this study, with few agronomical and physiological traits affected. Inconsistent responses to water deficit were observed in previous studies, highlighting the complexity of drought tolerance traits influenced by various genes and environmental interactions [40, 44].
The PH of genotypes varied significantly among water deficit treatments, with the genotypes exhibiting a reduction under severe water deficit, consistent with previous findings on the pronounced effect of drought stress on PH in durum wheat [39]. On the other hand, NILs carrying NAM-B1 showed variable responses, where #504 and IR17-47 showed significant differences when compared with LND, while IR51-8 showed no significant differences. In a previous study, the derivatives lines resulting from the introgression of the NAM-B1 gene in the wheat cultivar “HUW468” showed variable plant height mean values that ranged from 80-92 cm when compared to 85.7 cm of the parental line [45], which is in general agreement with our results. For SL, LND produced the lowest mean value under severe water deficit treatment, although not significantly different, compared to NILs carrying NAM-B1. The agronomic performance of BC2F3 families carrying the NAM-B1 gene identified a single line (HUW468-09-6) from several families with significantly higher spike length mean values when compared to the recurrent parent HUW468 [45].
For TN and SN, a clear significant reduction under water deficit conditions was observed, with LND showing significantly lower mean values than NILs carrying NAM-B1. The SN per plant in lines carrying the functional NAM-B1 allele exhibited an average increase of 4.5 spikes per plant when compared with LND plants [45, 46]. Kumar et al. [28] showed that genotypes carrying NAM-B1 did not differ significantly in TN, while the introgression of the functional allele of NAM-B1 increased SN when compared with the check cultivar under field conditions [20]. It is well established that the NAM-B1 gene is highly expressed only after the anthesis stage [35]. Therefore, it is unexpected to see an effect of the NAM-B1 gene on SN and TN, as these traits are usually determined before anthesis [47]. However, the positive impact of the NAM-B1 gene on SN and TN and other traits needs further investigation to confirm the allelic effect in introgressed lines.
The total weight of all tested genotypes was affected by water deficit treatment, with no clear significant differences between the tested genotypes (Table 2). Drought is known to decrease dry weight in durum wheat lines [48]. Deckard et al. [49] studied the responses of Langdon [LDN(DIC)] (carrying NAM-B1) to N-uptake under field conditions and found that higher accumulation ratios (N-uptake to TW) were a result of a lower TW in substitution lines when compared with LND, which was not observed under greenhouse conditions in this study. The GW and GN showed no significant differences between genotypes under different treatments but were reduced under water deficit conditions. Positive correlations observed between GW and several traits align well with earlier studies [50]. For GN, Kaznina et al. [24] studied the effect of Zn deficiency on GN and GW in wheat lines carrying different allelic variants of the NAM-B1 gene, and they found a significant increase in GN and GW only under Zn stress when compared to the control. Under water deficit stress, senescence can be accelerated, leading to increased nutrient remobilization and higher GPC and micronutrient concentrations in grains [37].
Grain per spike results indicated that LND produced the highest mean values under well-watered and severe water deficit conditions (Table 2). For TGW, a significant reduction in NILs carrying NAM-B1 was observed, consistent with previous reports [28, 51]. On the other hand, Eagles et al. [51] showed that NIL-carrying NAM-B1 had a negligible effect on grain yield when compared with their recurrent parents in field trials under Australian environments. They suggested crossing newly commercial cultivars, which are introgressed with NAM-B1, with large grain size genotypes with targeted selection for grain weight.
Physiological parameters were negatively affected by water deficit treatment. For instance, SR significantly increased in response to water deficit conditions, consistent with previous findings [52]. Chlorophyll fluorescence (Fv/Fm) differences between water treatments at different growth stages reflect the complex response of the tested genotypes [53]. Water deficits led to a significant increase in SR, supporting the notion that genotypes carrying the NAM-B1 gene play a role in accelerating senescence, particularly under severe water deficits [25]. At the anthesis stage, NIL #504 showed significantly higher mean values of SPAD when compared with other tested genotypes. Akhkha et al. [54] studied the effect of water deficit on chlorophyll content in tested durum wheat cultivars, and they observed a reduction in chlorophyll content in all tested cultivars under drought conditions. A recurrent study of BC2 NILs carrying a major QTL for TGW on 6A for two growing seasons showed no significant differences in relative chlorophyll content after 20–25 days of anthesis, and significant differences were detected after 45 days of anthesis [55]. Botyanszka et al. [53] reported that the mean values of chlorophyll contents in drought-tolerance genotypes of barley were significantly higher than those in drought-sensitive genotypes under water deficit. On the other hand, genotypes that carry the functional NAM-B1 gene are known to play a major role in accelerating senescence [23], which was observed in this study and, in particular, in response to severe water deficit treatment. This could be attributed to the growth stages selected in this study, where water deficit was imposed and continued till the later stages of wheat development.
In this study, the majority of the studied traits were not affected by the treatment × genotype interactions, and this might be related to the complexity of the drought tolerance trait, which is described as a quantitative trait controlled by many genes with their expression influenced by different environmental and genetic interactions [56]. The lack of significance for the interactive effect might be explained by the masked impact of a single QTL selected in this study in the NIL background. Furthermore, this may highlight the necessity for further investigations into the role of NAM-B1 under different growth stages and environmental conditions. Another possibility might be related to the inducible expression of NAM-B1 in response to drought or to the growth stage. The expression of NAM-A1, the NAM-B1 closest homolog in wheat, was found to be negatively affected by heat at senescence, while no significant effect of drought stress on NAM-A1 expression was observed [30]. This is also supported by the findings of Kaul et al. [57], who found that the expression of NAM-B1 was negligibly at the seedling and vegetative stages and was highly expressed at the senescence stage. Recently, a stress-inducible allele of NAM-A1 (TaSNAC8-6A) was identified, which was induced in response to stresses at the seedling stage [29]. A three-bp indel in the promoter region resulted in a stress-responsive cis-regulatory element in the NAM-A1 promoter that induced drought tolerance in selected genotypes. In this study, the size of introgression in selected NILs varied, and this could explain the observed variations among them in terms of different traits. Future studies are needed to fine-map minor QTLs associated with responses against drought in tested NILs or to dissect the role of NAM-B1 under stress at different growth stages.
CONCLUSION
This study investigated the combined effects of genotype and water deficit stress in two reproductive stages on agronomic and physiological traits in three NILs carrying the NAM-B1 gene compared to their recurrent parent (LND) in durum wheat. Our findings revealed significant variations in both agronomic and physiological traits in response to water stress treatment or genotype. The genotypic effect was pronounced in seven agronomic traits, including MD, GFP, PH, TN, SN, FFL, and GpS, with NILs carrying the NAM-B1 gene exhibiting, as expected, a faster maturation rate and shorter GFP compared to LDN. Severe water deficit significantly reduced various agronomic parameters, such as TW, SW, GW, and TGW, emphasizing the detrimental effects of severe stress conditions on reproductive stages in durum wheat plants. Further, physiological traits, in particular SR and Fv/Fm, displayed significant variations among genotypes and stress treatments, with NILs exhibiting clear differences for SR at the anthesis stage under severe stress conditions compared to LND. Nonetheless, this study highlights the need for further research to elucidate the underlying genetic mechanisms mediated by NAM genes in response to stress conditions across different growth stages.
LIST OF ABBREVIATIONS
| RWC | = Relative Water Content |
| DW | = Dry Weight |
| TW | = Turgid Weight |
| FW | = Fresh Weight |
| ROS | = Reactive Oxygen Species |

