All published articles of this journal are available on ScienceDirect.

Environmental Efficiency of Monsoon Rice (Oryza sativa) Production between Transplanting and Broadcasting Sowing Methods in Myanmar
Abstract
Introduction
Myanmar relies on rice for its food security and economic significance, ranking seventh in the world for rice exports as of 2021. The most significant concern in rice production is exceeding the recommended nitrogen (N) fertilizer usage rate. Nitrogen is a crucial fertilizer for rice production, but it poses negative environmental consequences, such as nitrous oxide emissions. Therefore, this study intended to assess the technical (TE) and environmental efficiency (EE) of monsoon rice production in Myanmar and compare the efficiencies of broadcasting (BC) and transplanting (TP) sowing methods.
Methods
A translog stochastic frontier production function approach estimated the output-oriented technical efficiency and environmental efficiency of monsoon rice production. The study conducted face-to-face interviews with 317 farmers in Nay Pyi Taw Union Territory, Myanmar.
Results
The overall mean TE and EE were 81% and 23%, respectively. The average TE and EE for N fertilizer were 84% and 35% using the TP method and 80% and 20% using the BC method, respectively.
Conclusion
Our findings confirmed that the TP method was technically and environmentally superior to the BC method. The adoption of the TP method should be promoted by highlighting its positive impacts on achieving sustainable monsoon rice production in Myanmar.
1. INTRODUCTION
Rice is a crucial crop for food security and economic importance in Myanmar. It ranked seventh among the world’s top 10 rice-exporting countries in 2021 [1] since approximately 35% of the total cultivated land was dedicated to rice farming. Rice is sown in two seasons: the summer and monsoon seasons. Monsoon rice was the major cultivated crop in 90% of the country [2]. Myanmar has been involved in the Green Revolution [initially used for wheat and rice production] to increase rice production since 1973 using a high-yielding variety of seeds and chemical fertilizers. The government of Myanmar has set a target to enhance its rice sector development by increasing rice exports to a minimum of six million metric tons in the period of 2029-2030, as stated by the Ministry of Agriculture, Livestock and Irrigation in 2015 [3]. This results increased pressure on land, water, forest, and marine resources and greenhouse gas emissions.
Chemical fertilizer use in Myanmar was still lower than in neighboring countries [4]; however, nitrogen (N) fertilizer use was higher than the recommended rate [5]. According to datasets on food and agriculture statistics by the Food and Agriculture Organization (FAO), there has been an upward trend in the utilization of chemical fertilizers since 2016. However, this trend saw a decline in 2021 (FAOSTAT, 2021). This drop can be attributed to a significant rise in fertilizer costs, which escalated by 125% from January 2021 to January 2022 [6]. Nonetheless, with the higher price of fertilizer, the stable demand for its application remained the same because the farmers in Myanmar were concerned about lower yields [7].
Nitrogen is a crucial fertilizer for agricultural production while concurrently posing negative environmental consequences [8]. The application of nitrogen fertilizer in rice fields emits nitrous oxide gas, a critical and potent greenhouse gas (GHG) with 265 times its global warming potential, which is higher than that of carbon dioxide [9], and its GHG emissions are found to be the highest among the agricultural inputs [10, 11]. As the government strategy leads to increasing rice productivity, the higher application of fertilizers has detrimental effects on the environment. It is crucial to assess whether the rice production sector works in sustainable development ways. Improving or stabilizing rice productivity through increased efficiency to utilize environmentally detrimental input is a way to lead sustainable rice production as an important source of food security and export income for Myanmar. To reduce the utilization of nitrogen fertilizer without affecting rice yield, it is necessary to estimate the technical and environmental efficiency with environmentally detrimental input.
Most research related to technical and economic efficiencies has already been carried out in rice production, especially in the Delta region, a major rice bowl in Myanmar [12-15], as well as in agricultural production efficiency considering the environmental factors [16, 17]. However, there has been no study about the environmental efficiency to minimize the negative externalities by sustaining or increasing rice yield in Myanmar. Thus, this present study can fill this research gap in Myanmar. Environmental efficiency (EE) is the estimation of the efficiency at the farm level, considering the detrimental effects of environmental factors on production function. This study followed the method of Reinhard et al. (1999) to determine the environmental efficiency [18]. The first step is to estimate technical efficiency (TE) with an output-oriented approach, and the second step is to estimate EE from a non-radial input-oriented approach to minimize the amount of environmentally detrimental input without affecting yield [18]. Reinhard et al. (2000) analyzed the advantages and disadvantages between stochastic frontier analysis (SFA), an econometric approach, and data envelopment analysis (DEA), mathematical programming, in computing the environmental efficiency index. SFA can describe a random error term but not impose monotonicity and curvature restrictions. DEA does not contain a random error term but satisfies the restrictions [19]. Other studies followed the same approach to estimate the environmental efficiency for minimizing the environmental detrimental inputs in rice production in China [20], Indonesia [21], Vietnam [22-24], Thailand [25], and Pakistan [26]. Therefore, this study aimed to contribute to the literature for Myanmar by calculating the environmental efficiency of nitrogen fertilizer usage, which is considered the most significant environmentally detrimental input.
The two most popular methods practiced by farmers for sowing rice in Myanmar are broadcasting (BC) and transplanting (TP) methods, representing 48% and 33% of the total cultivated area of monsoon rice production [27]. TP method increased technical efficiency [28] due to the lower requirements of seeds and weed population because of uniform spacing and higher productivity and due to the limited competition between rice crops for nutrients and space [29, 30] compared to the BC sowing method. However, adopting the TP method was still lower than the BC method because of the higher labor demand [30]. This study will answer whether the TP or BC sowing method can bring economic and environmental benefits to farmers. Therefore, this study aimed to analyze the technical and environmental efficiency of monsoon rice production in Myanmar and compare the efficiencies between TP and BC sowing methods.
2. MATERIALS AND METHODS
2.1. Description of the Study Area and Data Collection
Nay Pyi Taw Union Territory, the administrative capital of Myanmar, was chosen as the research area because previous studies have described that utilization of nitrogen fertilizer was higher than the recommended rate [31, 32]. The Land Use Division of the Ministry of Agriculture, Livestock, and Irrigation sets guidelines for nitrogen fertilizer application rates of 102, 90, and 57 kilograms of nitrogen per hectare (Kg N ha-1) for soils with low, medium, and high fertility, respectively. Also, being the capital of the nation, agricultural policies and initiatives aimed at improving the environmental efficiency of rice production can be tested and implemented in this region. Yezin Agricultural University, situated in Nay Pyi Taw and the only agricultural university in Myanmar, is one of the focal points of Climate Smart Agriculture Training Centers for Myanmar farmers [33]. The research findings in this area could be applied to farms with low-carbon management practices for sustainable rice production by maintaining a harmonious balance with the environment. The data collection process was conducted in Tatkon and Lewe Townships, which are the major rice production areas, as well as Zeyarthiri and Zabuthiri Townships, which engage in various agricultural practices (Fig. 1).
Detailed information on rice production was collected from a randomly selected group of 400 farmers who willingly participated in interviews and completed structured questionnaires from January to May 2022. In the present analysis, a total of 317 farmers were included, excluding 83 farmers who did not engage in rice cultivation using the BC and TP sowing methods. In the BC sowing method, the pre-germinated seeds (24 hours (h) soaked and 24 h incubated) were sown onto wet, puddled soils. In the TP sowing method, 14–45 days seedlings were transplanted with 3–5 seedlings hill-1 in wet puddled soils. The questionnaire included input and output quantities in monsoon rice production.
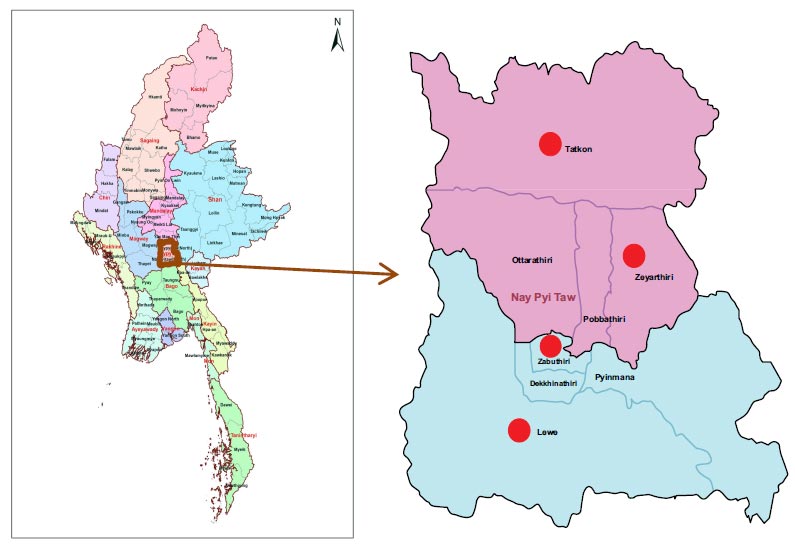
Map of the study area [34].
This study assumed that nitrogen fertilizer, measured kg N ha-1 was an input in the production function with negative environmental consequences. Approximately 30.91% of the sample farmers were applying lower than 57 kg N ha-1; 42.59% of the farmers were applying between 57 to 90 kg N ha-1; 5.68% of the farmers were applying between 91 to 102 kg N ha-1; and 20.82% of the farmers were applying more than 102 kg N ha-1. The average amount of nitrogen fertilizer used was 81.00 and 78.63 kg N ha-1 in the TP and BC methods, respectively. The conventional inputs were seeds in kilograms per hectare (kg ha-1), total machinery used for land preparation and harvest in hours per hectare (h ha-1), and total family and hired labor working for land preparation and harvest in hours per hectare (h ha-1). The detailed characteristics of the output and inputs between the TP and BC methods are described in Table 1. Except the seed rate, the other inputs used in the TP method were higher than in the BC method. As an output, the TP method was higher than the BC method.
| Indicator | Unit | Transplanting (N=66) | Broadcasting (N=251) | ||
|---|---|---|---|---|---|
| Mean | Standard Deviation | Mean | Standard Deviation | ||
| Output (Y) | kg ha-1 | 4,872.06 | 738.89 | 4,617.55 | 778.67 |
| Conventional inputs | |||||
| Seed (X1) | kg ha-1 | 40.78 | 15.25 | 87.01 | 28.99 |
| Machinery (X2) | h ha-1 | 27.59 | 17.41 | 12.57 | 6.88 |
| Labor (X3) | h ha-1 | 292.33 | 104.11 | 117.98 | 117.69 |
| Environmentally detrimental input | |||||
| Nitrogen (Z1) | kg N ha-1 | 81.05 | 38.41 | 78.63 | 42.12 |
Source: Field Survey (2022).
2.2. Conceptual and Theoretical Framework of the Study
As nitrogen fertilizer is the major environmentally detrimental input for environmental pollution in Myanmar, this study followed the method of Reinhard et al. (2000) to find the environmental efficiency with one environmentally detrimental input. The initial definition of environmental efficiency is the ratio of minimum attainable environmental detrimental input use to actual use, given the actual output level and other inputs of the existing technology. This study was a cross-sectional study based on rice farmers, so there would be random errors, such as the weather and other uncontrolled incidents. It accounted for one environmental detrimental input in the SFA model with a translog production function, which is more flexible than the Cobb-Douglas production. One output (rice yield) and two inputs (conventional inputs and environmental detrimental input) were applied to estimate the output-oriented technical efficiency and input-oriented environmental efficiency of nitrogen fertilizer.
The production frontier function depicted in Fig. (2) illustrates the relationship between conventional input X and environmentally detrimental input Z while maintaining a constant output rate YR. YRYR is the unit isoquant of fully efficient firms. If a firm uses input quantities at point ‘R’ for producing a unit of output, technical inefficiency is illustrated by the distance BR. This represents the extent to which all inputs could be proportionally decreased without causing a decrease in output. Or we can reduce to ‘CR’ and also ‘AR’. Based on the definition of EE, |0ZF|/|0ZR| represents the minimum feasible environmentally detrimental input, which is conditional in terms of output YR and observed conventional inputs XR.
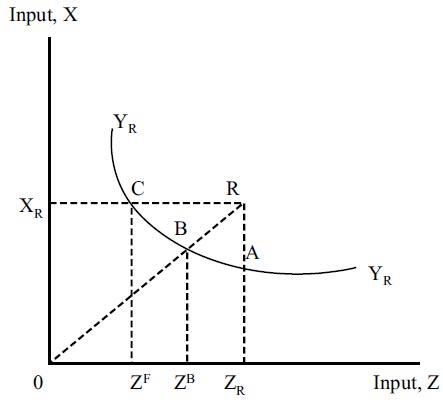
Production frontier function of conventional input X and environmentally detrimental input Z [19].
A general stochastic production frontier is defined by Yi = f (Xij, Zi, β) exp (Vi – Ui). In this function, Yi was the output of the ith farm, Xij was a vector of conventional inputs, Zi was a vector of environmental detrimental input, β was a parameter vector to be estimated, Vi was a random error term that was distributed identically and independently as N (0, σu2), and Ui was an inefficiency component or non-random error term which captures the technical inefficiency in production. The stochastic version of the output-oriented technical efficiency was expressed as follows.
 (1)
(1)
To estimate the environmental efficiency, the frontier function is EE = min (min {θ: f(X, Z) ≥ Y) ≤ 1. The translog form of this function (Ln EE) and the environmental efficiency index (EE) with N fertilizer were measured as follows.
 (2)
(2)
 (3)
(3)
2.3. Analytical Framework
The fitness of the frontier model was tested by the use of the generalized Likelihood Ratio (LR) test, LR = -2ln(L(H0)/L(H1), where L(H0) was the value of the likelihood function for the restricted model (Ordinary Least Square), and L(H1) was the value of the likelihood function for the unrestricted model (Stochastic Frontier). The test statistics LR was done under a chi-square distribution where a degree of freedom was equal to the number of parameters, which was assumed to be zero in the null hypothesis. To avoid the excessive misspeci- fication of the model, a stochastic translog production function was used for estimating the output-oriented technical efficiency as follows,
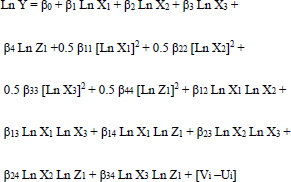 (4)
(4)
where Ln = the natural logarithm, Y = the yield of rice (kg ha-1), X1 = amount of seed (kg ha-1), X2 = operation hour by machines (h ha-1), X3 = operation hour by labor (h ha-1), Z1 = nutrients of nitrogen fertilizer (kg N ha-1), Vi = random error term (e.g., uncertainty of nature and weather), and Ui = an inefficiency component.
As the coefficients of the translog model do not have the elasticity like a Cobb-Douglas production function, it is necessary to calculate the output elasticity by taking the derivative of Eq. (4) concerning the logarithm of the relative inputs: ∂LnY/∂LnXi = βi + βi1 Ln X1+ βi2 Ln X2+ βi3 Ln X3+ βi4 Ln Z1. If the estimated parameters, βi1, βi2, βi3, and βi4, are equal to zero, the output elasticity of the translog function is the same as the output elasticity of the Cobb-Douglas function.
To estimate the environmental efficiency of rice crops, only one environmentally detrimental input, nitrogen, was considered as an environmentally detrimental input. Nitrogren fertilizer was the major GHG emitter among the inputs used in monsoon rice production in the study area [35]. Concerning nitrogen fertilizer, the above equation Z1 was changed to θZ1 by assuming that the technical inefficiency of farmers approaches zero (Ui = 0) where θZ1 showed the efficient level use of N inputs as mentioned in Eq. (5).
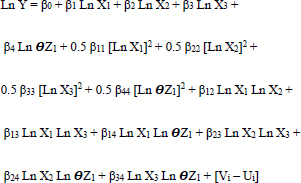 (5)
(5)
To estimate the environmental efficiency with nitrogen fertilizer (Ln EE = Ln θZ1 – Ln Z1), Eq. (4) was subtracted from Eq. (5), and the result was
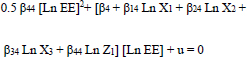 (6)
(6)
As the result of Eq. (6) is in quadratic equation form, the environmental efficiency is as follows,
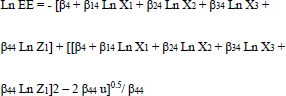 (7)
(7)
Descriptive and inferential statistics were employed to analyze the data. The frequencies and proportions were calculated to summarize the categorical variables. The statistical and significant differences to determine the environmentally efficient sowing method were calculated using a T-test.
3. RESULTS AND DISCUSSION
Likelihood ratio (LR) test was used in this study to analyze the three specifications of the model: stochastic inefficiency effect, functional form of the production function, and influence of inefficiency factors. Firstly, the null hypothesis implied that the ordinary least squares method fits the model (the model has no one-sided error). As the LR value of “52.94” is higher than the critical χ2 value of “5.41”, it indicates that the stochastic frontier analysis fits the model. Secondly, the null hypothesis implied that the Cobb-Douglas functional form should be used for the efficiency analysis compared to the translog production function. As the LR value of “30.13” is higher than the critical χ2 value of “20.97”, it indicates that the translog functional form adequately fits the data from the monsoon rice production (Table 2). According to the result of a highly significant value of λ “305.64”, the null hypothesis of the inefficiency absence was rejected at a 99% confidence interval, and it means that there was technical inefficiency in the model of this study (Table 3).
| Null Hypothesis | χ2 0.99 Statistic | Likelihood Ratio | Decision |
|---|---|---|---|
| No Stochastic Inefficiency Effect | |||
| σu2 = 0 | 5.41 | 52.94 | Reject H0 |
| Cobb Douglas Functional Form | |||
| β11 = β22 = β33 = β44 = β12 = β13 = β14 = β23 = β24 = β34 = 0 | 20.97 | 30.13 | Reject H0 |
Notes: Test statistics follow a mixed χ2 distribution for hypothesis testing [36].
Table 3 describes the results of maximum likelihood estimation, including four inputs used in the monsoon rice production. The coefficient of seed was positive, but the quadratic term of seed was negative and statistically significant at a 1% level. This means that a higher amount of seed increases the rice yield to a certain level. However, if the amount of seed was used at more than that rate, the yield would be decreased. The result conforms to the findings of Oumer et al. (2022), who analyzed the translog production frontier of maize production in Ethiopia [37]. The combination of the positive and negative seed-squared coefficients suggests a concave-shaped production function. Initially, increasing the amount of seed leads to a significant increase in output, but the additional output gained per unit of seed decreases as the quantity of seed becomes excessive. The result of the concave relationship between seed and rice yield is contrary to the findings of Azumah et al. in Northern Ghana for rice farmers [38], and Khatri-Chhetri et al. [39], who found the convex relationship between seed and rice yield of the rice farmers in India. The highest seeding rate causes intraspecific competition, and it can decrease rice yield [40]. The estimated value of labor with a positive effect and statistical significance at a 1% level implied that an increase in working hours could enhance the rice yield. The results are similar to previous studies [17, 41] yet contradictory to a few of them [39]. The coefficient of nitrogen fertilizer was found positive and statistically significant at a 5% level, implying that increased use of nitrogen fertilizer could enhance the rice yield.
| Parameters | Coefficient | Std. Error | T-statistics | P-value |
|---|---|---|---|---|
| lnSeed | 1.594*** | 0.488 | 3.27 | 0.001 |
| lnMachinery | -0.047 | 0.192 | -0.25 | 0.806 |
| lnLabor | 0.709*** | 0.257 | 2.76 | 0.006 |
| lnNitrogen | 0.744** | 0.310 | 2.40 | 0.016 |
| lnSeed2 | -0.138** | 0.067 | -2.05 | 0.041 |
| lnMachinery2 | 0.063 | 0.046 | 1.38 | 0.168 |
| lnLabor2 | 0.000 | 0.028 | 0.01 | 0.993 |
| lnNitrogen2 | -0.026 | 0.035 | -0.76 | 0.447 |
| lnSeed* lnMachinery | 0.004 | 0.036 | 0.10 | 0.921 |
| lnSeed* lnLabor | -0.112*** | 0.032 | -3.53 | 0.000 |
| lnSeed* lnNitrogen | -0.095*** | 0.034 | -2.80 | 0.005 |
| lnMachinery* lnLabor | -0.023 | 0.020 | -1.14 | 0.254 |
| lnMachinery*lnNitrogen | 0.000 | 0.034 | 0.01 | 0.992 |
| lnLabor* lnNitrogen | -0.036 | 0.020 | -1.82 | 0.069 |
| Constant | 1.666 | 1.960 | 0.85 | 0.395 |
| λ (lambda) | 10.1010*** | 0.0329 | 305.64 | 0.000 |
| Wald χ2 value | 47.57 | |||
| Log Likelihood | 154.82 | |||
| No. of observation | 317 | |||
Notes: ** and *** represent 5% and 1% level of significance, respectively.
Source: Field Survey (2022).
The coefficients of seed interaction with labor and nitrogen fertilizer are significantly negative at a 1% level, which implies substitute relationships between seed and labor and nitrogen fertilizer. This finding is contrary to the findings of Khatr Chhetri et al. [39]. The reason is that about 79% and 21% of sample farmers in this study practiced broadcasting and transplanting sowing techniques, respectively. The sample farmers who practiced the transplanting sowing technique used less amounts of seed, more labor, and achieved higher rice productivity.
Based on the production results (Table 3), the elasticity values of output concerning four inputs were estimated. Summary statistics are depicted in Table 4. All positive mean values of elasticity stated a positive relationship between output and input factors, and it suggests that there was no excessive use of inputs in the monsoon rice production. Nitrogen fertilizer application had the highest average elasticity, followed by seed, labor, and machinery. Mean values of elasticity of seed, machinery, labor, and nitrogen fertilizer were 0.04, 0.02, 0.03, and 0.05, implying that the individual increases of the inputs by 1% would lead to improvements in rice production by about 0.04%, 0.02%, 0.03%, and 0.05%, respectively. The sum of the elasticity of all input factors was 0.14, which represents decreasing returns to scale. The results are similar to the decreasing returns to scale of rice production in the study of environmental efficiency analysis in Pakistan [26] and Vietnam [22]. Under decreasing returns to scale, the farmers could not achieve the equivalent increase in output with the proportionate increase in the input. However, decreasing returns to scale means that the farms still have the opportunity to increase their production portfolios before reaching their full output potential by reducing their production costs without affecting much production [42].
The frequency distribution, summary statistics, and inferential statistics of the output-oriented technical efficiency for rice farmers are shown in Table 5. The overall mean technical efficiency was 0.81, ranging from 0.44 to 0.99. The mean level of technical efficiency in Nay Pyi Taw, Union Territory of Myanmar, was lower compared to the studies of rice production in Pathein and Myaung Mya Districts (TE = 0.88) [17] and in Hinthada District (TE = 0.90) in Ayeyarwaddy Delta region, known as the rice bowl of Myanmar. Thus, rice farmers in Nay Pyi Taw could improve the existing technical efficiency of the sample farmers at the same level of input use.
The average output-oriented technical efficiency in monsoon rice production using the TP and BC methods was found to be 84% and 80%, respectively. The results of this study suggest that the adoption of the TP method has the capacity to improve rice yields by approximately 16%. Similarly, the implementation of the BC method has the potential to lead to a yield increase of around 20% under specified input conditions. The results prove that rice farmers implementing the TP method had higher levels of technical efficiency compared to those applying the BC method. This difference in efficiency was found to be statistically significant at a 5% level. This finding aligns with the research conducted by Kara et al. (2019), wherein it was observed that farmers utilizing the TP method significantly increased their technical efficiency in rice production in Pakistan [28]. This study also found that the higher outputs and lower seed utilization in the TP method would create an opportunity to increase technical efficiency despite higher requirements of the labor and machinery for the transplanting procedure. According to the application of nitrogen fertilizer, the amounts are not apparently different from each other.
| Variables | Elasticity at Mean | Minimum | Maximum | Standard Deviation |
|---|---|---|---|---|
| Conventional Inputs | ||||
| Seed (X1) | 0.04 | -0.24 | 0.31 | 0.09 |
| Machinery (X2) | 0.02 | -0.08 | 0.13 | 0.03 |
| Labor (X3) | 0.03 | -0.08 | 0.18 | 0.05 |
| Environmentally Detrimental Input | ||||
| N fertilizer (Z4) | 0.05 | -0.06 | 0.15 | 0.04 |
Source: Field Survey (2022).
| TE Levels | Overall (N=317) | TP (N=66) | BC (N=251) | |||
|---|---|---|---|---|---|---|
| Frequency | Percent | Frequency | Percent | Frequency | Percent | |
| < 0.50 | 6 | 1.89 | 0 | 0.00 | 6 | 2.39 |
| 0.50–0.59 | 14 | 4.42 | 2 | 3.03 | 12 | 4.78 |
| 0.60–0.69 | 38 | 11.99 | 4 | 6.06 | 34 | 13.55 |
| 0.70–0.79 | 86 | 27.13 | 18 | 27.27 | 68 | 27.09 |
| 0.80–0.89 | 81 | 25.55 | 21 | 31.82 | 60 | 23.90 |
| 0.90–0.99 | 92 | 29.02 | 21 | 31.82 | 71 | 28.29 |
| Mean TE | 0.81 | 0.84 | 0.80 | |||
| Minimum | 0.44 | 0.56 | 0.44 | |||
| Maximum | 0.99 | 0.99 | 0.99 | |||
| Standard deviation | 0.12 | 0.11 | 0.13 | |||
| T-value | - | 2.23** | ||||
Notes: ** represents a 5% level of significance. Source: Field Survey (2022).
| EE Levels | Overall (N=317) | TP (N=66) | BC (N=251) | |||
|---|---|---|---|---|---|---|
| Frequency | Percent | Frequency | Percent | Frequency | Percent | |
| 0.00 – 0.09 | 106 | 33.44 | 8 | 12.12 | 98 | 39.04 |
| 0.10 – 0.19 | 72 | 22.71 | 11 | 16.67 | 61 | 24.30 |
| 0.20 – 0.29 | 48 | 15.14 | 13 | 19.70 | 35 | 13.94 |
| 0.30 – 0.39 | 32 | 10.09 | 11 | 16.67 | 21 | 8.37 |
| 0.40 – 0.49 | 18 | 5.68 | 7 | 10.61 | 11 | 4.38 |
| 0.50 – 0.59 | 13 | 4.10 | 6 | 9.09 | 7 | 2.79 |
| 0.60 – 0.69 | 10 | 3.15 | 1 | 1.52 | 9 | 3.59 |
| 0.70 – 0.79 | 12 | 3.79 | 6 | 9.09 | 6 | 2.39 |
| 0.80–0.89 | 6 | 1.89 | 3 | 4.55 | 3 | 1.20 |
| Mean EE | 0.23 | 0.35 | 0.20 | |||
| Minimum | 0.01 | 0.03 | 0.01 | |||
| Maximum | 0.89 | 0.89 | 0.82 | |||
| Standard deviation | 0.21 | 0.23 | 0.19 | |||
| T-value | - | 5.43*** | ||||
Notes: *** represents a 1% level of significance. Source: Field Survey (2022).
The overall mean environmental efficiency of nitrogen fertilizer in the study area was 23%, ranging from 1% to 89% (Table 6). In other words, sample farmers could potentially lower around 77% of this input without compromising the average yield. However, previous studies have reported different findings regarding the environmental efficiency score of rice production using nitrogen fertilizer, which was 54% in Thailand [25], NPK fertilizer was 51% in Vietnam [22], and chemical weedicide plus nitrogen fertilizer was 24% in Pakistan [26]. The proportion of sample farms in Nay Pyi Taw with EE below 0.50 was 87%. The lower environmental efficiency means that a large amount of nitrogen fertilizer could substantially reduce its utilization with an improvement in environmental quality.
The average environmental efficiency for nitrogen fertilizer in monsoon rice production was 35% with the TP method and 20% with the BC method. It means that the average rice yield could be sustained or even increased by reducing 65% with the TP method and 80% of nitrogen fertilizer use with the BC method. The TP method was more environmentally efficient than the BC method, and the difference was statistically significant at a 1% level. This study revealed that although the nitrogen fertilizer use is not different between the two sowing methods, the higher rice yield of the TP method led to enhancing the environmental efficiency, thereby establishing it as an environmentally sustainable sowing method. This finding is supported by the study of Elsoragaby et al. (2019), in which lower nitrogen utilization and higher rice yield were found in the TP method compared to the BC method in wetland rice production in Malaysia [10].
CONCLUSION
The output-oriented technical efficiency was estimated using a stochastic translog production frontier, and the environmental efficiency with one environmentally detrimental input, nitrogen fertilizer, was estimated using a method developed by Reinhard et al. (1999) [18]. Comparison of technical and environmental efficiency between BC and TP sowing methods yielded compre- hensive findings with implications for agricultural practices and environmental sustainability. The study found notable variations in input usage between the two sowing methods, with the BC method exhibiting higher utilization of seeds and lower utilization of machinery, labor, and chemicals. Despite these differences, the average rice yields between the two methods were comparable, with the TP method demonstrating a significantly higher yield. Elasticity analyses demonstrated positive relationships between output and input factors, with nitrogen fertilizer application exhibiting the highest average elasticity. The sum of the output elasticity was less than 1, indicating decreasing returns to scale, and thus, the sample farmers were unable to increase output proportionally as an increase in inputs.
BC and TP sowing methods were the two most popular methods, which occupied about 48% and 33% of the total cultivated area of monsoon rice production in Myanmar. In the study area, the BC method was a more widespread practice for farmers 79% than the TP method. The technical efficiency and environmental efficiency for N fertilizer were significantly higher in the TP method compared to the BC method. This study confirmed that the TP method was a sowing method that was more technically and environmentally friendly than the BC method. As a technically and environmentally efficient sowing method, the adoption of the TP method should be promoted by highlighting its positive impacts. As the TP method is labor-intensive and Myanmar has a labor scarcity problem, the transplanting machine should be encouraged as a labor substitution technology for the TP method. Moreover, due to the limitations of the study, future research should consider expanding the geographic scope of the study to encompass a more representative sample of rice cultivation areas in Myanmar. This would enhance the generalizability of the findings and provide a more comprehensive understanding of rice production practices across the country. Additionally, this study accounted for only two sowing methods (TP and BC), and therefore, the other plant establishment methods should be tested for technical and environmental efficiency.
LIST OF ABBREVIATIONS
| N | = Nitrogen |
| TE | = Technical Efficiency |
| EE | = Environmental Efficiency |
| BC | = Broadcasting |
| TP | = Transplanting |
| FAO | = Food and Agriculture Organization |
| FAOSTAT | = The Food and Agriculture Organization Corporate Statistical Database |
| GHG | = Greenhouse Gas |
| SFA | = Stochastic Frontier Analysis |
| DEA | = Data Envelopment Analysis |
| LR | = Likelihood Ratio |
DATA AVAILABILITY STATEMENT
The data presented in this study are available on request from the corresponding author [M.M]. The data are not publicly available due to confidentiality requirements for the thesis.
FUNDING
This research was funded by the Southeast Asian Regional Center for Graduate Study and Research in Agriculture (SEARCA), Philippines.
CONFLICT OF INTEREST
The authors agree that this research was conducted in the absence of any self-benefit, commercial, or financial conflicts and declare the absence of conflicting interests with the funders.
ACKNOWLEDGEMENTS
This study is one part of the Ph.D. thesis in the Philosophy Program in Agricultural and Resource Economics, Graduate School, Kasetsart University. We would like to give the deepest gratitude to Southeast Asian Regional Center for Graduate Study and Research in Agriculture (SEARCA) providing all expenditures of this research. The authors would like to thank the rice farmers from the study area for their participation in data collection, and the government officials from Departments of Agriculture in Nay Pyi Taw Union Territory. Special thanks also go to Yezin Agricultural University, Department of Agricultural Research, Ministry of Agriculture, Livestock and Irrigation, and Ministry of Environmental Conservation and Forestry for their kind operation about data collection of this study. The enumerators are highly acknowledged for their help.

