All published articles of this journal are available on ScienceDirect.

Empowering Crop Selection with Ensemble Learning and K-means Clustering: A Modern Agricultural Perspective
Authors Info & Affiliations
Abstract
Introduction
Agriculture is an intricate blend of scientific principles and practical techniques that facilitate the growth of crops and the cultivation of livestock. It involves the careful cultivation of the land to produce essential food, fibers, and various other agricultural products.
Methods
Effective agricultural planning fosters self-sufficiency in food production, offers a source of income for farmers, and contributes to government revenue. This research focuses on utilizing ensemble learning techniques and K-means clustering to predict optimal crop types for specific environmental conditions and categorize crops according to their environmental requirements. This approach aims to refine crop selection strategies significantly.
Results
The study, employing a comprehensive dataset, applies these advanced methods, yielding accurate predictions and deeper insights into the interaction between crops and their growing environments.
Conclusion
These findings suggest a potential revolution in agricultural decision-making, highlighting the benefits of these methodologies in enhancing crop yield, reducing environmental impact, and promoting sustainable agricultural practices. The outcomes underscore the impact of data-driven approaches in modern agriculture, offering a promising direction for future agricultural development.
1. INTRODUCTION
Machine learning is increasingly being used to support decision-making in the field of agriculture. In recent years, there have been many studies and research efforts aimed at developing predictive models based on machine learning algorithms to support agricultural production and improve yields. One of the main applications of machine learning in agriculture is the prediction of crop yields, which can be accomplished through the use of various models, such as regression models, decision trees, and artificial neural networks. These models can be trained on historical data, such as weather patterns, soil conditions, and other factors, to make predictions about future crop yields. The results of these predictions can then be used to support decision-making related to planting and harvesting schedules, fertilizer applications, and other factors that affect crop yields.
Another area in which machine learning is being applied in agriculture is in the prediction of crop disease outbreaks. By analyzing large amounts of data related to weather patterns, soil conditions, and other factors, machine learning algorithms can be trained to identify conditions that are likely to lead to the development of crop diseases. These predictions can then be used to guide preventative measures, such as the application of fungicides, to minimize the impact of these diseases on crop yields. There have also been efforts to apply machine learning to other areas of agriculture, such as precision agriculture, animal husbandry, and food safety. In precision agriculture, machine learning algorithms can be used to optimize the use of inputs, such as fertilizers and water, to achieve maximum yields while minimizing waste. In animal husbandry, machine learning algorithms can be used to predict animal health and productivity, as well as to support decision-making related to breeding and feeding programs. In food safety, machine learning algorithms can be used to identify and predict food safety risks, such as the presence of pathogens in food products.
Another notable example is a study on Italian heavy pigs, where K-means clustering categorized shipments based on stress levels using pre-slaughter parameters [1]. This approach, assessing factors like transport conditions and animal behavior, demonstrates the diverse potential of machine learning in agriculture, extending beyond crop optimization to animal welfare and meat quality assessment. Such applications highlight the technology's pivotal role in enhancing various aspects of agriculture, including precision agriculture, animal husbandry, and food safety. These advancements underscore the significance of machine learning in optimizing resource use, improving animal health and productivity, and ensuring food safety.
2. LITERATURE SURVEY
Indian economy is greatly influenced by agriculture which in turn ensures the security of food. It becomes one of the challenging tasks to mitigate the food demand of the faster-growing population of the country. The economic status of farmers is adversely affected by the poor yielding of crops, which is caused due to unexpected random changes in the environmental condition. The production of crops is affected by several factors, such as agriculture planning, quality of soil along with landscape, use of pesticides, weather conditions, and feasibility in accessing the water [2-4]. These factors are interrelated with each other and make the strategy of crop production complex [5, 6]. The production of crops is costly and associated with nonlinearity and time constraints [7].
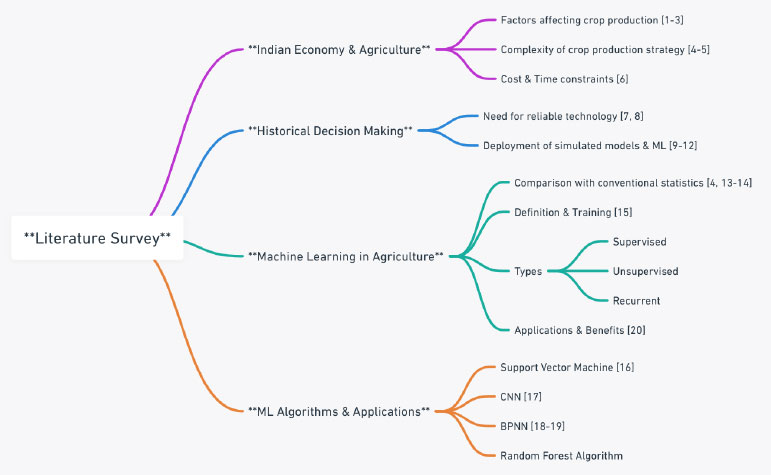
In the earlier days, farmers made decisions regarding the yielding of crops based on the historical background of the production of crops. Nowadays, there is a strong demand for technology that must be reliable and ensure the timing of production of crops worldwide despite climatic variability, growth of population, loss of soil, etc [8, 9]. Hence, deployment of recent technology, such as simulated models and machine learning vitally required for efficient and precision farming [10-13]. Researchers have put their effort into investigating the effectiveness of machine learning in comparison to conventional statistics in terms of accuracy [14, 15]. Machine learning comes under the domain of artificial intelligence which makes the computer trained with a set of predefined data to predict accurately in the future [16]. In machine learning, a given model is atomized by analyzing the information and minimizing human intervention in machine learning, where the system is capable of learning by itself without specifying any programming, so it improves machine efficiency by sensing and describing drive data consisting and pattern. Machine learning is associated with three different types of techniques such as supervised learning, unsupervised learning, and recurrent learning. Machine learning ensures a noticeable enhancement in the prediction capability of machines by overcoming both linear and nonlinear agriculture structures. It is claimed that Machine Learning (ML) has global applications in a variety of fields, including forecasting, fault detection, and pattern recognition. ML algorithms are used to select the type of crop to be produced to reduce the losses associated with its production procedure. All the ML algorithms ensure better results despite several distractions in climatic conditions. Support vector machine classifies the crop data based on texture, design of patterns on the infected surface, and shape [17]. CNN reduces the error relatively associated with crop-yielding prediction [18]. The back propagation neural network (BPNN) yields lower performance because of the use of a smaller size data set or sample [19, 20]. Different ML techniques are used for the prediction of crop yields, crop disease, crop selection, weather forecasting, etc. ML ensures the productivity of the field and also reduces the input and output effort of the farmer [21]. Random forest algorithm in ML belongs to supervised learning. These algorithms deal with the regression problem in machine learning. The following diagram (Fig. 1) presents a zest in the works of literature.
3. METHODOLOGY
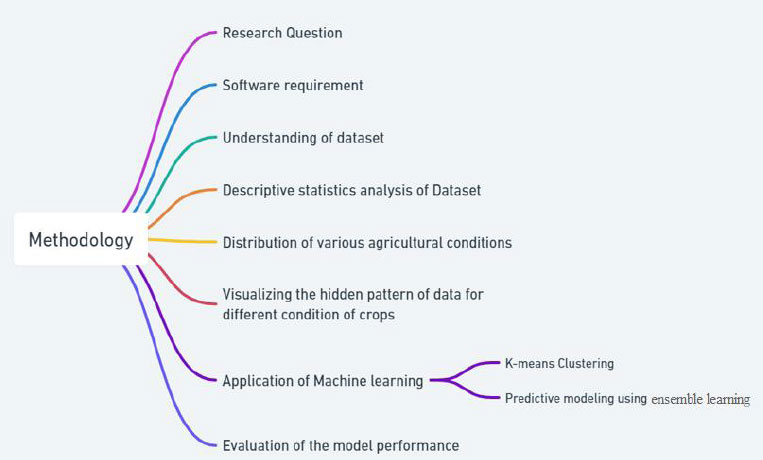
In this study, the objective was to predict the type of crop based on different environmental conditions and to form clusters of crops to understand which group of crops requires similar conditions for growth. The dataset was analyzed using K-Means clustering to form clusters of crops based on their environmental conditions, and a predictive model was proposed using ensemble learning to accurately predict the type of crop for a given environmental condition. In Fig. (2), the suggested methodological approach is explained through a mind map diagram.
3.1. Research Question
In modern agriculture, optimizing crop selection has emerged as a paramount concern. With variable environmental conditions and the pressing need for sustainable practices, predicting the most suitable crops for specific regions is essential. Enter machine learning. Through techniques like ensemble learning and K-means clustering, researchers are uncovering patterns and relationships between crops and their preferred environments. By analyzing vast datasets, these models offer predictions on which crops are most likely to thrive under given conditions. Such insights not only promise increased yields but also a more sustainable approach to agriculture. As the world grapples with food security, such innovations could be game-changing. The requirements are given in Table 1.
In this research work, the authors addressed the following research question;
“How can machine learning techniques, specifically ensemble learning and K-means clustering, be utilized to predict the most suitable crop type for given environmental conditions?
3.2. Software Requirement
3.2.1. Understanding of the Dataset
The dataset is imported from the Udemy depository into the Jupytor notebook by using the read_CSV function of Pandas. Concerning the shape of the dataset, there are 2200 numbers of rows and eight columns in the set. By using the head function, the columns of the data set are expressed, and those are Nitrogen, Phosphorus, Potassium, Temperature, Humidity, pH, Rainfall, and labels. It is observed that all twenty-two crops in the data set have an equal distribution. The summary of the dataset is given in Table 2.
| Software/Library | Purpose |
|---|---|
| Python 3.6.8 | The core programming language used for the study |
| Jupiter Notebook | A platform for combining live Python code with visualizations and text |
| Numpy | A library in Python used for numerical computation |
| Panda | A powerful data manipulation and analysis library for Python |
| Seabourne | Data visualization library based on Matplotlib. |
| Matplotlib | A plotting library for Python and its numerical mathematics extension, NumPy |
| Ipwidgets library | Provides interactive widgets for the Jupyter notebook |
| Background style | 538 - Likely a visualization style or theme |
| S.No | Symbols | Descriptions |
|---|---|---|
| 1 | N | The ratio of Nitrogen content in the soil |
| 2 | P | The ratio of Phosphorous content in the soil |
| 3 | K | The ratio of Potassium content in the soil |
| 4 | Temperature | Temperature of the environment in degrees Celsius |
| 5 | Humidity | Relative humidity in percentage |
| 6 | Ph | Ph value in soil |
| 7 | Rainfall | Rainfall in mm |
| 8 | Labels | Names of different crops (22 numbers) |
3.2.2. Descriptive Statistics Analysis of Dataset
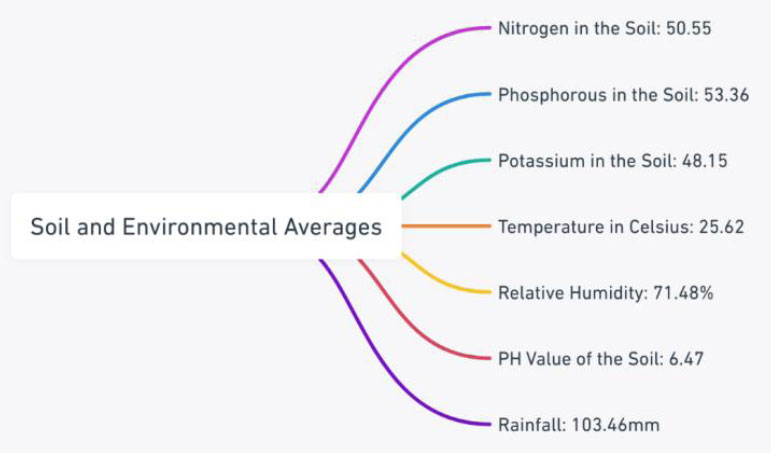
By checking the summary of the crops, the average ratio of nitrogen, phosphorus, and potassium, the average temperature for all the crops, the average relative humidity, the average Ph ratio of the soil, and the average rainfall are checked and expressed in Fig. (3). These figures were calculated by combining all of the crop yields.
After considering the statistics for all the crops combined, then the statistics for individual crops were examined by using the interactive function for the minimum, average, and maximum values of all the conditions for individual crops.
For example, considering the statistics for the musk melon crop, the minimum and maximum ratio of nitrogen required is 80 and 120, respectively. Similarly, for phosphorus, the minimum is five, and the maximum is 30. The ratio of potassium required for musk melon is between 45 and 55, Also, the temperature lies from 27 to 30°C Celsius. Likewise, the musk melon humidity requirement should be between 90 to 95 percent, and the value of Ph of soil should also in between 6 to 6.78. In the end, the minimum rainfall requirement is 20.21 mm, and the maximum is 29.87 mm. Similarly, some other individual crop statistics are given in Table 3.
| Individual Parameters for Different Crops | Banana | Mango | Apple | Rice | Orange | Coconut | Jute |
|---|---|---|---|---|---|---|---|
| Minimum Nitrogen required | 80 | 0 | 0 | 60 | 0 | 0 | 60 |
| Average Nitrogen required | 100.23 | 20.07 | 20.8 | 79.89 | 19.58 | 21.98 | 78.4 |
| Maximum Nitrogen required | 120 | 40 | 40 | 99 | 40 | 40 | 100 |
| Minimum Phosphorous required | 70 | 15 | 120 | 35 | 5 | 5 | 35 |
| Average Phosphorous required | 82.01 | 27.18 | 134.22 | 47.58 | 16.55 | 16.93 | 46.86 |
| Maximum Phosphorous required | 95 | 40 | 145 | 60 | 30 | 30 | 60 |
| Minimum Potassium required | 45 | 25 | 195 | 35 | 5 | 25 | 35 |
| Average Potassium required | 50.05 | 29.92 | 199.89 | 39.87 | 10.01 | 30.59 | 39.99 |
| Maximum Potassium required | 55 | 35 | 205 | 45 | 15 | 35 | 45 |
| Minimum Temperature required | 25.01 | 27 | 21.03 | 20.04 | 10.01 | 25 | 23.09 |
| Average Temperature required | 27.38 | 31.2 | 22.63 | 23.68 | 22.76 | 27.40 | 24.95 |
| Maximum Temperature required | 29.91 | 35.99 | 23.99 | 26.92 | 34.9 | 29.86 | 26.98 |
| Minimum Humidity required | 75.03 | 40.02 | 90.02 | 80.12 | 90 | 90.01 | 70.88 |
| Average Humidity required | 80.36 | 50.15 | 92.33 | 82.27 | 92.17 | 94.84 | 79.63 |
| Maximum Humidity required | 84.98 | 54.96 | 94.92 | 84.96 | 94.96 | 99.98 | 89.89 |
| Minimum ph required | 5.51 | 4.5 | 5.51 | 5.05 | 6.01 | 5.5 | 6.0 |
| Average ph required | 5.98 | 5.76 | 5.92 | 6.42 | 7.01 | 5.97 | 6.73 |
| Maximum ph required | 6.49 | 6.96 | 6.49 | 7.86 | 7.99 | 6.47 | 7.4 |
| Minimum rainfall required | 90.1 | 89.29 | 100.11 | 182.56 | 100.17 | 131.09 | 150.23 |
| Average rainfall required | 104.63 | 94.7 | 112.654 | 236.18 | 110.47 | 175.68 | 174.79 |
| Maximum rainfall required | 119.85 | 100.81 | 124.98 | 298.56 | 119.69 | 225.63 | 199.83 |
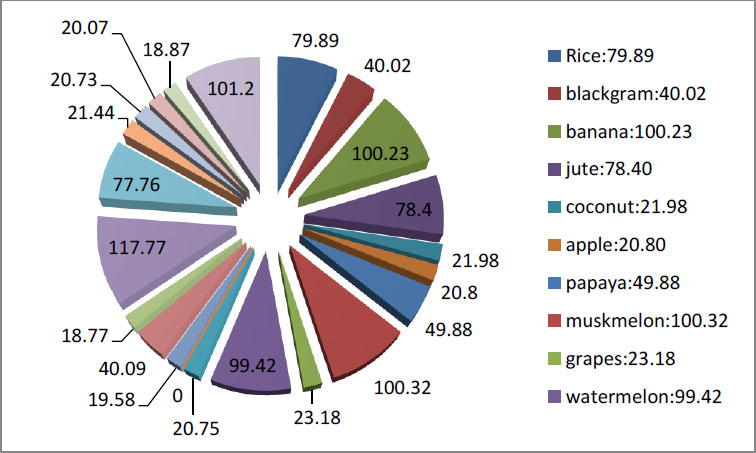
In the next step, the average requirement for each crop was compared with average climatic conditions using the Python interactive function. Here, it is marked that some crops require very little nitrogen content to grow, such as coconut, apple grapes, kidney beans, mung beans, oranges, lentils, and matar beans, and crops like pigeon peas, mango, and pomegranate require an average ratio of nitrogen and some crops require large content of nitrogen to grow such as banana, musk, melon, cotton, and coffee. The details analysis of nitrogen requirement is given in the graph below (Fig. 4).
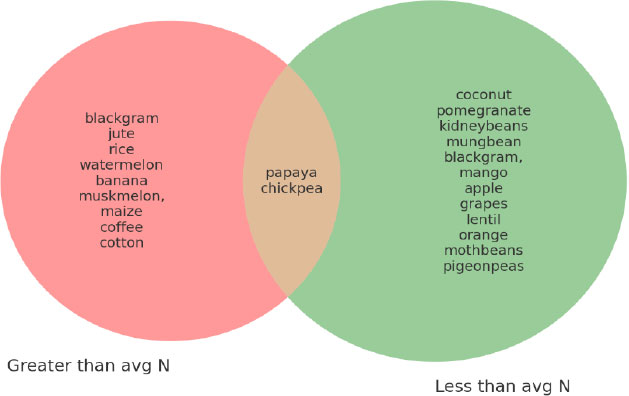
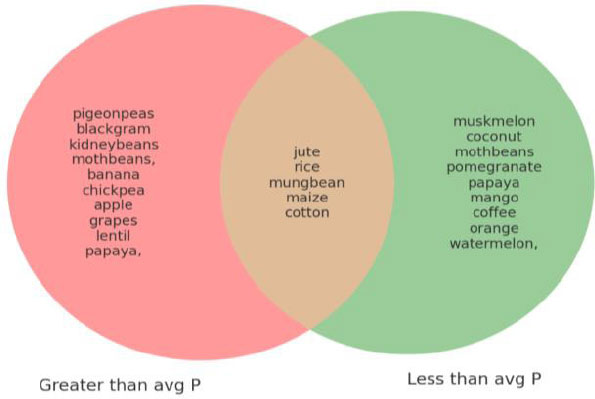
Now, by examining the crops which require more than or less than the average of given conditions to grow. By using IPE widgets, and after executing this, we can see the names of all the crops that require greater than average and less than average nitrogen and phosphorus, respectively as shown in Fig. (5a and 5b) below. Similarly, other parameters can be found programmatically.
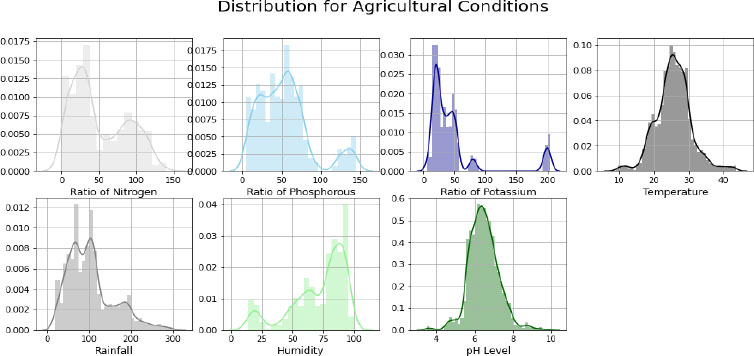
3.3. Distribution of Various Agricultural Conditions
The distplot function of Seabourne Library was used to verify the distribution pattern of various agricultural conditions. By analyzing the distribution plots, it is revealed that potassium is right-skewed and, humidity is left-skewed and all other crops are normally distributed, as shown in Fig. (6).
Moving toward more interesting facts, the crop which requires a very high ratio of nitrogen content in soil is cotton, high ratio of phosphorus content is required for grapes and apples, and also they require a higher ratio of potassium. Similarly, the other interesting patterns are presented in the following Table 4. Analyzing Table 4, it can be concluded that pH is not a major factor for growing mothbeans.
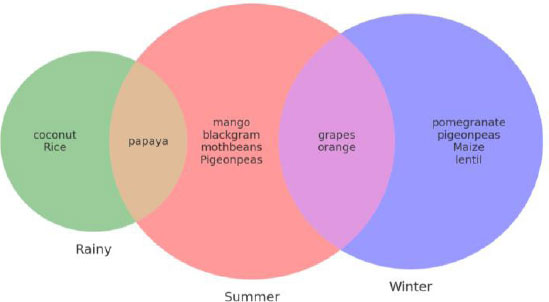
Next, the crops were categorized according to season, such as summer, winter, and rainy, by filtering the data based on temperature, rainfall, and humidity, and the list is presented in Fig. (7).
3.4. Visualizing the Hidden Pattern of Data for Different Conditions of Crops
A bar plot of each of the agricultural conditions with the label column was generated, as shown in Fig. (8). By analyzing the chart; it can be concluded that cotton is the only crop that requires a very high content of nitrogen to grow. Few crops require very little nitrogen. But banana, watermelon, musk, melon, and coffee require almost equal amounts of nitrogen to grow. Regarding phosphorus, grapes and apples are the only crops that require high amounts of phosphorus, and all other crops require quite less than these two.
| Parameters | Requirement Condition | Name of the Crops |
|---|---|---|
| Nitrogen | Very High (N > 120) | Cotton |
| Phosphorous | Very High (P > 100) | Grapes, Apple |
| Potassium | Very High (K > 200) | Grapes, Apple |
| Rainfall | Very High (> 200) | Rice, papaya, Coconut |
| Temperature | Very Low (T < 10) | Grapes |
| Temperature | Very High (T > 40) | Grapes, papaya |
| Humidity | Very Low (< 4) | Chickpea, Kidney beans |
| Ph | Very Low (> 9) | Moth beans |
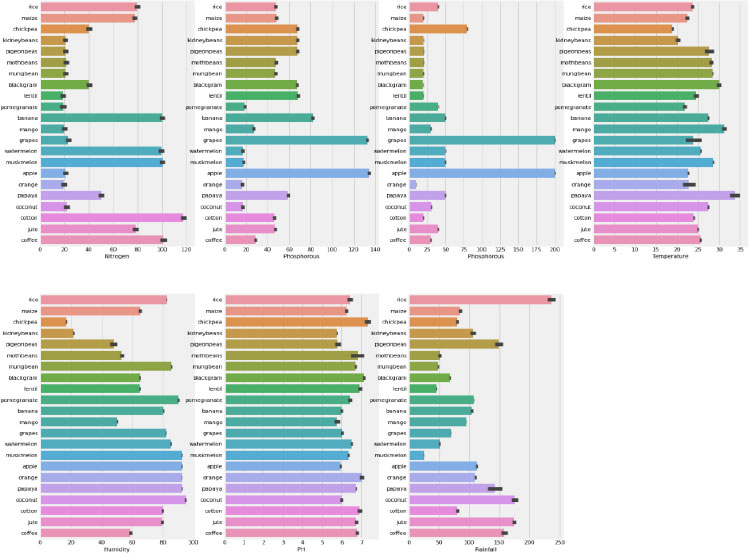
This same with the case of potassium, where grapes and apples require very high amounts of potassium and all other crops require very low amounts of potassium. While considering the temperature, all crops require moderate and almost the same temperature to grow except papaya, which requires more than 30 degrees Celsius. Regarding humidity, it has been observed that chickpea requires very little humidity to grow, and the same with kidney beans. Then, coming to the pH value of the soil, it is observed that all the crops require more than five pH values to grow. Finally, rice needs a lot of rain; Macmullan needs the least, and other crops need moderate amounts.
3.5. Application of Machine Learning
3.5.1. K-means Clustering
Clustering is the process of grouping data points with similar traits and assigning them into clusters so that the data points can be more easily understood and manipulated. The K-Means algorithm is a popular unsupervised learning technique for clustering. The goal of the algorithm is to divide a set of observations into K clusters, where each cluster is represented by its centroid (mean). The mathematical expression for the K-Means algorithm can be represented as follows:
The mathematical expression for k-means clustering can be described as an optimization problem where the objective is to minimize the sum of squared distances between each data point and its corresponding cluster centroid. The objective function can be expressed as:
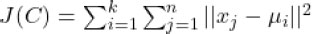 |
Where C is the set of cluster assignments, k is the number of clusters, n is the number of data points, xj is a data point, and μi is the mean of cluster i.
The k-means algorithm works by iteratively updating the cluster assignments and centroids until the objective function J(C) converges to a local minimum. The cluster assignments for each data point are updated by assigning each data point to the closest centroid, and the centroids are updated by taking the mean of the data points in each cluster. The algorithm terminates when the cluster assignments no longer change or when a maximum number of iterations is reached.
Once the algorithm has converged, the final set of centroids and their associated clusters represent the solution to the K-Means problem. To determine the best number of clusters, K, the algorithm can be run multiple times with different values of K and the quality of the solution can be evaluated using metrics such as the within-cluster sum of squared distances (also known as inertia).
To implement the clustering analysis, the warnings library is imported to avoid any warnings. Before applying the algorithm, it is required to specify the number of clusters beforehand in K-means. Here, the Elbow method is used to determine the optimal number of clusters. The program is run for K means clustering multiple times to calculate the average score for all clusters, where the score is the sum of squares of distances between each point to its assigned cluster center. Here, K-means is imported from sklearn. Cluster package and then kept on a loop to calculate the score for all the clusters from one to ten. After executing this, an elbow is obtained at three as well as four as shown in Fig. (9), and from the Figure, four clusters are considered as the optimal number of clusters.
After implementing key means, the names of all crops in each of the clusters are checked. It can be observed that some of the crops are in more than one cluster due to soft clustering (Table 5), but to keep crops in a single cluster, Hard Clustering was realized (Table 6), where each data point either belongs to a cluster completely or not. To implement a hard cluster, the value counts of a crop in a cluster were checked, and if it is more than 50, then the crop completely belongs to that cluster.
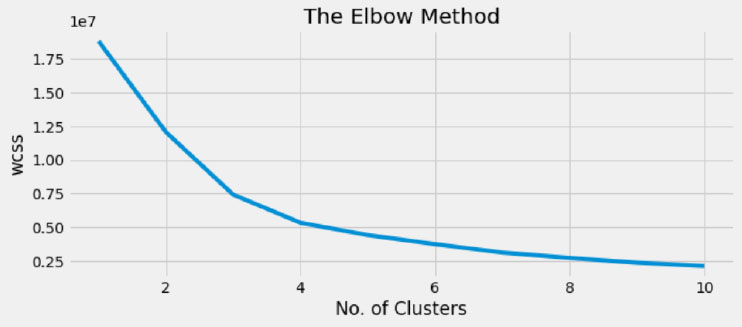
Table 5.
| Cluster | Name of the Crops |
|---|---|
| 1 | Maize, chickpea, kidney beans, pigeon peas, moth beans, mungbean, black gram, lentil, Pomegranate, mango, orange, papaya, coconut |
| 2 | Maize, banana, watermelon, muskmelon, papaya, cotton, coffee |
| 3 | Grapes, apple |
| 4 | Rice, pigeon peas, papaya, coconut, jute, coffee |
| Cluster | Name of the Crops |
|---|---|
| 1 | Chickpea, kidney beans, moth beans, mungbean, black gram, lentil, Pomegranate, mango, orange |
| 2 | Maize, banana, watermelon, muskmelon, cotton |
| 3 | Grapes, apple |
| 4 | Rice, pigeon peas, papaya, coconut, jute, coffee |
3.5.2. Predictive Modeling using Ensemble Learning
Ensemble learning combines the predictions from multiple individual models to achieve better overall predictive performance compared to any of the individual models. The process involves training multiple base learners on the same dataset and combining their predictions to make a final prediction.
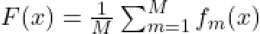
One common approach in ensemble learning is the simple averaging method, where the final prediction F(x) is the average of the predictions fm(x) from each of the individual base learners f1(x), f2(x), ….., fM(x). Mathematically, this can be represented as:
 |
where,
F(x) is the final predicted output from the ensemble model for a given input x
fm(x) represents the prediction of the individual base learner m for the input x
M is the total number of individual base learners in the ensemble
3.5.3. Evaluation of the Model Performance
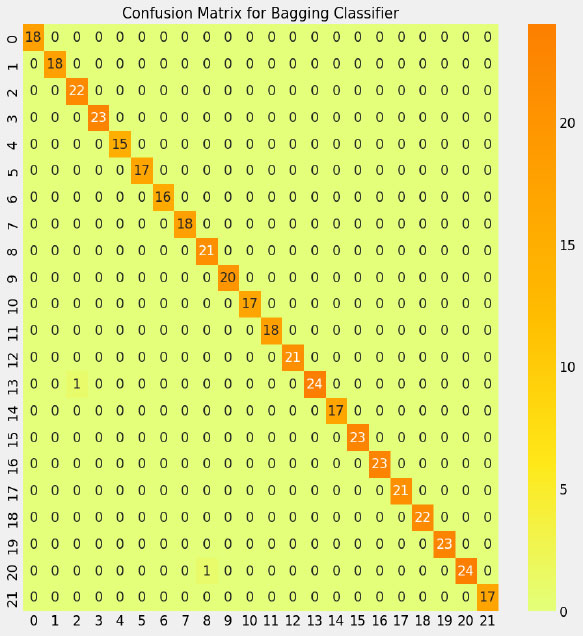
A model's performance evaluation for ensemble learning using the Bagging Classifier from the sci-kit-learn library is shown in Fig. (10). It begins by importing necessary modules, including the BaggingClassifier for ensemble learning, functions for generating a classification report, and a confusion matrix for evaluation, as well as modules for data visualization. The Bagging Classifier is trained on the provided training data and subsequently used to predict labels for the test data. The script then visualizes the confusion matrix as a heatmap, providing an overview of the model's performance, and prints a classification report detailing key metrics such as precision, recall, F1-score, and support for each class, thereby offering comprehensive insights into the model's predictive capability and overall effectiveness. The detailed performances of the proposed model are shown in Table 7.
4. RESULTS AND DISCUSSION
4.1. Predicting the Model
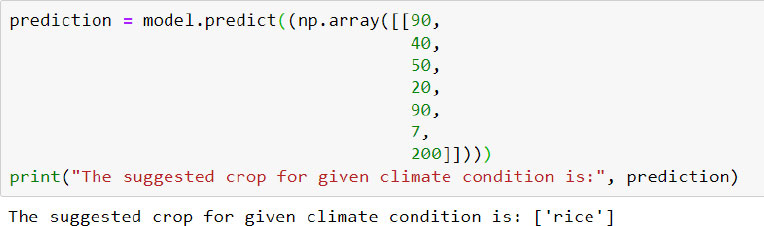
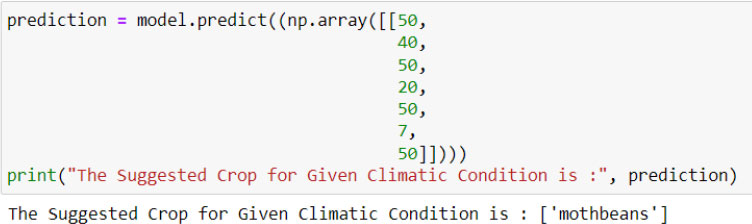
Using the predictive model, the prediction of the crops performed on the given agricultural condition. The first value, ninety, is for nitrogen, the second value is for Potassium, and so on for a particular site of the column names. Finally, the model predicts the suggested crop for the given conditions, which is represented in Fig. (11a and b).
| Name of the Crops | Precision | Recall | F1-score | Support |
|---|---|---|---|---|
| Apple | 1.00 | 1.00 | 1.00 | 18 |
| Banana | 1.00 | 1.00 | 1.00 | 18 |
| Blackgram | 0.96 | 1.00 | 0.98 | 22 |
| Chickpea | 1.00 | 1.00 | 1.00 | 23 |
| Coconut | 1.00 | 1.00 | 1.00 | 15 |
| coffee | 1.00 | 1.00 | 1.00 | 17 |
| cotton | 1.00 | 1.00 | 1.00 | 16 |
| Grapes | 1.00 | 1.00 | 1.00 | 18 |
| Jute | 0.95 | 1.00 | 0.98 | 21 |
| Kidneybean | 1.00 | 1.00 | 1.00 | 20 |
| Lentil | 1.00 | 1.00 | 1.00 | 17 |
| Maize | 1.00 | 1.00 | 1.00 | 18 |
| Mango | 1.00 | 1.00 | 1.00 | 21 |
| Mothbeans | 1.00 | 0.96 | 0.98 | 25 |
| Mungbean | 1.00 | 1.00 | 1.00 | 17 |
| Muskmelon | 1.00 | 1.00 | 1.00 | 23 |
| Orange | 1.00 | 1.00 | 1.00 | 23 |
| Papaya | 1.00 | 1.00 | 1.00 | 21 |
| Pegeonpeas | 1.00 | 1.00 | 1.00 | 22 |
| Pomegranate | 1.00 | 1.00 | 1.00 | 23 |
| Rice | 1.00 | 0.96 | 0.98 | 25 |
| Watermelon | 1.00 | 1.00 | 1.00 | 17 |
| Macro Avg | 1.00 | 1.00 | 1.00 | 440 |
| Weighted Avg | 1.00 | 1.00 | 1.00 | 440 |
CONCLUSION
In this comprehensive study, the primary aim was to predict crop types based on diverse environmental conditions and to categorize crops into clusters that share similar growth requirements. Employing the K-Means clustering technique, the dataset was effectively partitioned into distinct clusters based on environmental factors. At the same time, the proposed ensemble learning model demonstrated its robust capability in accurately forecasting crop types under specific environmental conditions. The study's findings highlight the effectiveness of K-Means clustering in facilitating the grouping of crops according to environmental attributes. Moreover, the successful application of ensemble learning underscores its potential utility for precise crop prediction, offering invaluable insights for farmers, agricultural researchers, and policymakers to make informed decisions on crop selection and strategic planning in accordance with the specific environmental nuances of a given region. Overall, this study underscores the instrumental role of K-Means clustering and ensemble learning in the meticulous analysis and projection of crop types, presenting a pivotal opportunity to enhance agricultural decision-making processes tailored to the distinct environmental landscapes of various regions.
LIST OF ABBREVIATIONS
| ML | = Machine Learning |
| BPNN | = Back Propagation Neural Network |
CONSENT FOR PUBLICATION
Not applicable.
AVAILABILITY OF DATA AND MATERIALS
The data and supportive information are available within the article.
FUNDING
None.
CONFLICT OF INTEREST
The authors declare no conflict of interest, financial or otherwise.
ACKNOWLEDGEMENTS
Declared none.

