All published articles of this journal are available on ScienceDirect.

Corn Field Management for Wintering Waterfowl on Eastern Long Island, New York
Abstract
Aim:
A novel corn field management program to feed wintering waterfowl was investigated.
Background:
Decreased food availability for waterfowl on the Atlantic coast may necessitate novel management.
Methods:
Standing sections of corn were chopped using a brush hog once every two weeks after the close of waterfowl hunting season on Long Island, New York, February – March 2018 and 2019. Corn was sampled to determine initial yield and waterfowl and other wildlife use, corn depletion, and relationships between depletion and energy needs of waterfowl were determined.
Results:
The mean (± SE) initial yield was 5,156.0 ± 1,306.7 kg/ha. Canada geese accounted for 54% of all waterfowl use and mallards were twice as abundant at corn fields than American black ducks. Fields averaged 4.08 ± 0.20 ha, but ~50% less corn could have been planted to meet the energy needs of waterfowl in this study. However, 27% of sections chopped in the first two weeks were depleted to zero or near zero, whereas sections chopped in the last two weeks had 1,954.9 ± 1,309.9 kg/ha of corn.
Conclusion:
More corn could have been chopped early in winter and less as spring approached to meet the seasonal energy needs of waterfowl. Waterfowl using corn fields could gain fitness advantages, but a better understanding of diets, body condition, and seasonal stress, as well as the use of corn fields relative to other habitats by individual Canada geese and ducks, are needed. Results provide guidance on the delivery of corn planting and chopping programs to feed wintering waterfowl in the northeastern United States.
1. INTRODUCTION
The conversion of wetlands and uplands to agriculture and human residences decreased the availability of traditional waterfowl habitats and foods in North America [1, 2]. Feeding in agricultural fields may be increasingly important for granivorous waterfowl (i.e., waterfowl adapted to feed on seeds) during winter in some areas because of declines in wetland area and associated foods these birds traditionally consumed to meet energy and nutrient needs [3]. Increased area in row crop agriculture greatly increased the availability of waste grain to non-breeding waterfowl in North America during the mid-1900s [4-6]. However, in recent decades, harvester efficiency has increased, leading to a decrease in available waste corn in fields, often to levels that are not profitable for foraging by waterfowl (i.e., giving-up density; GUD) [7-9]. The combination of decreased availability of wetlands and their associated foods, and declines in available waste corn may necessitate novel management options to meet the foraging needs of North American waterfowl at some locales.
Waterfowl typically gain mass, which is mostly lipids, during autumn migration and staging when carbohydrate-rich resources are available and then use lipids to survive winter. During cold and snow events, waterfowl will increase food intake to curtail declines in nutrient reserves and thermoregulate [10-12]. As spring approaches, waterfowl eat foods beyond daily energy needs and store lipids and other nutrients in preparation for spring migration and breeding [13-15]. This period of hyperphagia, or rapid lipid storage, is a critical period when food resources can limit migration and future productivity [16-18]. As such, food resources during the non-breeding period can be limiting to waterfowl due to immediate effects on survival [19, 20] and carry-over effects (COEs) that can influence reproduction and survival in the following seasons [21-23]. For granivorous waterfowl, exploitation of grain left in agricultural fields following harvest (i.e., waste grain) may be important for winter survival and have COEs [24].
Along the Atlantic coast of North America, land-use conversion at the ecosystem scale has been altering natural habitats into an agricultural and urban-dominated landscape [25-27]. Specifically, urbanization of the Atlantic coast has reduced the quantity and quality of coastal wetlands that are important to wintering waterfowl [28, 29]. Much of the Atlantic coast has harvested row crop agriculture accessible to non-breeding waterfowl, but these resources on Long Island are limited because urbanization dominates much of the island. Historically, US Fish and Wildlife Service National Wildlife Refuges, state wildlife areas, and private landowners have planted corn to provide supplemental food resources to waterfowl during the non-breeding period, but few empirical assessments exist to efficiently deliver these planting programs. Field harvest using normal practices likely does not provide an abundance of waste corn because of increasing harvester efficiency [7-9]. Chopping standing corn after the regular waterfowl season (e.g., January to March) is an alternative method that may provide substantial food resources to granivorous waterfowl. Coastal wetland restoration on Long Island and elsewhere along the Atlantic coast is especially difficult because costs per unit area are relatively great and numerous jurisdictional regulatory agencies with contrasting interests must be navigated [30, 31; Jim Feaga, Ducks Unlimited, personal communication].
The aim of this study was to determine initial standing corn yield, corn depletion, and relationships between corn depletion and waterfowl energy needs in corn fields chopped with a brush hog on eastern Long Island. Common waterfowl on Long Island that feed in corn fields include Canada geese (Branta canadensis), mallards (Anas platyrhynchos), and American black ducks (A. rubripes; hereafter black duck). Corn yield and depletion along with waterfowl use data provide baseline information for effective delivery of planting programs on private and public lands in the northeastern United States for wintering waterfowl.
2. MATERIALS AND METHODS
2.1. Study Area
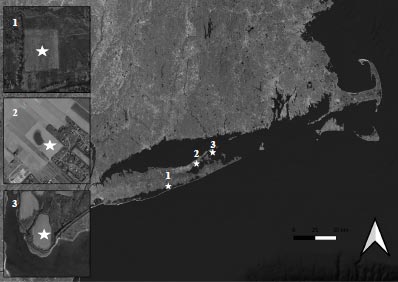
The study took place in corn fields in Suffolk County, Long Island, New York, 7 February – 4 April 2018 and 7 February – 10 April 2019 (Fig. 1). Fields were planted for typical production of corn with 15.2 cm (6 inch) spacing among plants in rows 30.5 cm (12 inch) apart. Suffolk County contains coastal wetlands, freshwater ponds, and rural landscapes where corn fields are available to wintering waterfowl. Seasonal corn yield and wildlife abundance were determined at two corn fields in 2018 and 2019 (Cutchogue [41.023° N, -72.511° W] and Orient Point [41.141° N, -72.278° W]) and included another corn field in 2019 (Brookhaven [40.798° N, -72.891° W]).
2.2. Estimation of Corn Yield
Corn fields were divided into three sections and marked with flagging to identify them from a distance. The mean (± SE) corn field size was 4.08 ± 0.20 ha (Cutchogue = 3.99 ha, [0.87 ha, 1.33 ha, and 1.79 ha sections]; Orient = 4.47 ha, [1.46 ha, 1.46 ha, and 1.55 ha sections]; Brookhaven = 3.78 ha, [1.26 ha, 1.26 ha, and 1.26 ha sections]).
Cornfield samples were taken to obtain an index of corn availability and corn depletion rates following Barney [8]. One section in each field was chopped with a brush hog every 2 weeks until all three sections in a field were chopped. Sections of standing corn were sampled once, the day before chopping and after chopping once every two weeks in 2018 and weekly in 2019. Sampling was adjusted to weekly in 2019 because some sections were depleted to zero or near zero kg/ha in < 2 weeks during 2018. A random sampling design was used to distribute samples throughout the field. Main transects (n = 3) were established perpendicular to the field edge in each section of a field (evenly spaced 20 − 26 m apart). For each sampling period, a random number generator was used to select sampling points along each main transect. The same number of samples were taken along each main transect (n = 4; n = 12 per section). A random number generator was used to determine the left or right direction of samples to be taken off of the main transect along a perpendicular transect. A random number generator was used to determine the distance of the sampling point along the perpendicular transect (between 1 – 10 m). Corn was sampled using a 1 m × 1 m quadrat at each sampling point and all corn within each quadrat was collected and placed in marked plastic bags. All individual kernels, cobs full of kernels, and cobs partially covered in kernels were included in the sample and frozen within 4 hrs of sampling. In the lab, corn was thawed, kernels were removed from cobs, and samples were dried at 60°C until a constant mass at 48 hrs and weighed to ± 0.1 g, and reported as kg/ha [32].
2.3. Waterfowl and other Wildlife Surveys
Wildlife surveys were conducted at each field on 8 February – 3 April 2018 and 8 February – 9 April 2019. Morning and evening surveys were conducted, switching the time of the survey at each field weekly. Morning surveys occurred 30 min before to 2 h after sunrise and evening surveys were 2 h before to 30 mins after sunset. To survey two fields on the same day, one field was surveyed in the morning and another field in the evening following weekly protocol for switching survey times. Each field was surveyed 3 times per week. Observation points were adjusted accordingly to maximize a clear line of site when each section was chopped. Waterfowl flew into and landed in fields during sunrise and sunset surveys. Canada geese that were in fields at the start counts were included. This scenario reduced the error in counting and identifying waterfowl to species, so 100% detection was assumed. For each field, the total number of waterfowl, species composition, and other wildlife were recorded. Other wildlife included blackbirds (Icteridae), white-tailed deer (Odocoileus virginianus), and wild turkeys (Meleagris gallopavo) [8].
2.4. Data Analysis
Total dry mass corn (kg/ha) available for each field in 2018 and 2019 was estimated and analysis of variance was applied to determine if initial, pre-chopping corn yield was influenced by field and year, and section was nested in the field as a random variable [33]. Mean (± SE) initial corn yield for each field section prior to chopping was reported and results were considered significantly different at α = 0.05 and worthy of discussion at α = 0.10. To calculate and depict the depletion of corn per field, final values were subtracted from initial, pre-chopping corn density estimates. Energy depletion was estimated by multiplying these density depletion estimates by 1,000 to convert corn in kg to g and then multiplied those results by the true metabolizable energy of corn in waterfowl (3.67 kcal/g) [34]. Waterfowl and blackbird use days (WUD and BUD, respectively) of fields were calculated by interpolating between count days and adding those daily abundances. Simple descriptive statistics were calculated for other wildlife that were relatively uncommon during surveys.
To determine waterfowl energy needs (WEN) at each field, use days for each species were multiplied by the daily energy requirement (DER) for mallards and black ducks (356.84 kcal/day), Canada geese (871.89 kcal/day) and mean DER for other waterfowl use (OWU; northern pintail, [Anas acuta], gadwall [Mareca strepera], American green-winged teal [A. carolinensis], and wood ducks [Aix sponsa]; 244.74 kcal/day) were observed [34]. Blackbird energy needs (BEN) were calculated by multiplying BUD by their DER (24.8 kcal/day) [36].
Estimates of corn energy depletion and energy needs of birds (i.e., WEN and BEN) were used to estimate the percentage of corn eaten in fields by birds. GUD could not be compared to other studies because additional corn was made available once every two weeks by chopping and corn remained in fields even at the end of the study in April when waterfowl were leaving the study area. However, following the assumption that the aim was to feed waterfowl by chopping corn, the mean corn density remaining in fields at the end of the study was used to estimate the surplus ha planted and how many more waterfowl this remaining corn could have fed during the 62-day study period.
3. RESULTS
No effect of the year (P < 0.10) on initial corn yield (i.e., standing corn before chopping) was detected, but there was evidence that initial corn yield differed among fields (F2, 6 = 4.13, P = 0.07; Fig. 2). Therefore, mean (± SE) initial corn yield (kg/ha) was calculated for each field (Cutchogue = 7,750.8 ± 1,089.5 kg/ha; Orient = 3,588.9 ± 836.8 kg/ha; Brookhaven = 4,126.4 ± 1,730.1 kg/ha). The mean initial corn yield for combined fields was 5,156.0 (± 1,306.7 kg/ha). Mean initial energy yields from corn (kcals/ha) among fields was 18.9 ± 4.8 million kcals/ha (Cutchogue = 28.4 ± 4.0, Orient = 13.2 ± 3.1, Brookhaven = 15.1 ± 6.3).
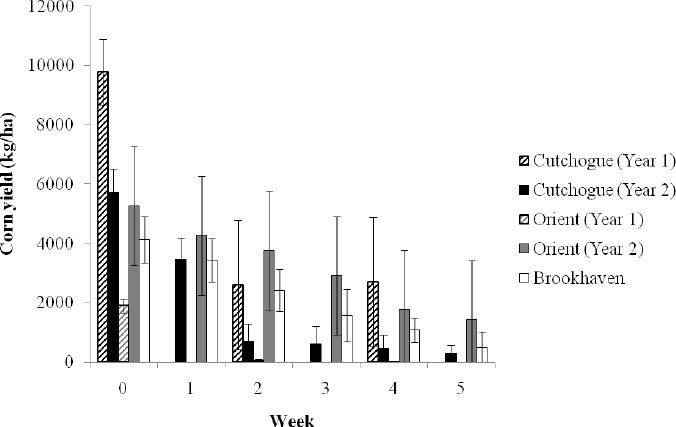
The mean (± SE) kg/ha of corn remaining for sections that were abandoned and never used again by waterfowl (i.e., GUD) was 266.4 ± 220.3 kg/ha (range 0 – 1,825.1 kg/ha; median = 0.9 kg/ha). Early in winter, the first sections chopped were reduced to 0 kg/ha and abandoned by waterfowl within 2 to 4 weeks at 3 of 5 field × year combinations, whereas the two fields with corn remaining were 92.6% and 76.3% depleted. The second and third sections chopped were never reduced to 0 kg/ha until 5 weeks after chopping, and 50% had corn available until the end of the study. The second and third sections chopped with corn remaining at the end of the study averaged 66.4% depletion (range = 37.5% to 89.4%; Fig. 2).
Waterfowl use occurred in 58% of surveys. Percent WUD during the study was 54% Canada geese, 30% mallards, 15% black ducks, and 1% OWU (Fig. 3). There was 30% more black duck than mallard use at the Orient field, which was the only field immediately adjacent to coastal marshes (Figs. 1 and 3).
Blackbirds, white-tailed deer, and wild turkeys occurred during 10%, 16%, and 1% of surveys, respectively. Mean abundances when they were present were 1,243.9 ± 336.9 (SE) for blackbirds, 8.2 ± 3.3 for white-tailed deer, and 19.1± 5.5 for wild turkey. Raccoons (Procyon lotor) were also observed at night in the area when driving to and from the study fields but were not present during daytime surveys.
It was estimated that energy from the corn depletion observed could have fed 6,125 geese and dabbling ducks for the 62-day study period, but surveys estimated 2,621 of these birds per day among fields during this period. Corn depletion that could not be accounted for using waterfowl surveys and energetics models could have fed an additional 342 waterfowl per day for the 62-day study period (weighted by percent use = 185 Canada geese, 51 black ducks, 103 mallards, and 3 other dabbling ducks). In addition, energy remaining in corn fields at the end of the study area exceeded waterfowl energy needs by 9.5 ± 2.0 (SE) million kcal/ha and it was calculated that, on average, 1.99 ± 0.51 (SE) less ha per field (~50% of the planted area) could be planted to meet energy requirements of these foraging birds. Overall, the energy needs of birds from surveys explained up to 37.8% of the corn depletion observed among fields (range = 19.9% to 58.7%).

4. DISCUSSION
Cornfield yield varies among regions and years [37]. At the beginning of the study in February, corn yield (5,156 ± 1,306 kg/ha) was 18% less than the 6,260 ± 590 kg/ha for December estimates of corn left standing for wildlife in Tennessee, but similar to their January estimate (5,539 ± 568 kg/ha) [9]. Regional differences between mid-continent and coastal Long Island such as soil type, day length, and climate may explain some variation. Further, animals feeding on corn from autumn to February likely reduced corn availability prior to chopping at the study fields. Initial yield estimates suggest that northern latitudes can produce corn for waterfowl at densities similar to those from mid-latitudes of North America. However, there also was substantial variation in initial yield among study fields (range= 3,588.9 to 7,750.8 kg/ha), which likely occurred because of differences in planting times, soil nutrient quality, and wildlife feeding on corn prior to sampling. The GUD estimate for corn was not comparable to other studies because additional corn was made available throughout the study, which is likely why it was 55% greater than GUD reported in other studies [34]. This greater GUD likely occurred because of the surplus of corn at chopped fields during this study, whereby birds abandoned sections that still contained corn to feed on newly chopped sections.
It was estimated that waterfowl and blackbirds only accounted for slightly more than 1/3rd of the depletion of corn observed in fields, even if 100% of their energy needs were met with corn. An unaccounted reason for variation could be from additional feeding by birds not captured in surveys. For example, surveys took place in the morning and evening to capture the periods of greatest waterfowl use, but blackbirds tended to feed in relatively large flocks (e.g. 1,000 birds) throughout the day. Due to foraging behavior, it was expected that white-tailed deer and racoons more frequently ate corn at night, which could not be detected during diurnal surveys. It is possible that blackbirds, nocturnal feeding by other wildlife, and mid-day flights from Canada geese accounted for the difference between depletion attributed to bird energy needs and total corn depletion [8]. Furthermore, common wildlife species can impact pre-harvest corn yield and subsequent depletion. However, few studies have been conducted on the quantity of corn removed by each species and their effect on corn depletion [36, 38, 39]. Thus, more research could be conducted to quantify the effect of wildlife use on initial corn yield and corn depletion rates because it was estimated that corn depletion was much greater than possible by waterfowl alone.
Despite the use of corn fields by other wildlife in addition to waterfowl, there was an abundance of corn remaining in fields at the end of the study in April. Using a conservative GUD of 183,500 kcals/ha (50 kg/ha) and mean percent waterfowl use (Canada goose = 54%, mallard = 30%, black duck = 15%, and OWU = 1%), fields could have supported an additional 93 Canada geese/ha, 126 mallards/ha, 63 black ducks/ha, and 6 other waterfowl/ha per day during the 62-day study period (i.e., 5,766 Canada goose-, 7,812 mallard-, and 3,906 black duck-use-days/ha). However, it was detected that the first sections chopped were often completely depleted of corn in February when cold weather and ice-covered wetlands may create the greatest need by waterfowl to feed in corn fields. These analyses provide guidance on the application of corn chopping to supplement traditional food resources for waterfowl during late winter after the close of the regular waterfowl season (e.g., January).
Canada geese, mallards, and black ducks were the most common species observed at corn sites. Canada geese were the most abundant waterfowl and this could be problematic and exacerbate nuisance issues if they are from the Atlantic Coast temperate-nesting population of Canada Geese (TNP). However, if these Canada geese are from the North Atlantic population (NAP), which are much less abundant and more sensitive to recruitment of goslings into the adult population, there may be benefits to providing foraging in predictable, energy-dense corn fields. It also was estimated that mallard abundance at corn fields was twice that of black ducks. However, 30% greater use of corn fields by black ducks than mallards was detected on the eastern most field at Orient point, which could be a result of less urban development and a greater abundance of coastal wetlands and saline environments in proximity to the field. Corn fields may increasingly serve as a food source for black ducks when foods in coastal wetlands are limiting [29], but foraging in corn fields can also lead to increased encounters and interactions with mallards that are potentially adapted to better exploit agricultural food sources [40-43]. Selecting fields for planting supplemental corn in closer proximity to coastal wetlands may be advantageous and promote more black duck use compared to mallards. Corn fields that are further away from coastal wetlands were exploited to a greater degree by mallards and Canada geese which could limit benefits for black ducks.
CONCLUSION
Managers of waterfowl habitat in the Atlantic region are increasingly challenged by decreased capacity to meet waterfowl habitat needs during the non-breeding period using traditional wetland restoration methods. Urbanization, declining quality of coastal wetlands, and sea-level rise are among the many stressors on Atlantic coast wetlands and wetland wildlife. This study investigated how chopped corn fields could meet the energy demands of granivorous waterfowl during winter on eastern Long Island. The energy provided by corn sites exceeded waterfowl energy needs, suggesting that less corn per field can be planted to meet the daily energy needs of waterfowl currently wintering on eastern Long Island. Based on depletion curves from this study, it is recommended to chop larger areas of corn earlier in winter and less as spring approaches and focus on fields closer to coastal wetlands if providing greater foraging opportunities for black ducks is a priority. Canada geese, black ducks, and mallards were the most common species using chopped corn fields and each of these species is of conservation concern for different reasons. Black ducks rely on wetlands of the Atlantic coast during winter and remain below population goals, estimates of breeding mallards in the northeastern US declined by about 40% since 2000, and the Canada geese could be from the nuisance TNP or the much smaller NAP. Future studies should focus on understanding the relative use of coastal wetlands, freshwater wetlands, and agricultural fields by black ducks, mallards, and Canada geese on Long Island, as well as the percentage of TNP and NAP Canada geese using these chopped corn fields.
LIST OF ABBREVIATIONS
| COE | = Carry-over effects |
| WUD | = Waterfowl use days |
| BUD | = Blackbird use days |
| WEN | = Waterfowl energy needs |
| DER | = Daily energy requirements |
| OWU | = Other waterfowl use |
| BEN | = Blackbird energy needs |
| GUD | = Giving-up-density |
AVAILABILITY OF DATA AND MATERIALS
Data supporting the findings of the article are available in the Zenodo Repository at Zenodo.org, DOI 10.5281/zenodo.8250894n.
FUNDING
The State University of New York College of Environmental Science and Forestry, The Long Island Wildfowl Heritage Group, The Moore Charitable Foundation, and Central New York Wildfowlers provided funding.
CONFLICT OF INTEREST
The authors declare that they have no known competing financial interests or personal relationships that could have appeared to influence the work reported in this paper.
ACKNOWLEDGEMENTS
J. Ramirez and E. Marchini assisted with all aspects of the field season. Suffolk County Parks, D. Latham, and T. Muller for providing access to private lands to complete corn field surveys.

