All published articles of this journal are available on ScienceDirect.

Optimizing Irrigation Water and Nitrogen Fertilizer Levels for Tomato Production
Abstract
Background:
Though nitrogen and water are key factors for tomato production, their optimum integration is not well identified in the study area. Therefore, optimizing irrigation level and nitrogen fertilizer rates are crucial to boost tomato yield as well as for better nutrient and Water Use Efficiency (WUE).
Objective:
The objective of the present study was to determine the optimum irrigation water and nitrogen fertilizer levels for higher tomato yield, improved water and nutrient use efficiencies.
Methods:
Split plot design was implemented with three irrigation levels expressed as a percentage of potential Evapotranspiration (ETc) allotted to the main plots and four nitrogen levels as sub-plots. Climate data were imported to AquaCrop model climate dataset for determining irrigation water amount and irrigation scheduling. Irrigation scheduling was determined using the FAO AquaCrop model and the crop evapotranspiration (ETc) in AquaCrop model was determined using Penman-Monteith method.
Results:
Irrigation water and nitrogen fertilizer levels markedly influenced the growth and yield performance of tomato, nutrient residue, Agronomic Efficiency (AE), Partial Factor Productivity (PFP) as well as Water Use Efficiency (WUE). With this, the most influential factor for tomato production was the nitrogen level rather than irrigation.
Conclusion:
In this study, higher growth and yield performance as well as, better water and nutrient use efficiencies of tomato were obtained while the irrigation level of 75% ETc is interacted with a nitrogen fertilizer rate of 92 kg N/ha.
1. INTRODUCTION
Tomato (Solanum lycopersicum L., syn. Lycopersicon esculentum Mill.) is a popular vegetable grown extensively throughout the world for their edible fruits and nutritional values [1]. They are valuable to our health and serve us good sources of provitamins, β carotene, and vitamin C. Moreover, tomatoes are mainly rich sources of lycopene, which is an exceptionally powerful antioxidant and assists in preventing the prevalence of various forms of cancer [2-4]. Therefore, tomato is receiving significance in both developing and developed nations, and endeavors are being employed to enhance the quality and quantity of tomato production [5, 6].
Plant nutrition is one of the significant factors affecting plant production. Nitrogen is among the essential elements for proper growth and development of plants and hence it is the yield-limiting factor in several areas especially in soils with low organic matter content [7]. Although N supply can improve productivity, the blanket recommendation for N fertilizer application is common in agricultural production [8]. Several studies have indicated that plant yield and plant N concentration can be increased by increasing N fertilization, but the NUE might be decreased [9, 10]. Previous findings have revealed that the PFP and AE reduced with an increase in N fertilizer rate and the highest marketable yield and optimum economic yield were obtained with the N rates of 271 and 265 kg/ha, respectively [11, 12].
Water stress is the other most important environmental factors that limit crop production [13]. On the other hand, too much use of irrigation water leads to inefficient water use [14]. Hence, for better tomato water use efficiency, emphasis should be given to the efficient use of water, both to get better yields and to optimize water use [15]. The research result by Perniola et al. [16] indicated that the highest marketable yield was obtained by supplying 100% ETc amounted to 66.4 t/ha as the mean value of three cultivars, whereas only 6.21 t/ha was achieved in non-irrigated treatment (the control). However, WUE was highest in the treatment receiving 50% ETc and amounted to1.09 kg/ m3.
Therefore, both irrigation and nitrogen fertilizer applications are among the essential factors affecting the growth and fruit yield of tomato [17-23]. Moreover, several studies have investigated the interaction effects of irrigation and fertilization on NUE and WUE [23-30]. Though nitrogen and water are key factors for tomato growth and yield, their optimum integration is not well identified, especially in the study area. Thus, optimizing irrigation level and nitrogen fertilizer rates are crucial for adopting them as a management tool for boosted tomato yield as well as for better nutrient and water use efficiencies. The present study was aimed to assess the effects of irrigation water and nitrogen fertilizer levels on tomato yield, nutrient residue, as well as water and nutrient use efficiencies.
2. METHODOLOGY
2.1. Description of the Study Area
The present study was carried out at Aksum University Selekleka Research and Technology Transfer Center. The experimental area is situated at 140 08’ 57”N latitude and 380 17’ 02” E longitudes at an altitude of 1945 meters above sea level. Though the main rainy season of study area extends from June to September with the mean annual rainfall of 980.36 mm, this experiment was conducted during the months of December to May 2018/19 using drip irrigation in the dry season. The rainfall distribution of the study area is characterized by unimodal pattern where more than 90% of it is concentrated in the period between July and August. The average temperature of the study area for the past 15 years revealed 20.92 °C with a mean maximum temperature record (28.64 °C) in April and the mean minimum (10.9 °C) in January [31].
2.2. Experimental Design and Treatments
Split plot design with three replications was used to assess the effect of irrigation water and nitrogen levels on tomato growth and yield performance, nutrient residue, as well as nutrient and water use efficiencies. The three irrigation levels expressed as a percentage of potential Evapotranspiration (ETc) were; IL-1 (50% ETc), IL-2 (75% ETc) and IL-3 (full irrigation or 100% ETc) and they were randomly allotted to main plots. Whereas, four nitrogen levels (0, 46, 92 and 138 kg N/ha) were designed as sub plots. The size of individual plot was 3m by 4 m with 1 m and 1.5 m space between plots and blocks, respectively. Tomato, variety ‘Galilya’ was used as a test crop and seedlings were raised in a nursery using plastic trays and transplanted to the experimental field after they produced 6-8 leaves. The land was ploughed twice using the tractor and prepared for planting using manpower. The spacing between tomato plants and rows were 40 and 100 cm, respectively. The treatments were applied after tomato seedlings being established. All the agronomic activities including fertilizer application (other than urea), weeding, cultivation, staking, disease and insect pest control were carried out for all the experimental plots equally as per the recommendations. Mineral nitrogen fertilizer sourced from Urea (46% N) was applied in three splits (one-third after seedling transplanting and being established, and the other two-third during the growth stage) by drilling in the sunken around each plant and then gently buried with soil.
2.3. Determining Crop Evapotranspiration and Irrigation Scheduling
Climate data was imported to AquaCrop model climate dataset for determining irrigation water and irrigation scheduling. Irrigation scheduling was determined using the FAO AquaCrop model [32, 33]. Crop Evapotranspiration (ETc) in AquaCrop model was determined using Penman-Monteith method following the procedures in Allen et al. [34]. Irrigation was set until the soil reaches field capacity (Back to field capacity). Based on the model output, the amount of irrigation water (mm) for 100% ETc, 75% ETc and 50% ETc were 581.3, 435.97 and 290.65 mm, respectively.
Irrigation scheduling was determined using the soil water balance method computed following the procedures in FAO-56 Irrigation and Drainage paper [34], Equation 1.
 |
(1) |
Where; ETc is crop evapotranspiration (mm), P represents for precipitation, I is total irrigation water amount (mm) applied to experimental plots from the time of transplanting to the last harvest, RO stands for runoff (mm), D is loss by deep percolation (mm), C is capillary rise (mm) and
Irrigation treatments were applied after tomato seedlings were well established and irrigation water were properly applied when 40% of the Readily Available Water (RAW) was depleted from the root zone. Irrigation water was applied to each treatment twice a day (early morning and late in the afternoon) using drip irrigation. The amount and discharge of water from every emitter of the drip irrigation to each crop was measured and calibrated by taking three dripper points (at the initial, middle and end) of each lateral using graduated beaker and stopwatch. The amount of water applied to refill the required depleted moisture was given to the crop during the time of irrigation.
2.4. Data Collection and Analysis
2.4.1. Soil Sampling and Analysis
Prior seedling transplanting and postharvest representative soil samples were taken from the experimental field of 0-30 cm soil depth using auger for the determination of physical and chemical properties of the selected soil which include; soil texture, organic matter, pH, EC, total N, available P, available K and available Ca. Texture (particle size distribution) was determined using the Bouyoucos hydrometer method [35]. Soil pH was determined in a suspension of 1:2.5 soil water ratios by using pH meter [36, 37]. Total N Determination was done by macro Kjeldahl method [38]. Organic matter content of the soil was estimated from the organic carbon content determined using Walkley and Black [39] method. To obtain the percentage of soil organic matter, percentage of organic carbon was multiplied by 1.724 since the organic matter is conventionally assumed to contain 58% carbon [40].
2.4.2. Agronomic Data Collection
Ten plants were randomly taken from the middle rows of the experimental plots to collect data on plant height, branch number, fruit length and fruit diameter. Data on plant height (cm) and branch number were recorded during the last fruit harvest and their average values were considered for further statistical analysis. Fruit diameter and length were measured using digital caliper at each harvesting time and their average values were considered for further analysis. Whereas, the total weight of fresh tomato yield was measured from the net plot size of 4 m2 using electronic sensitive balance, later converted to mega gram per hectare.
2.4.3. Data Analysis
Climate data for the years 2017 and 2018 were obtained from Ethiopian Meteorological Agency, Mekelle branch [31]. Maximum temperature, minimum temperature, rainfall, sunshine hour, relative humidity and wind speed were collected. Climate data was imported to AquaCrop model, and reference Evapotranspiration (ETo) was computed after setting appropriate datasets based on the model climate data requirement. The collected data from every plot were initially checked for their normality and they were subjected to Analysis of Variance (ANOVA) procedures suitable to Split-Plot Design using SAS statistical software. Mean separation was done by Tukay’s HSD at 5% significance level.
2.4.4. Water Use Efficiency (WUE) and Nitrogen Use Efficiencies (NUE) Determinations
The evaluation of NUE in agriculture is an important way to evaluate the density of N applied and its role in yield, and hence, Partial Factor Productivity (PFP) and Agronomic Efficiency (AE) are among the most important nitrogen use efficiency indicators [41]. PFP is a broad measure of the efficiency of yield obtained in relation to the N rate used, and is calculated as the yield divided by the N applied and has the units of kg yield/kg N (Equations 2). AE is direct measure of the response of the N applied after removing the impact of the soil-supplied N, and is calculated from the yield with N applied minus the yield with nil N divided by the N rate applied (Equation 3). PFP is a measure of the efficiency of input use, whereas AE measures the change in yield in response to a change in N application level. Common water and NUE measurements and calculations were performed based on the formula written by Dobermann [42] and Qin et al. [43] (Equation 4).
 |
(2) |
 |
(3) |
 |
(4) |
3. RESULTS AND DISCUSSION
3.1. Prior Planting Soil Properties of the Study Area
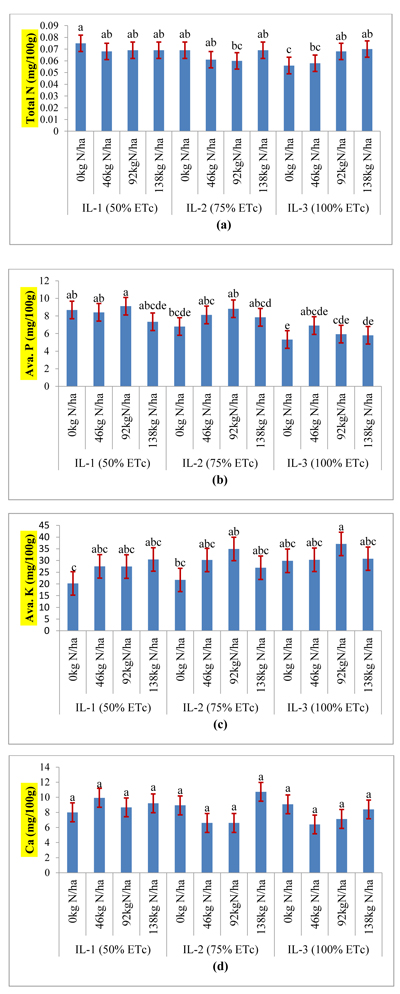
According to the soil map of FAO/UNESCO [44], soil type of the study area is vertisol with relatively neutral soil pH (7.5) and low EC (0.864) level. Generally, the soil of the study site had low organic matter content (0.873%), total N (0.086%), available P (6.613 ppm), available K (40.1 ppm) and exchangeable Ca (8.4 cmol(+)/kg). The low fertility level of the study area might be possibly due to the continuous cultivation of cereal crops. As indicated in Fig. (1), postharvest total N, available P and exchangeable Ca contents of the treatments did not show much variation with the baseline soil fertility status of the experimental site. Similar results were reported by Haftamu et al. [45] and Abay et al. [46]. While postharvest available K had decreased.
3.2. Residual Effects of Irrigation Water and Nitrogen Fertilizer Rates on Nutritional Properties of the Soil
Girmay et al. [47] reported that nitrogen fertilizer improves crop performance but significant residual effect might not be expected due to their soluble characteristics under favorable moisture conditions. Conversely, in this experiment, there was a statistically significant residual effect of irrigation water and nitrogen fertilizer rates on total N (Fig. 1a). This might be due to the improved water use efficiency of drip irrigation, as it could decrease the leaching of nutrients.
Moreover, irrigation water and nitrogen fertilizer levels have markedly influenced nutrient residues (available P and K), unlike exchangeable Ca which showed non-significant variation (Fig. 1b-d). Significantly lower total N, available P and available K were recorded from plots treated with no fertilizer application level in all the three irrigation levels. While there was non-significant difference with the other fertilizer levels, relatively higher nutrient residues were recorded from the treatments having higher fertilizer rates (Fig. 1).
| Treatment | Plant Height (cm) | Branch Nº | Fruit Diameter (mm) |
Fruit Length (mm) |
No. of Healthy Fruits/m2 |
Fresh Yield (Mg/ha) |
|
|---|---|---|---|---|---|---|---|
| IL-1 (50% ETc) | 0 kg N/ha | 40.03f | 6.33cd | 44.43c | 60.27b | 347.20b | 13.70b |
| 46 kg N/ha | 43.47ef | 6.53c | 48.27bc | 65.65ab | 432.80ab | 16.93ab | |
| 92 kgN/ha | 47.77cd | 7.47ab | 52.05ab | 69.65ab | 547.20ab | 22.93ab | |
| 138 kg N/ha | 51.90ab | 6.87bc | 48.43bc | 65.77ab | 425.60ab | 18.60ab | |
| IL-2 (75% ETc) | 0 kg N/ha | 41.43f | 6.47c | 48.93abc | 64.37ab | 364.80b | 18.70ab |
| 46 kg N/ha | 46.57de | 6.93bc | 53.37ab | 68.77ab | 446.40ab | 21.90ab | |
| 92 kgN/ha | 50.67abc | 7.60ab | 56.10b | 71.60a | 630.40a | 29.90a | |
| 138 kg N/ha | 53.07a | 7.67ab | 51.68abc | 65.80ab | 478.40ab | 24.27ab | |
| IL-3 (100% ETc) | 0 kg N/ha | 39.93f | 5.53d | 47.25bc | 62.40ab | 362.20b | 15.07ab |
| 46 kg N/ha | 48.00bcd | 6.93bc | 50.97abc | 66.07ab | 438.40ab | 19.27ab | |
| 92 kgN/ha | 52.83a | 8.27a | 53.98ab | 70.08ab | 545.60ab | 25.57ab | |
| 138 kg N/ha | 51.33abc | 7.60ab | 50.82abc | 65.95ab | 448.00ab | 20.80ab | |
3.3. Effect of Irrigation and Nitrogen Fertilizer Levels on Growth and Yield of Tomato
The result of the present study indicated that tomato growth and yield parameters have noticeably been influenced by the interaction of irrigation water and nitrogen fertilizer levels (Table 1). The highest tomato plant height (53.07 cm) was obtained from moderate irrigation level (75% ETc) interacted with the highest fertilizer application rate (138 kg N/ha). Significantly highest branch number was measured from plots treated with moderate (75% ETc) to full (100% ETc) irrigation level at a nitrogen fertilizer application rate of 92-138 kg/ha (Table 1).
Highest fruit diameter (56.10 mm), fruit length (71.60 mm), number of healthy fruits/m2 (630.40) and fresh yield (29.90 Mg/ha) were recorded from plots treated with moderate irrigation (75% ETc) combined with 92 kg/ha nitrogen fertilizer application level. In line with the present study, Wang and Xing [48] reported higher tomato yield at moderate irrigation (75% ETc) interacted with a high fertilizer level (240 kg N/ha). However, the lowest fruit diameter (44.43 mm), fruit length (60.27 mm), number of healthy fruits (347.20) and fresh yield (13.70 Mg/ha) were recorded from plots treated with no nitrogen fertilizer application under the irrigation level (50% ETc). Regardless of the irrigation level, the lowest tomato growth and yield were recorded from the non fertilized treatments. This indicates that, tomato was more influenced by nitrogen fertilizer application rate than irrigation water levels. This implies that, under irrigation water level ranging from 50-100% ETc, N uptake rate could be limited by the lower amount of N in the plant root zone.
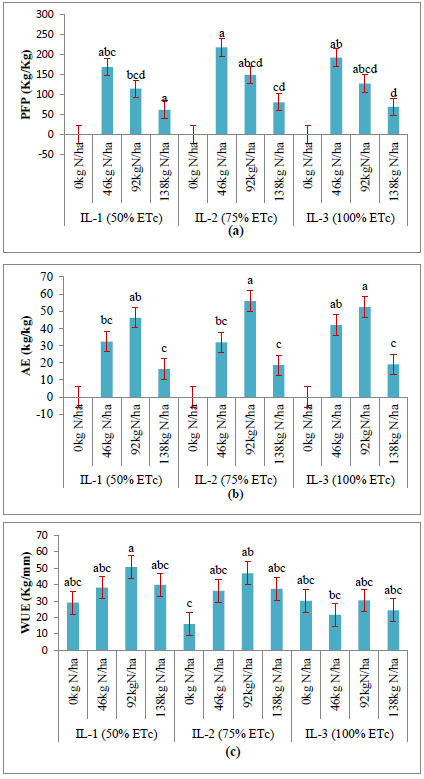
3.4. Partial Factor Productivity (PFP), Agronomic Efficiency (AE), Water Use Efficiency (WUE) as Influenced by Irrigation Water and Nitrogen Fertilizer Levels
AE, PFP and WUE were evaluated at different irrigation water and nitrogen fertilizer levels and the significant effect was found at 5% probability level (Fig. 2). These results were consistent with previous findings [10, 17, 18]. In the current study, regardless of the irrigation level, higher AE (56+7.61 kg/kg) was recorded on tomatoes irrigated with 75% ETc (moderate level) combined with the application of 92 kg N/ha. This result was followed by 52.5+3.17 kg/kg recorded from fully irrigated (100% ETc) treatments fertilized with 92 kg N/ha (Fig. 2b). On the other hand, relatively highest PFP of 219+27.30 kg/kg and 192.67+20.26 kg/kg was recorded on tomatoes cultivated under moderate (75% ETc) and full (100% ETc) irrigation levels combined with 46 kg N/ha, respectively (Fig. 2a). This implies that, AE and PFP were strongly influenced by nitrogen fertilizer application level. This result was in conformity with the result reported by Wang and Xing [48].
Likewise, WUE was strongly affected by irrigation water and nitrogen fertilizer levels (Fig. 2c). Optimum water use efficiencies of 50.88+3.51 kg/mm and 47.02+1.60 kg/mm were recorded on tomato grown under low (50% ETc) and moderate (75% ETc) irrigation levels combined with 92 kg N/ha application, respectively. Lowest water use efficiency was recorded while tomato was cultivated without fertilizer application in all the irrigation levels. Amiri et al. [49], reported that higher water use efficiency was recorded when egg plant was treated with 120 kg/ha nitrogen fertilizer.
CONCLUSION
Irrigation water and nitrogen fertilizer levels markedly influenced the growth and yield performance of tomato, nutrient residue, Agronomic Efficiency (AE), Partial Factor Productivity (PFP) and Water Use Efficiency (WUE). In the present study, N level was a more influential factor than the irrigation levels for tomato growth and yield performance, AE, PFP, and WUE. Moderate irrigation (75% ETc) and fertilization (92 kg N/ha) scored the highest tomato growth and yield performance. Besides, optimum nutrient and water use efficiencies were recorded when tomato was cultivated using 92 kg N/ha application rate with different irrigation water levels. However, PFP was the highest on plots treated with 46 kg N/ha application rate at all the irrigation water levels of this experiment. Generally, better combinations of water and nitrogen fertilizer rates for higher tomato growth and yield attributes as well as for efficient water and nitrogen fertilizer application were, moderate irrigation (75% ETc) combined with 92 kg N/ha nitrogen fertilizer application. Results from this study could help tomato producers to adopt better nitrogen and irrigation water integrations.
AUTHOR CONTRIBUTIONS
Teklay Tesfay designed field experiment, conducted data analysis, prepared manuscript and overall project supervision. Abadi Berhane assisted data analysis and manuscript review. Field data collection and manuscript review was principally conducted by Mebrahtu Gebremariam.
ETHICS APPROVAL AND CONSENT TO PARTICIPATE
Not applicable.
HUMAN AND ANIMAL RIGHTS
Not applicable.
CONSENT FOR PUBLICATION
Not applicable.
AVAILABILITY OF DATA AND MATERIALS
Data collected were subjected to statistical Analysis of variance (ANOVA) using SAS Software.
FUNDING
None.
CONFLICTS OF INTEREST
The authors declare no conflict of interest, financial or otherwise.
ACKNOWLEDGEMENTS
The authors express their sincere gratitude to Aksum University for the full financial funding and for the provision of the experimental field at Aksum University Selekleka Research and Technology Transfer Center to carry out this trial.

