All published articles of this journal are available on ScienceDirect.

Agricultural Aid Allocations of Korea in Five sub-Saharan Countries: Aid Policy Implications for Agriculture-Rural Development
Abstract
Background:
The Official Development Assistance, or ODA has been an invaluable source to assist developing countries in their economic and social development. Of the major ODA donors, the Republic of Korea (Korea) became a significant player in ODA and a role model. Providing its ODA, Korea designates the priority partner countries to which 70% of Korean bilateral ODA is allocated and formulates a country partnership strategy for each priority partner country.
Objective:
This study focuses on five sub-Saharan countries that were designated as Korea’s priority partner countries during the period of 2011-2020 and takes a detailed look at Korea’s ODA to their Agriculture and Rural Development (ARD) during the same period. With the five countries and ARD, this study intends to examine a hypothesis; the worse its food security and agricultural development was at a national level, the larger Korea’s ARD aid the country received.
Methods:
To test the hypothesis, data collected from World Bank, Global Hunger Index Reports and Korea ODA Statistics are sorted and analyzed. Then comparisons are made between Korea’s grant disbursements to ARD and the status of food security of the five African countries: Ethiopia, Ghana, Mozambique, Rwanda, and Uganda.
Results:
Results from the data indicate that there seems little consistency between the status of agriculture and food security of the five African countries and the allocated amounts of Korean ARD grants.
Conclusion:
Therefore, selection criteria for ARD grant allocation should exist and policy suggestions are made for Korea to formulate more consistent and systemic strategies for ARD support in sub-Saharan countries.
1. INTRODUCTION
The Organisation for Economic Co-operation and Deve- lopment (OECD) Development Assistance Committee (DAC) defines official development assistance or ODA as government aid that promotes and specifically targets the economic development and welfare of the developing countries [1]. Currently, there are 30 OECD DAC members which are major ODA donors. Of the 30 members, the Republic of Korea (hereafter Korea) stands out since the country effectively transformed itself from an aid recipient to donor. In 2018, Korea ranked 16th in terms of the ODA quantity among the DAC members, and 26th for its ODA to GNI (gross national income) ratio [2].
Korea provides its ODA from two separate channels; its grants-based ODA is largely executed by the Korea International Cooperation Agency (KOICA) under the Ministry of Foreign Affairs whereas its concessional loans are provided by the Economic Development Cooperation Fund (EDCF) under the Ministry of Economy and Finance [2]. This fragmentation of the ODA channel has often been criticized for the structural complexity of its ODA approval process and administrative multilayers that lead to high transaction costs and inefficiency [3]. For more effective and systematic ODA, the Korean government enacted the Framework Act on International Development Cooperation (hereafter Framework Act) in 2010. The purpose of the Framework Act is to define basic principles and objectives of Korean ODA, specify roles and functions of relevant ministries and agencies, and formulate the mid-term strategy for development cooperation (hereafter mid-term strategy) [4].
The mid-term strategy sets five-year ODA policies and strategic directions of Korean ODA. Also, an annual ODA implementation plan is guided by the mid-term strategy [4]. Importantly, the mid-term strategy releases priority partner countries to which the Korean government allocates approximately 70% of bilateral grants [2]. Thus, the selection of priority partner countries is crucial for both Korea and its recipient countries.
Before 2010, the list of priority partner countries was separately released for grants and concessional loans, with little clarification on selection criteria. In 2010, however, the Korean government disclosed its first integrated list of priority partner countries applicable to both grants and concessional loans. For the selection of the countries, a study [5] summarized the process and assessment factors (Table 1). In short, first, the income factor was exclusively screened for aid needs; second, three factors-relationships to Korea, international aid criteria and aid effectiveness were considered with different weights; finally, qualitative factors were evaluated for the final decision. Although not specified, the qualitative factors were likely to reflect the political and economic interests of Korea such as geopolitical alliances and export markets.
Nevertheless, the Korean government repeatedly faces criticism against its selection process. An example is that the screening factors are generally too vague. Thus, this can be a source of strategic inconsistencies in Korean ODA that may result in a gap between selection itself and actual ODA allocation [5].
For each selected country, a Country Partnership Strategy (CPS) or formerly known as country assistance strategy is formulated for more customized ODA support. The CPS is to align the priority partner country’s development goals, needs and demands with Korean ODA policies. Also, the CPS designates core sectors tailored to each recipient under Korea’s ‘Select and Focus’ strategy [2]. The core sector selection considers Korea’s competitive advantage and United Nations’ development goals as well as the local needs of the recipient. These core sectors include education, governance, Agriculture and Rural Development (ARD), health and sanitation, energy, transportation and ICT [2].
Geographically, Korean ODA mainly targets two strategic regions, Asia and Africa. According to the 2019 annual ODA planning, Asia receives 39% of Korean ODA, increased from the previous year’s 37% while Africa receives 20.6% also increased from 18.3% [2]. As such, Asia and Africa include the majority of Korea’s priority partner countries. The 2011-2015 mid-term strategy released 26 priority partner countries, which consisted of 11 Asian countries and eight African ones. Moreover, the 2016-2020 mid-term strategy included 24, of which 11 were in Asia and seven in Africa [2].
As the Korean government increasingly recognizes the importance of Africa to achieve its development goals as an essential strategic partner, this study mainly focuses on Africa. Additionally, a similar study was conducted in Asia [6]. Of the eight sub-Saharan countries for 2011-2015 and seven for 2016-2020, five were repeatedly selected (Table 2) [7,8]; Ethiopia, Ghana, Mozambique, Rwanda and Uganda. These five countries are the subject of this study because they could offer a deeper insight into the Korean ODA in Africa and a clue about the consistency or inconsistency of its ODA strategy.
In addition to the five sub-Saharan countries, the focus sector of this study is ARD, one of the core sectors of Korean ODA.
Table 1.
| Step | Selection Factors | Consideration Specifics | Weight (%) |
|---|---|---|---|
| 1 | Aid needs | Income level | 100 |
| 2 | Relationship to Korea | Diplomatic and economic factors | 55 |
| International aid criteria | Human development index, income level etc. | 30 | |
| Aid effectiveness | Governance of recipient country, presence of Korean embassy and aid agency office, number of Koreans in the country etc. | 15 | |
| 3 and 4 | Overall qualitative evaluation | - | - |
| Source: Modified from [5] | |||
At the global level, food security has remained a top priority in the donor community for many decades as an essential component of human development [9]. Despite the progress in alleviating food insecurity for the poorest and most vulnerable, sub-Saharan Africa continues to account for a large share of the affected; 23.2% of the people remained undernourished in 2017, which deteriorated from 20.7% in 2014 [9, 10]. Therefore, improving food security in sub-Saharan Africa is one of the challenges on the development agenda of the global community [11]. At the same time, approximately 70% of the extremely poor in sub-Saharan Africa live in rural areas, and agriculture is their main source of income and development [9, 12].
For this reason, many donors including Korea consider a push for agricultural development an effective tool for food security, poverty reduction and sustainable development [12]. In addition, when agriculture requires long-term investment and few sub-Saharan governments have sufficient means in doing so, donor assistance becomes vital in financing agricultural sectors [11]. Therefore, supporting ARD is important for the policy dialog of both the recipient countries and donors [12].
Specifically, with the five countries and ARD, the current study started with a question; which countries received the most and least Korean ODA for their ARD and what might have been the reasons for it? This question was rephrased in the study hypothesis; if the food security and agricultural development did not meet the standards at a national level, the country received a larger Korean ARD grant during the study period.
To examine the hypothesis, this study used the grants through KOICA excluding EDCF concessional loans since concessional loans are more complicated and selective due to their political and economic terms between a recipient and donor. Besides, a strategic direction of EDCF is geared towards the construction of socioeconomic infrastructure [13]. The study period to examine the hypothesis was set from 2011 to 2017, covering the first mid-term strategy of 2011-2015 and part of the second of 2016-2020. This type of study is very relevant to draw useful implications of the current Korean ODA because any meaningful results can be referred to for the coming mid-term strategy in ARD-relevant assistance.
2. MATERIALS AND METHODS
To examine the hypothesis, relevant indicators of agriculture-food security were chosen to estimate and compare the national status of agriculture and food security across the five countries; Ethiopia, Ghana, Mozambique, Rwanda and Uganda. For the agriculture relevant indicators, four were chosen; rural populations, portions of rural populations, agricultural contribution to GDP, and employment in agriculture. They were used as a proxy measure for agricultural and rural situations of the country. Secondly, for food security, two were chosen; prevalence of Undernourishment (PoU) and Global Hunger Index (GHI). Given the broad scope of food security, its accurate measure is characteristically difficult. Instead, the global community relies on proxy measures to capture part of food security, and PoU and GHI are some of the most frequently utilized indicators. The definition and relevance to the development of the indicators are summarized (Table 3).
| Proxy Indicators | Definition and ARD Relevance | Source | |
|---|---|---|---|
| Agriculture | Rural population | (Definition) The rural population refers to people living in rural areas as defined by national statistical offices. It is calculated as the difference between total population and urban population. (ARD relevance) The rural population and its density are important for analyzing economic behaviors and appropriate development interventions. In the development process, workers tend to migrate from rural to urban areas. |
World Bank # |
| A portion of rural population (%) | |||
| Agriculture, forestry, and fishing, value added as % of GDP |
(Definition) Agricultural value added is the net output of the agriculture sector, including forestry, hunting and fishing, and cultivation of crops and livestock production #. (ARD relevance) It indicates this sector’s economic share, contribution and investment to better understand the structural changes and trends over time in different countries and regions  . . |
World Bank # FAO
|
|
| Employment in agriculture | (Definition) Employment is defined as people of working age who are engaged in any activity to produce goods or provide services for pay or profit. The agriculture sector consists of activities in agriculture, hunting, forestry and fishing. (ARD relevance) This information is particularly useful in identifying stages of development in a country. Labor tends to flow from agriculture and other labor-intensive primary activities to the industry and services sector. |
World Bank # | |
| Food security | Prevalence of undernourishment | (Definition) It estimates the percentage of the population whose food intake measured in calories continues being insufficient to meet dietary energy requirements. (ARD relevance) Nutrition is key to survival, health and development. Well-nourished people can perform better and be on firmer developmental paths, both physically and mentally. |
World Ban k# |
| Global hunger index | (Definition) It is a 0-100 scale in hunger severity and calculated with PoU, child stunting, child wasting and child mortality. GHI emphasizes the factors in children under the age of five. (ARD relevance) Tracking national and regional hunger helps compare levels of hunger severity among countries and raises awareness to provide means for alleviating serious situations. |
IFPRI § | |
| ODA Data | Definition and ARD Relevance | Source | |
| Grants | (Definition) Grants are transfers made in cash, goods or services for which no repayment is required. Data are disbursements rather than commitments executed by KOICA through bilateral channels. (ARD relevance) ARD grants support projects, technical cooperation, budget, food aid etc. They help improve from agricultural productivity, technical capacity, agricultural value chain, income to food security. |
OECD DAC * KOICA ¶ |
|
| Source: # World Bank (https://data.worldbank.org/indicator?tab=all); FAO-Global trends in GDP and Agriculture Value Added (1970-2013); § IFPRI (https://www.globalhungerindex.org/); * OECD DAC (https://www.oecd.org/dac/stats/dac-glossary.htm#Grant); ¶ KOICA Annual Reports (https://www.koica.go.kr/koica_en/3492/subview.do) |
|||
The data of KOICA grants were used to identify overall trends of ARD grant allocations and amounts each country received. Finally, the allocation profiles of the five countries were related to the proxy agriculture-food security indicators.
Data sources for the proxy indicators and KOICA ARD grants were the World Bank, Global Hunger Index Reports and KOICA Annual Statistical Reports (Table 3). From the World Bank, the rural populations, portions of rural populations, agriculture-forestry-fishing value were added as % of GDP, and employment in agriculture was collected during the period of 2009-2017. Then the data of the indicators were organized for yearly trends and averages. From the KOICA Annual Statistical Reports, ARD disbursements from 2011 to 2017 were collected for the annual and total ARD disbursements for each country.
It should be mentioned that there is a two-year extension for the indicators data, in comparison to the KOICA data: 2009-2017 vs. 2011-2017, respectively. The reason for the time extension is that many Korean ODA programs have a two-year difference between the identification of potential projects and their actual implementation. Many of the ARD programs, thus, were likely identified two years before their implementation, probably reflecting the situation of the near past. Therefore, the data for the indicators included the two previous years, 2009 and 2010.
3. RESULTS
3.1. Identification of Select Core Sectors in Five Countries
First of all, it is meaningful to identify the designated core sectors across the five countries as it reveals the level of importance of ARD weighed by Korea.
The core sectors for the five countries generally consisted of three to four sectors among ARD, education, energy, health/water management and sanitation, ICT, and transport (Table 4). In a combination of the five countries and two selections, education was included nine times followed by ARD with eight times. It seemed well in line with Korea’s consistent emphasis on education across its ODA programs [2].
The core sectors for both periods stayed the same in Ethiopia and Rwanda, while Uganda showed a noticeable shift from economic infrastructure and ICT in 2011-2015 to education, and health and sanitation in 2016-2020 (Table 4) [14-23]. The CPS of Uganda stated that this change was made, considering Uganda’s National Development Plan and Korea’s comparative advantage in agriculture, education, and health [23]. Also, the Korean government might have considered that the size of available Korean ODA to Uganda was less likely to produce meaningful impacts on Uganda’s economic infrastructure in five years.
For ARD, it was designated a core sector in Ethiopia, Rwanda and Uganda for both selection periods. On the other hand, it was excluded in Mozambique and newly included in Ghana for 2016-2020. ARD will be further examined in detail in the following section.
Although the core sectors weighed heavily more than others under Korea’s ‘Select and Focus’ ODA policy, it did not indicate that other non-core sectors would not receive ODA grants from the Korean government. For instance, ARD was not included in Ghana for 2011-2015. Yet, during that period, approximately 11% of KOICA grants to Ghana were disbursed to ARD [20]. Not common though, being a core sector did not guarantee a large ODA grant, either. For instance, the energy sector in Ghana received only 2.4% of the total grants for 2011-2015 [20]. Another such example was Mozambique; ARD as a core sector for 2011-2015 received 5% of the total grants [21]. In Mozambique’s ARD case, the Korean document stated the reason; there was inconsistency in ARD policies between the two countries, and subsequently, it delayed administrative cooperation for identifying feasible ARD projects and support mechanisms [21].
| Country | Core Sectors Specified in Country Partnership Strategy | |
|---|---|---|
| First selection for 2011-2015 | Second selection for 2016-2020 | |
| Ethiopia | Health and sanitation, Agriculture and rural development, Education, Economic infrastructure | Health and sanitation, Agriculture and rural Development, Education, Transport and Energy |
| Ghana | Energy, Health and sanitation, Education | Energy, Health and sanitation, Education, Agriculture and rural development |
| Mozambique | Transport, Energy, Agriculture and rural development, Education | Transport, Energy, Water management and health, Education |
| Rwanda | ICT, Education, Agriculture and rural development | ICT, Education, Agriculture and rural development |
| Uganda | Economic infrastructure, Agriculture and rural development, ICT | Agriculture and rural development, Education, Health and sanitation |
| Source: Government of Republic of Korea (GOR), 2012; GOR 2017 for Ethiopia, Ghana, Mozambique, Rwanda and Uganda [14-23] | ||
Overall, under some circumstances, there existed a discrepancy between core-sector designation and actual allocation of ODA grants.
3.2. KOICA’s Grants to Agriculture and Rural Development across Five Countries
In this section, KOICA grant allocations to ARD were examined in detail across the five countries for 2011-2017.
First of all, the total amount of KOICA disbursement increased by approximately 37.8% between 2011 and 2017 (Table 5). This was well-expected since Korea gradually increased the size of its total ODA to meet the international demand as a member of OECD DAC. For the agricultural sector, ARD’s total budget also showed an increase from 9.5% of the total KOICA budget in 2011 to 14.3% in 2017, averaged 13.6%. Of the total ARD disbursement, the share to Africa somewhat fluctuated; it sharply increased up to 38.9% in 2014, then decreased afterwards to 24% in 2017, and averaged 30.5% of the total ARD disbursement (Table 5).
Of all ARD support to Africa (C in Table 5), the total ARD grants that these five countries received ranged from 28.7% in 2011 up to 54.7% in 2017 (Table 6). This indicated a high concentration of ARD grants on the priority partner countries, given that ARD grants were allocated to about 30 African countries. Especially in 2017, Korea supported 27 African countries for their ARD, yet these five countries received more than half of the total ARD grants allocated to Africa [24].
Of the five, Uganda received the largest ARD grant on average whereas Mozambique received the smallest (Table 6). Notably, in 2014 and 2015, Rwanda received over six times larger ARD grants than that in 2011. This was likely from the fact that Rwanda became the 10th top recipient of KOICA grants in 2014 and 2015; 3.1% of the total KOICA grant was allocated to Rwanda for both years [25, 26]. Rwanda also received the largest ARD grants in Africa in 2014 and 2015; 18.2% and 21.5% that of total African ARD grants, respectively [25, 26]. However, afterwards, the ARD grants to Rwanda sharply decreased (Table 6). Mozambique received the smallest and on average it was only 8.3% of Uganda. The ARD grants to Mozambique were even significantly decreased in 2016 and 2017 (Table 6). In fact, this small support was in line with Korea’s CPS for Mozambique; ARD was not a core sector for 2016-2020. However, Ghana received comparatively good amounts of ARD grants in 2012, 2013 and 2014 while ARD was not included as the core sector (Table 6).
| Grant-Year | 2011 | 2012 | 2013 | 2014 | 2014 | 2016 | 2017 | Avg. | |||||||
|---|---|---|---|---|---|---|---|---|---|---|---|---|---|---|---|
| Amount | % | Amount | % | Amount | % | Amount | % | Amount | % | Amount | % | Amount | % | - | |
| KOICA Total: A | 408,056 | - | 445,277 | - | 477,585 | - | 551,296 | - | 563,250 | - | 551,863 | - | 562,205 | - | - |
| ARD Total: B (% = B/A*100) |
38,781 | 9.5 | 57,941 | 13.0 | 66,057 | 13.8 | 80,986 | 14.7 | 82,890 | 14.7 | 82,765 | 15.0 | 80,580 | 14.3 | 13.6 |
| Africa ARD: C (% = C/B*100) |
10,791 | 27.8 | 16,727 | 28.9 | 21,729 | 32.9 | 31,518 | 38.9 | 29,057 | 35.1 | 21,217 | 25.6 | 19,352 | 24.0 | 30.5 |
| Country-Year | 2011 | 2012 | 2013 | 2014 | 2015 | 2016 | 2017 | Average | % compared to Uganda |
|---|---|---|---|---|---|---|---|---|---|
| Ethiopia | 1135 | 1937 | 2292 | 3881 | 3191 | 1538 | 3636 | 2515.7 | 81.1 |
| Ghana | 302 | 1322 | 1860 | 1725 | 507 | 1099 | 777 | 1084.6 | 35.0 |
| Mozambique | 266 | 265 | 369 | 586 | 218 | 49 | 43 | 256.6 | 8.3 |
| Rwanda | 943 | 1546 | 1956 | 5746 | 6243 | 1958 | 1699 | 2870.1 | 92.5 |
| Uganda | 456 | 833 | 4202 | 3946 | 2389 | 5456 | 4433 | 3102.1 | 100.0 |
| Five Country Total: A | 3102 | 5903 | 10679 | 15884 | 12548 | 10100 | 10588 | - | - |
| Africa ARD Total: B | 10791 | 16727 | 21729 | 31518 | 29057 | 21217 | 19352 | - | - |
| % of five Country: C (C = A/B*100) |
28.7 | 35.3 | 49.1 | 50.4 | 43.2 | 47.6 | 54.7 | - | - |
| Source: KOICA Statistics Annual Reports | |||||||||
3.3. Analysis of Food-Agriculture-Relevant Indicators for Five Countries
In this section, food-agriculture-relevant indicators were examined in order to relate KOICA ARD grant allocations to the agriculture-food security situation of the five countries. First, for the rural population, Ethiopia had the largest rural population, distantly followed by Uganda (Table 7). It was well-expected as Ethiopia is the second-most populous country in Africa after Nigeria [27]. On the other hand, Rwanda was the least rural-populous among the five countries. For proportions of the rural population, they ranged from 47.3% to 83% (Table 8). Rwanda with the smallest rural population had the highest proportion averaged 83% followed by Ethiopia. Ghana showed the lowest proportion of the rural population compared to other countries, 47.3% on average (Table 8).
Second, for agriculture’s contribution to GDP as % of GDP, Ethiopia was noticeably higher among the five countries, 39.7% on average although it actually decreased from 45.9% in 2009 to 34% in 2017 (Table 9). The agricultural contribution to GDP of the other four countries ranged from 22.9% in Ghana to 29% in Rwanda on average. Overall, the agricultural contribution to GDP appeared somewhat similar to their proportion of the rural population (Table 9).
| Country-Year | 2009 | 2010 | 2011 | 2012 | 2013 | 2014 | 2015 | 2016 | 2017 | Average |
|---|---|---|---|---|---|---|---|---|---|---|
| Ethiopia | 7097.24 | 7251.34 | 7407.70 | 7565.63 | 7726.23 | 7886.90 | 8046.97 | 8205.98 | 8364.06 | 7728.01 |
| Ghana | 1194.45 | 1208.13 | 1221.07 | 1233.31 | 1244.91 | 1255.94 | 1266.44 | 1276.38 | 1285.78 | 1242.93 |
| Mozambique | 1615.44 | 1651.17 | 1687.47 | 1724.29 | 1761.59 | 1799.34 | 1837.50 | 1876.05 | 1914.97 | 1763.09 |
| Rwanda | 828.83 | 851.16 | 873.49 | 896.09 | 918.99 | 942.04 | 965.21 | 988.49 | 1011.77 | 919.56 |
| Uganda | 2658.52 | 2734.14 | 2811.07 | 2889.15 | 2968.32 | 3048.26 | 3128.89 | 3210.17 | 3292.05 | 2971.17 |
| Source: World Bank-Rural population | ||||||||||
| Country-Year | 2009 | 2010 | 2011 | 2012 | 2013 | 2014 | 2015 | 2016 | 2017 | Average | Rank |
|---|---|---|---|---|---|---|---|---|---|---|---|
| Ethiopia | 83.1 | 82.7 | 82.3 | 81.8 | 81.4 | 81.0 | 80.6 | 80.1 | 79.7 | 81.4 | 4 |
| Ghana | 50.0 | 49.3 | 48.6 | 47.9 | 47.3 | 46.6 | 45.9 | 45.3 | 44.6 | 47.3 | 1 (lowest) |
| Mozambique | 68.7 | 68.2 | 67.7 | 67.2 | 66.6 | 66.1 | 65.6 | 65.1 | 64.5 | 66.6 | 2 |
| Rwanda | 83.1 | 83.1 | 83.1 | 83.1 | 83.1 | 83.0 | 83.0 | 82.9 | 82.9 | 83.0 | 5 (highest) |
| Uganda | 81.1 | 80.6 | 80.1 | 79.6 | 79.0 | 78.5 | 77.9 | 77.4 | 76.8 | 79.0 | 3 |
| Source: World Bank-Portion of rural population (%) | |||||||||||
| Country-Year | 2009 | 2010 | 2011 | 2012 | 2013 | 2014 | 2015 | 2016 | 2017 | Average | Rank | % Rural Population Rank |
|---|---|---|---|---|---|---|---|---|---|---|---|---|
| Ethiopia | 45.9 | 41.4 | 41.2 | 44.3 | 41.2 | 38.5 | 36.1 | 34.8 | 34.0 | 39.7 | 5 (highest) |
4 |
| Ghana | 31.0 | 28.0 | 23.7 | 22.1 | 20.5 | 20.0 | 20.2 | 21.0 | 19.7 | 22.9 | 1 (lowest) |
1 (lowest) |
| Mozambique | 27.9 | 27.3 | 26.3 | 25.2 | 24.1 | 22.8 | 22.9 | 22.6 | 21.3 | 24.5 | 2 | 2 |
| Rwanda | 29.3 | 28.2 | 28.2 | 29.2 | 28.9 | 28.8 | 28.0 | 29.3 | 31.0 | 29.0 | 4 | 5 (highest) |
| Uganda | 26.1 | 26.2 | 25.1 | 26.1 | 25.5 | 25.1 | 24.0 | 23.7 | 24.6 | 25.1 | 3 | 3 |
| Source: World Bank-Agriculture, forestry, and fishing, value added (% of GDP) | ||||||||||||
| Country-Year | 2007 | 2008 | 2009 | 2010 | 2011 | 2012 | 2013 | 2014 | 2015 | 2016 | 2017 | Average | Rank |
|---|---|---|---|---|---|---|---|---|---|---|---|---|---|
| Ethiopia | 76.6 | 75.9 | 75.3 | 73.9 | 72.8 | 72.3 | 71.0 | 70.0 | 68.9 | 68.0 | 67.1 | 72.0 | 3 |
| Ghana | 53.7 | 52.5 | 51.4 | 49.9 | 48.4 | 46.8 | 45.4 | 40.4 | 35.2 | 34.7 | 34.3 | 44.8 | 1 (lowest) |
| Mozambique | 78.3 | 77.8 | 77.3 | 76.6 | 75.7 | 74.9 | 73.9 | 73.0 | 72.1 | 72.0 | 71.9 | 74.9 | 5 (highest) |
| Rwanda | 78.6 | 77.8 | 77.6 | 77.3 | 77.0 | 76.6 | 73.0 | 68.5 | 67.6 | 67.5 | 67.1 | 73.5 | 4 |
| Uganda | 71.9 | 72.8 | 73.8 | 70.8 | 68.5 | 66.1 | 71.9 | 71.7 | 71.3 | 71.4 | 71.1 | 71.0 | 2 |
| Source: World Bank-Employment in agriculture (% of total employment, modeled International Labor Organization estimate) | |||||||||||||
Third, for employment in agriculture, the four countries except Ghana had agricultural employment rates over 70% on average (Table 10). Mozambique showed the highest agricultural employment rate on average, 74.9% closely followed by Rwanda. Overall, Ghana was the lowest in agricultural employment rate, 44.8% on average, which could be predicted from Ghana’s lowest proportion of the rural population and agricultural contribution to GDP (Table 8 and Table 9).
Fourth, as a measure of food security status, the prevalence of undernourishment was available up to 2016. Uganda showed the highest PoU, averaged 34.3%, closely followed by Rwanda, 33.9% (Table 11). Ghana was the lowest in PoU, 5.9% on average. Among the drastic shifts in PoUs during the study period, Ethiopia decreased its PoU from 33.7% in 2009 to 21.4% in 2016. On the contrary, Uganda increased its PoU from 30.4% in 2009 to 41.4% in 2016, indicating that Uganda’s food security, captured by PoU, was deteriorated over these years (Table 11).
Fifth, for the global hunger index [28], Ethiopia showed the highest average score, 29.7 followed by Mozambique with 25.7 (Table 12). Of the five countries, Ghana was the only country that did not fall into the GHI category ‘serious’ that ranges 20.0-29.9 in hunger severity. Instead, Ghana was categorized as ‘moderate’ although it was close to the category ‘low’ that ranges up to 9.9. In particular, GHI of Uganda continued increasing; between 2009 and 2017, it was more than doubled, indicating its status of hunger worsened. In addition, GHI of all five countries drastically increased between 2014 and 2015 and remained high in 2016 and 2017 (Table 12).
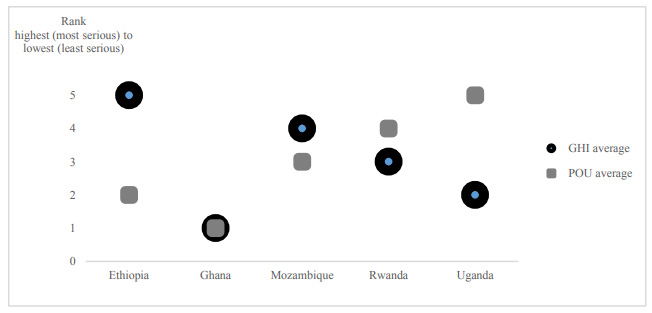
Both PoU and GHI are designed to measure the status of food security, yet their severity ranking was not very consistent except Ghana (Fig. 1). For instance, Uganda was the most serious in PoU but performed better in GHI although its GHI became worsened. On the contrary, Ethiopia was the most serious in GHI yet performed better in PoU.
This reversion in severity ranking is not impossible given the nature of the two indicators; PoU estimates food security in a general population while GHI substantially examines the child factors: stunting, wasting and mortality in children under the age of five. Therefore, when children suffer from food-nutrition deprivation more than the general population, GHI signals a higher level of hunger severity than PoU .
Table 11.
| Country-Year | 2009 | 2010 | 2011 | 2012 | 2013 | 2014 | 2015 | 2016 | Average | Rank |
|---|---|---|---|---|---|---|---|---|---|---|
| Ethiopia | 33.7 | 32.1 | 30.7 | 29 | 26.9 | 24.7 | 22.8 | 21.4 | 27.7 | 2 |
| Ghana | 5.6 | 5.3 | 5.5 | 5.9 | 6.3 | 6.4 | 6.3 | 6.1 | 5.9 | 1 (lowest) |
| Mozambique | 31.9 | 30 | 28.9 | 28.6 | 29.1 | 29.8 | 30.4 | 30.5 | 29.9 | 3 |
| Rwanda | 36.9 | 35 | 33.5 | 32.3 | 31.6 | 32.1 | 34 | 36.1 | 33.9 | 4 |
| Uganda | 30.4 | 30.9 | 31.6 | 32.4 | 33.7 | 35.5 | 38.6 | 41.4 | 34.3 | 5 (highest) |
| Source: World Bank-Prevalence of undernourishment | ||||||||||
| Country-Year | 2009 | 2010 | 2011 | 2012 | 2013 | 2014 | 2015 | 2016 | 2017 | Average | Rank |
|---|---|---|---|---|---|---|---|---|---|---|---|
| Ethiopia | 30.8 | 29.8 | 28.7 | 28.7 | 25.7 | 24.4 | 33.9 | 33.4 | 32.3 | 29.7 | 5 (highest) |
| Ghana | 11.5 | 10.0 | 8.7 | 8.9 | 8.2 | 7.8 | 15.5 | 13.9 | 16.2 | 11.2 | 1 (lowest) |
| Mozambique | 25.3 | 23.7 | 22.7 | 23.3 | 21.5 | 20.5 | 32.5 | 31.7 | 30.5 | 25.7 | 4 |
| Rwanda | 25.4 | 23.1 | 21.0 | 19.7 | 15.3 | 15.6 | 30.3 | 27.4 | 31.4 | 23.2 | 3 |
| Uganda | 14.8 | 15.0 | 16.7 | 16.1 | 19.2 | 17.0 | 27.6 | 26.4 | 32.0 | 20.5 | 2 |
| Source: International Food Policy Research Institute-Global hunger index | |||||||||||
This seemed like the case of Ethiopia and Uganda. The prevalence of stunting and wasting in Ethiopia was 44.2% in 2011 and 38.5% in 2016. On the other hand, that of Uganda was 33.7% in 2011 and 28.9% in 2016 [29]. It implied that Ugandan children were healthier than Ethiopian children, thus positively affecting Uganda’s GHI.
4. DISCUSSION
Although limited to the six ARD relevant indicators, the overall results did not appear to agree with the study hypothesis; if the food security and agricultural development did not meet the standards at a national level, the country received larger Korean ARD grant. In fact, there was little consistency among the indicators, and between the indicators and Korean ARD grant allocations across the five countries.
During the period of 2011-2017, Uganda received the largest ARD grants from KOICA and Mozambique received the least. The difference in their total amounts was as large as over 12 times. And, Ethiopia and Rwanda received comparable amounts of ARD grants, 81.1% and 92.5% to that of Uganda, respectively. This seemed aligned to Korea’s core sector selection; ARD was selected as a core sector for both periods in Ethiopia, Rwanda and Uganda. However, considering the agriculture-food security measures of Mozambique and Uganda, exclusion of Mozambique’s ARD for 2016-2020 and the smallest KOICA grants to its ARD was a curious case. For instance, agricultural contribution to GDP between Mozambique and Uganda was not very different, averaged 24.5% for Mozambique and 25.1% for Uganda. Additionally, the agricultural employment rate in Mozambique was the highest among the five, and the situation of food security in Mozambique was similar to that of Rwanda, which continued receiving large ARD grants from Korea.
Besides Mozambique, another curious case was Ghana because ARD was newly included as a core sector for 2016-2020. The proxy indicators of Ghana showed that the country appeared to be making a structural shift from an agricultural society to an industrial one. Moreover, Ghana performed best in food security among the five. According to Korea’s CPS of Ghana, the overall core sectors were selected by integrating Ghana’s national development plans, Korea’s competitive advantage, size of available ODA budget, harmonization with other donors, and sectoral connectivity [20]. Specifically, about the new inclusion of its ARD, the 2016-2020 CPS stated that the decision to support Ghana’s ARD was made to improve its agricultural productivity, farm income, rural community and overall income disparity through agricultural modernization [20]. However, these objectives for justifying ARD grants to Ghana can be applied to most sub-Saharan countries. Therefore, the cases of Mozambique and Ghana could raise a broader question about how Korea selects ARD as a core sector for a recipient country and allocates ARD grants. With the results of this study, there appeared no particular criteria for ARD grant allocation in the select sub-Saharan countries.
CONCLUSION
The Korean government might allocate ARD grants strictly on the basis of individual projects that consider a specific situation of the project site and beneficiaries, regardless of countries. Or, Korea may prioritize an urgent request from any recipient country to support its ARD. Indeed, it is important to consider local contexts in a recipient country to designate core sectors since customization would allow more aligned supports to the local development needs. However, as a donor, it is equally important to formulate valid selection criteria that are commonly applicable to its recipient countries.
| Steps | Details |
|---|---|
| Choose indicators as selection criteria | · Adopt and/or adjust international ARD indicators [1] Rural economic structure, the status of agricultural development [2] Food security status [3] Additional consideration: conflict, state fragility, institutional environment |
| Set formula with indicators | · Determine weightings among indicators · Weightings of indicators provide a channel to reflect the Korean ARD policy direction. · Example: Food security index 1.25 * rural population 0.25 * agricultural GDP contribution * state fragility |
| Measure and rank ARD status with formula |
· Rank potential recipients based on severity and urgency in ARD based on the formula · Consider unexpected political and social risks and local contexts |
| Select recipients and allocate ARD budget |
· Consider setting a minimum and ceiling in ARD allocation to balance other sectors |
| Monitor ARD spending and evaluate among projects or countries |
· Utilize evaluation results for the next funding cycle · Share results to draw lessons learned for similar ODA grant allocation |
Setting commonly applicable selection criteria for ADR support could improve Korean ODA in effectiveness, transparency and fairness. First, a potential recipient country can estimate whether it meets the Korean criteria and will receive significant Korean support for its ARD. This prediction helps the recipient country manage its budget and planning of ARD more effectively and potentially insulate the country from volatility in ARD aid. Second, as a donor, selection criteria for ADR support may warrant coherent ODA strategies and consistent allocation based on the evidence: A severity level of food security and an urgent need for agricultural aid. Third, the criteria offer transparency and justification for ARD support, which likely leads to a strong public consensus on ODA spending among Koreans. A severe level of food insecurity and agricultural failure in sub-Saharan Africa is often visualized in media to persuade the Korean public for aid needs. However, this has barely satisfied its civil society that demands evidence-based validation of ODA spending and result-based practice. Fourth, at a global level, the criteria can be a tool to evaluate the effectiveness of Korean ODA as a major donor, by measuring progress across its ARD-grant recipient countries. Fifth, the disclosure of the criteria will likely gain consensus in fairness across developing countries that do not receive ARD support from Korea.
ARD as a development project is difficult to successfully carry out because the input-impact pathway can be complex. However, when Korea does it right, it can be one of the most effective development tools to protect the most vulnerable and poorest from volatile and unsustainable livelihoods. With these advantages, the Korean government should take a fresh look at its ARD support mechanism and consider formulating basic selection criteria. This study suggests a selection process for the Korean government to effectively, transparently and fairly support ARD in sub-Saharan Africa and beyond, as summarized (Table 13).
The current study has limitations such as the limited ARD-relevant indicators, a small number of countries examined and exclusion from concessional loans. Other indicators could show a different situation of the five countries or analysis of all recipient countries of Korea might reveal a different story. Additionally, the Korean government may utilize its own criteria, not released to the public for political reasons. However, this study is strongly valid in a way that the five countries have had good representativeness as the priority partner countries over the decade, and the ARD indicators employed are broadly used for initial analysis.
Any change in a selection process for ARD grant allocation will likely create profit and loss with Korean ODA. Especially in countries with decreased or little ARD support, the Korean government needs to provide a rationale of its decision that should be effective and diplomatically acceptable. An increase in ODA quantity is important, but the quality of ODA practice is equally or even more important.
ETHICS APPROVAL AND CONSENT TO PARTICIPATE
Not applicable.
HUMAN AND ANIMAL RIGHTS
No animals/humans were used for studies that are the basis of this research.
CONSENT FOR PUBLICATION
Not applicable.
AVAILABILITY OF DATA AND MATERIALS
The data supporting the findings of the article is available in the KOICA Annual Reports at http://www.koica.go.kr/koica_en/3492/subview.do [24], in the World Population Review at http://worldpopulationreview.com/countries/ethiopiapopulation/, reference number [27], in the Global Hunger Index at https://www.globalhungerindex.org/download/all.html, reference number [28], and in the World Bank at https://data.worldbank.org/indicator, reference number [29]
FUNDING
None.
CONFLICT OF INTEREST
The author declares no conflict of interest, financial or otherwise.
ACKNOWLEDGEMENTS
The author sincerely thanks students at Konkuk University in Seoul, South Korea for their inspirational conversations and stimulating questions as well as Haneul Lee for technical assistance with the initial data collection and sorting at KU Institute for International Development Cooperation at Konkuk University, Seoul, South Korea.

