All published articles of this journal are available on ScienceDirect.

Association Between the Blue Color Intensity of the Skin with Growth Performance and Skin Spottiness in a Blue-Colored Strain of Rainbow Trout (Oncorhynchus mykiss)
Abstract
Background:
Blue-colored phenotypes have the potential to enhance the external appearance of rainbow trout for marketing due to their attractive skin coloration. However, further analyses are necessary to assess their overall performance for fish farming purposes.
Objective:
To investigate a blue-colored strain of rainbow trout in order to determine whether growth performance and spotting variation of the skin, either in number or size, are related to Blue Color Intensity on the back skin (BCI).
Method:
A correlation analysis and comparisons among trout separated into Low- and High-BCI categories were carried out in three blue-colored groups of rainbow trout.
Results:
In all groups, BCI was significantly and positively related to body weight (0.01 < P < 0.05). There was a significant and negative association between BCI and the number of dark spots in one group (P < 0.001), whereas no significant association was observed among BCI and dark spot size in any of the groups (P > 0.05). In one group, a significantly higher body weight (P < 0.05) was observed in the High-BCI (BCI ≥ 50%) than in the Low-BCI (BCI < 50%) category. The same pattern was observed in two groups (P < 0.05) when the lowest (1st) and highest (4th) quartiles of BCI were compared. In one group, number of dark spots was significantly lower in the High-BCI (≥ 50% and 4th quartile) than in the Low-BCI (< 50% and 1st quartile) category (P < 0.01 and P < 0.05, respectively). Dark spot size presented no significant differences among BCI categories (P > 0.05) in any of the groups.
Conclusion:
Results suggest that trout with more intensely blue colored skin has better growth performance and relatively less spotted skin than less intensely blue-colored specimens. These characteristics may represent an interesting advantage for using this class of trout in intensive fish farming.
1. INTRODUCTION
The blue-colored morph of the rainbow trout Oncorhynchus mykiss (Walbaum, 1792) is a distinctive phenotype among the various color morphs reported in this species, which is generally characterised by a blue back, a whitish belly, and a conspicuously silvery body. This color morph has been reported in various cultured populations around the world and includes the iridescent metallic blue variant [1], the cobalt variant [2, 3], the new blue variant [4], and the Blue Back strain [5]. In intensive farming, the blue-colored phenotype of rainbow trout is considered an attractive trait that satisfies the consumer demands of certain markets. Thus, the use of this phenotype in production has great potential. This is the case of the iridescent metallic blue variant studied [1], which, in addition to its attractive external appearance, also presents a better growth performance than the common trout, normal fertility, and the egg survival does not differ from that observed in control groups. As a result, this strain has been considered suitable for farming. However, the advantages reported for the iridescent metallic blue variant of rainbow trout do not appear to apply, generally, to other blue-colored morphs of this species, given that this condition may have detrimental pleiotropic effects on growth, survival and condition factor. In fact, survival and body weight are about 25% lower for the new blue variant than the wild-type at the juvenile stage [4], and the cobalt variant exhibits a lower growth rate and a higher condition factor in comparison with normal trout, among other detrimental effects [2, 6, 7]. Therefore, given the variation in the overall performance of blue-colored morphs of rainbow trout reported to date, specific assays are required to identify possible drawbacks, prior to considering a particular blue-colored strain for culture.
The Blue Back strain of rainbow trout is an interesting blue-colored phenotype for farming purposes in Chile, since its silvery blue color, along with scarce spottiness and a less intense red lateral band are desirable traits for consumers in certain international markets [5]. Therefore, this strain could be an attractive option for national producers to strengthen the trout farming industry, which has generated a significant income for our country over the past few years [8]. The application of a similar strategy has been cost effective in the culture of other commercial fishes, such as tilapia, where the red strains have been cultured on an industrial scale given that they are more widely accepted than the wild-type strain [9]. In rainbow trout, some progress has been made with regard to this issue in recent years, particularly in Europe [10], where selected breeding based on scoring for various appearance traits has been implemented. The Blue Back strain has been characterised according to its skin color pattern at the juvenile and adult stages [5, 11]. However, growth performance data for intensive culture has not been collected. Here, we examined several rainbow trout families reared under standard farming conditions for two years, in order to ascertain the effect of blue color intensity on growth performance. Furthermore, dark spots were counted and measured to provide an insight into the effect of this phenotype on spottiness. It is also important to assess this attribute given that it may influence consumer acceptance, since some international markets prefer trout marketed whole with few dark spots on the skin [5]. National producers may find this information useful for improving the external appearance of farmed rainbow trout.
In the current study, we analyzed the blue color intensity of three groups of the Blue Back strain of rainbow trout reared under standard farming conditions, to determine whether the variation of this color attribute could affect body weight and skin spottiness. To address this aim, first, we measured the blue color on the back by means of computer-based image analysis using spectral analysis software, based on images taken 282 days post fertilization, since at this stage, the full expression of this color is reached. Secondly, individuals were categorized into two contrasting classes within each group, namely, low and high blue color intensity, in order to determine, by comparison, the effect of the blue color variation on the body weight and skin spottiness of fishes. This design allowed us to determine the importance of the blue color variation on growth performance and external appearance, i.e., skin spottiness, both highly important traits of farmed rainbow trout.
2. MATERIAL AND METHODS
2.1. Blue-Colored Groups of Rainbow Trout
Three independent groups of rainbow trout, PBBPR09 (n = 200), PBBIN07 (n = 138) and PBBOT07 (n = 243), were analyzed. These groups belong to selection lines derived from a selection program for the Blue Back trait that was undertaken in the Huililco Ltd. fish farm located in the Pucón district, La Araucanía Region, Chile; and comprised of 25 to 37 families. These groups were composed of full-sib and half-sib families obtained by mating one male breeder with two or three female breeders, which were produced during winter 2007 (PBBIN07), autumn 2007 (PBBOT07) and spring 2009 (PBBPR09). Families had different ages within each group, due to different spawning times among the female breeders used for crossbreeding at the time the families were constituted. A random sample of fish per family was tagged individually with passive integrated transponders (PIT) when they had achieved a body eight of 5.0 g, for unambiguous identification.
Subsequently, they were cultured as a pool at a temperature of 9-11°C, with a constant water flow at 7 L/s and a culture density of 1-20 kg/m3 in a 30 m3 raceway pond with a green background. During rearing, fish were fed with extruded food, free of pigment (BIOMAR, Golden Trucha), composed of 47% protein, 20% lipid, 10% ash, and 1% crude fiber at 1.5% of live body weight per day. Pellet size was increased, according to the manufacturer’s recommendations, as the fish grew. At the end of the rearing periods, individually PIT-tagged fishes from each family of each group were measured for body weight and total length to the nearest 0.1 g and 0.1 cm, respectively. For the PBBOT07 group, both biometric parameters were registered at the beginning of the rearing period to calculate specific growth performance parameters. Fish were anesthetised with 100 mg/L of benzocaine solution before handling.
2.2. Image Analysis
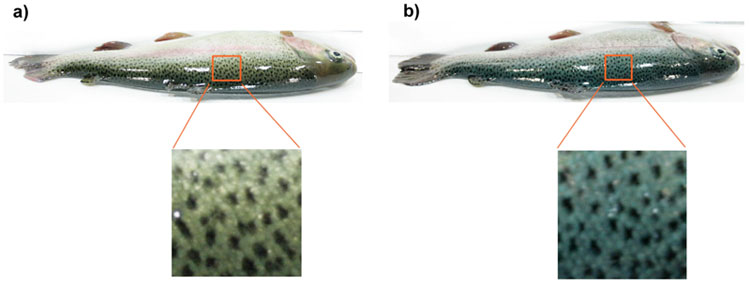
Rainbow trout individuals were photographed at the end of the rearing period to record their skin coloration and spottiness. At this stage (age-1+ or age-2+ depending on the group), full expression of the blue color and skin spottiness for this species was reached [11], and therefore, it was considered appropriate to register the skin pigmentation parameters at this time. Moreover, blue color intensity of the skin at adult stages in rainbow trout must reflect its expression at early development stages, since this character reaches a full and constant expression at least 282 days postfertilization [11]. Thus, the analysis of possible effects of this condition on different growth performance parameters would be appropriate at this development stage. Image analysis includes measurements of skin blue color intensity on the back (BCI), number of dark spots and dark spot size, as described by [5]. Briefly, this method involved photographing the entire trout from the dorsal view (from back to lateral line) using a 7.0 Mpx digital camera and lighting system with color temperature adjustment. The photographs were then stored at 24-bit RGB color depth on a memory card and transferred to a computer for color analysis. The BCI was defined as the percentage of skin area covered by blue/sky-blue hues [(number of matching pixels of blue/sky-blue hues/total number of pixels) x 100] registered within the 3 x 3 cm area of the back skin located in front of the dorsal fin. This parameter was calculated using the colormap function and color threshold tool of the SIGMASCAN PRO 5.0 software. Dark spots were measured in grayscale with IMAGE J 1.38 software using the particle analysis tool and expressed as the mean Number of Dark Spots (NDS) per area (number of spots/cm2) and the mean Dark Spot Size (DSS) in the area analysed (cm2). In order to improve analysis of the effects of BCI on growth performance and spottiness, each group was categorized into contrasting groups according to the inter-individual variation of the BCI on the back. Thus, two categories were defined: 1) fishes with BCI < 50% (Low-BCI) and 2) individuals with BCI ≥ 50% (High-BCI) (Fig. 1). Furthermoe, fishes of each group were also sorted into 1st (Low-BCI) and 4th (High-BCI) quartiles in order to analyze the effect in more contrasting categories.
2.3. Growth Performance Evaluation
The growth performances of fish was evaluated by calculating the following parameters: 1) Specific growth rate (SGR, %/day) = [(lnBWf - lnBWi)/D] x 100; 2) Condition Factor (CF) at the end of the testing periods, CF = (BWf/TL3) x 100; 3) Daily Growth (DG, g) = (BWf - BWi)/D; 4) Relative Growth (RG, %) = [(BWf - BWi)/ BWi] x 100; 5) Coefficient of Variation (CV, %) at initial and final Body Weight = (SD /BW) x 100; 6) Absolute body Weight Gain (AWG, g) = (BWf - BWi); and 7) Relative body Weight Gain (RWG, %) = (BWf - BWi) x 100/ BWi; where, BWf = final Body Weight (g), BWi = initial Body Weight (g), D = number of days rearing (rearing time), and TL = final Total Length (cm). Calculations were based on measurements of individually PIT-tagged fish from each family.
2.4. Statistical Analysis
Pearson product-moment linear correlations were carried out to assess the relationship between the BCI and the growth performance and spottiness parameters in each group. The student’s t-test for independent samples was used to test the significant differences among means of the BCI categories (Low-BCI vs. High-BCI). Prior to statistical analysis, the variables were analysed for conformance to assumptions regarding normal distribution and homogeneity of variance using the Kolmogorov-Smirnov and Levene´s tests, respectively. All statistical analyses were performed using the STATISTICA 5.1 program.
3. RESULTS
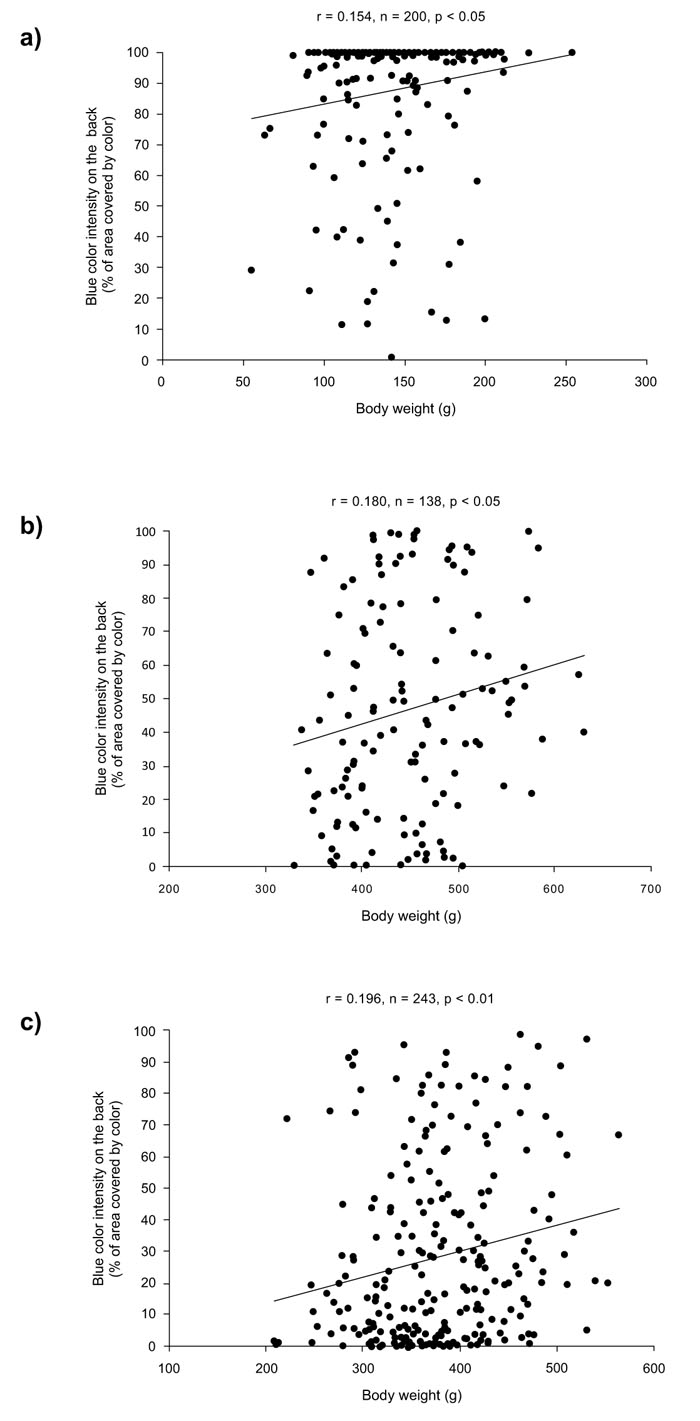
Summary statistics of body weight and skin color parameters of blue-colored groups of rainbow trout are presented in Table 1. The association analysis (Table 2) revealed that BCI was significantly and positively related to body weight in all groups (PBBOT07: r = 0.1966, P = 0.0021; PBBPR09: r = 0.1545, P = 0.0289; PBB07IN: r = 0.1809, P = 0.0337). Thus, more heavy blue colored individuals had higher body weight (Fig. 2).
Since the age of individuals within groups was not significantly correlated to body weight (PBBOT07: r = 0.1070, P = 0.0962; PBBPR09: r = 0.1275, P = 0.0721; PBB07IN: r = -0.0362, P = 0.6731), age effects may not have inflated the relationship between the body weight and BCI. The correlation analysis of spottiness parameters indicated that there was a significant negative association between NDS and BCI, but in one group (PBBOT07: r = -0.23869, P = 0.0002; PBB07IN: r = 0.0435, P = 0.6124), whereas no significant association was observed among DSS with BCI in any group (PBBOT07: r = -0.0626, P = 0.3312; PBB07IN: r = 0.0833, P = 0.3311).
| Groups | No. of Individuals | No. of Families | Age Range (days) | Body Weight (g) | Blue Color Intensity on the Back (% of area Covered by Color) | Number of Dark Spots (No. of Spots/cm2) | Dark Spots Size (cm2) |
|---|---|---|---|---|---|---|---|
| PBBPR09 | 200 | 37 | 403-467 | 145.31 ± 33.53(56-254) [0.23] | 87.95 ± 22.74(1.11-100) [0.26] | - | - |
| PBBIN07 | 138 | 34 | 940-998 | 447.60 ± 64.94(330-631) [0.15] | 46.74 ± 31.68(0.07-100) [0.68] | 4.09 ± 1.61(0.00-8.00) [0.39] | 2.91 ± 1.55(0.00-8.55) [0.53] |
| PBBOT07 | 243 | 25 | 871-910 | 376.45 ± 67.51(208-564) [0.18] | 28.20 ± 28.34(0.00-98.59) [1.00] | 1.45 ± 0.80(0.00-3.78) [0.55] | 0.07 ± 0.03(0.00-0.18) [0.46] |
| Correlation | PBBOT07 (n = 243) | PBBPR09 (n = 200) | PBB07IN (n = 138) |
| BCI vs. BW | 0.1966 **(0.0021) | 0.1545 *(0.0289) | 0.1809 *( 0.0337) |
| BW vs. Age | 0.1070 NS( 0.0962) | 0.1275 NS(0.0721) | -0.0362 NS(0.6731) |
| BCI vs. NDS | -0.23869 ***(0.0002) | - | 0.0435 NS(0.6124) |
| BCI vs. DSS | -0.0626 NS(0.3312) | - | 0.0833 NS(0.3311) |
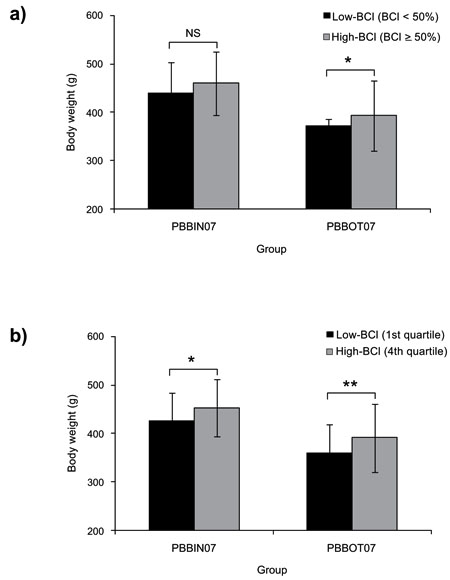
The analyses of categorized data by BCI in PBBOT07 and PBB07IN groups are presented in Table 3. In both groups, we noted a higher body weight in individuals of BCI ≥ 50% than in BCI < 50%, although this difference was significant only in group PBBOT07 (P = 0.0080) (Fig. 3a). In the quartile analysis, a more clear trend was observed, since body weight was significantly higher in the 4th than in the 1st quartile of BCI in both groups (PBBOT07, P = 0.0080; PBB07IN, P = 0.0482) (Fig. 3b). In the spottiness analysis, NDS was significantly lower in High-BCI (BCI ≥ 50% and 4th quartile,) than in Low-BCI (BCI < 50% and 1st quartile) categories, although this trend was significant for PBBOT07 group only (P = 0.0014 and P = 0.0004, respectively). DSS parameter did not present significant differences among BCI categories in any group.
| Groups | Low-BCI vs. High-BCI | Student`s t-test(Exact P-value) | |
|---|---|---|---|
| - | BCI < 50% | BCI ≥ 50% | - |
| PBBIN07 | - | - | - |
| n | 80 | 58 | - |
| BCI value (%) | 23.74 ± 16.11 | 78.46 ± 16.91 | - |
| BW (g) NS | 438.79 ± 64.17 | 459.74 ± 64.57 | 0.0612 |
| NDS (Nº of dark spots/cm2) NS | 4.10 ± 1.46 | 4.07 ± 1.81 | 0.9182 |
| DSS (cm2) NS | 2.90 ± 1.50 | 2.91 ± 1.64 | 0.9794 |
| PBBOT07 | - | - | - |
| n | 191 | 52 | - |
| BCI values (%) | 15.45 ± 14.63 | 75.05 ± 12.91 | - |
| BW (g) * | 371.95 ± 65.81 | 393.00 ± 71.65 | 0.0459 |
| NDS (Nº of dark spots/cm2) *** | 1.54 ± 0.79 | 1.14 ± 0.76 | 0.0014 |
| DSS (cm2) NS | 0.07 ± 0.03 | 0.06 ± 0.03 | 0.4517 |
| - | 1st quartile | 4th quartile | - |
| PBBIN07 | - | - | - |
| n | 38 | 35 | - |
| Quartile values (BCI) | 9.08 ± 7.39 | 90.66 ± 7.95 | - |
| BW (g) * | 426.57 ± 56.79 | 453.56 ± 57.87 | 0.0482 |
| NDS (Nº of dark spots/cm2) NS | 4.13 ± 1.55 | 4.27 ± 1.93 | 0.7333 |
| DSS (cm2) NS | 2.88 ± 1.49 | 3.15 78 ± 1.72 | 0.4703 |
| PBBOT07 | - | - | - |
| n | 62 | 61 | - |
| Quartile values (BCI) | 1.41±1.28 | 70.92 ± 15.56 | - |
| BW (g) ** | 359.55 ± 59.99 | 391.26 ± 70.21 | 0.0080 |
| NDS (Nº of dark spots/cm2) *** | 1.69 ± 0.79 | 1.18 ± 0.75 | 0.0004 |
| DSS (cm2) NS | 0.07 ± 0.03 | 0.06 ± 0.03 | 0.2869 |
The analysis of growth performance (Table 4) revealed a slightly higher body weight gain in individuals of High-BCI (BCI ≥ 50%) compared to those of Low-BCI (BCI < 50%). Thus, body weight gain was +11.76 g (8.73%) in PBBOT09, +20.95 g (4.77%) in PBBIN07, and +21.05 g (5.66%) in PBBOT07. However, these differences were only statistically significant in the PBBOT07 group (P = 0.0459). Further analysis of growth rates in PBBOT07 group, where a more complete analysis of performance parameters was carried out at 910 days (Table 5), revealed similar means for TL, SGR and CF among both categories of BCI, but with a statistically significant difference of means for DG (P = 0.0446), with the High-BCI (BCI ≥ 50%) category presenting the highest DG value than those of Low-BCI (BCI < 50%) category (0.54 ± 0.10 and 0.51 ± 0.09, respectively). Thus, the better performance of individuals of the High-BCI category may be attributable mainly upon a slightly increasing (+5.88%) of mean daily growth.
| - | PBBOT07 | PBBOT09 | PBBIN07 | |||||||
|---|---|---|---|---|---|---|---|---|---|---|
| - | Low-BCI vs. High-BCI | Student`s t-test | Low-BCI vs. High-BCI | Student`s t-test | Low-BCI vs. High-BCI | Student`s t-test | ||||
| - | ≤50% | >50% | - | ≤50% | >50% | - | ≤50% | >50% | - | |
| Parameter | - | - | - | - | - | - | - | - | - | |
| n | 191 | 52 | - | 20 | 180 | - | 80 | 58 | - | |
| BCI value (%) | 15.45 ± 14.63 | 75.05 ± 12.91 | - | 27.83 ± 13.82 | 94.62 ± 10.29 | - | 23.74 ± 16.11 | 78.46 ± 16.91 | - | |
| BW (g) | 371.95 ± 65.81 | 393.00 ± 71.65 | 0.0459 * | 134.73 ± 34.86 | 146.48 ± 33.27 | 0.1372 NS | 438.79 ± 64.17 | 459.74 ± 64.57 | 0.0612 NS | |
| AWG (g) | +21.05 | - | +11.76 | - | +20.95 | - | ||||
| RWG (%) | +5.66 | - | +8.73 | - | +4.77 | - | ||||
| - | Low-BCI vs. High-BCI | Student`s t-test(Exact P-value) | ||
|---|---|---|---|---|
| - | BCI < 50% | BCI ≥ 50% | - | |
| Parameter | - | - | - | |
| n | 191 | 52 | - | |
| BWi (g) *** | 5.62 ± 1.81 | 6.64 ± 1.81 | 0.0002 | |
| BWf (g) * | 371.95 ± 65.81 | 393.00 ± 71.65 | 0.0459 | |
| TL (cm) NS | 31.54 ± 1.96 | 32.13 ± 1.80 | 0.0523 | |
| SGR (%/day) NS | 5.90 ± 0.18 | 5.95 ± 0.19 | 0.0626 | |
| CF NS | 1.18 ± 0.11 | 1.17 ± 0.10 | 0.7595 | |
| DG (g) * | 0.51 ± 0.09 | 0.54 ± 0.10 | 0.0446 | |
| RG (%) * | 7204.11 ± 2591.81 | 6258.52 ± 2108.74 | 0.0162 | |
4. DISCUSSION
Several studies reveal that color morphs of rainbow trout may be associated with negative pleiotropic effects on growth performance parameters, represented by slower growth rates than wild-types, as has been reported for albino [12-14], palomino [12] and golden [15] phenotypes, including some blue-colored variants [2, 4, 6]. In our case, given that we found a significantly positive relationship between blue skin color intensity and body weight in all blue-colored groups analyzed, it seems that this condition, contrary to what might be expected, produces a positive effect on growth performance in rainbow trout. This trend was established by comparing Low-BCI and High-BCI categories of blue color intensity. Indeed, High-BCI fish (BCI ≥ 50%) outperformed the Low-BCI fish (BCI < 50%) for body weight in most groups, reaching a relative body weight gain above 4.77%. These results provide new evidence supporting the positive effect of the blue-colored phenotype on body weight in rainbow trout. This effect was first reported by Kincaid [1] in a blue-colored variant of this species from the United States, called iridescent metallic blue, a phenomenon that was revealed by a higher growth rate of the blue-colored morph (18-27%) than normal colored trout.
From a commercial point of view, the positive correlation between the blue color intensity of the skin and the growth rate in blue-colored individuals suggests that this phenotype is highly suitable for farming, since the appealing external coloration of this phenotype, combined with its higher growth rate, should increase culture profitability. Currently, the importance of this situation should not be underestimated, given that rainbow trout farming in Chile depends on the continuous improvement of a set of productive parameters to increase profitability, with external appearance being one of those characters [10, 16].
However, more investigation is required to discard the effect of factors that may have affected our results. To address this problem, a new experimental design should be implemented, for example, to discard the social effects that may have contributed to the differences in growth between High-BCI fish and Low-BCI fish. In salmonid species, it has been demonstrated that this effect may give rise to an unavoidable social hierarchy when specimens of the same species are reared in small units, as occurred in intensive culture and when continuous access to feed is not possible, leading to competition for food [13, 17, 18]. Under such conditions, dominant fish are more active and consume most of the food, which may be the case of High-BCI fish, while subordinate fish have a more restricted feed consumption. Thus, separation, as opposed to communal rearing implemented in this study, should be analyzed in future assays to rule out this effect. In addition, the possible occurrence of physiological and morphological color change should be considered given that these phenomena usually influence variation in skin coloration of fishes in response to environmental factors [19], an effect that leads to phenotypic plasticity. For example, in brown trout populations, the intensity of fish coloration, at least for melanin-based coloration, may vary significantly to match their background color [20]. In other species, variation in skin coloration has also been reported in response to density [21] and light [22] variations. Although the existence of these types of effects has not yet been proven in blue-colored phenotypes of rainbow trout, they cannot be totally discarded. Data available on other blue-colored fishes indicate that the blue color expression of the skin may be subjected to physiological color change [23, 24]. Stress [25, 26] and environment management [27] may influence this type of color change, factors that are difficult to control in fish farming.
Another interesting finding from this study is the negative relationship found in some groups between blue color intensity and dark spot number in the blue-colored phenotype. This result agrees with a previous study carried out at the juvenile stage in a similar blue-colored phenotype of rainbow trout, in which a slightly negative correlation between the two parameters was also observed [11]. Therefore, these data suggest an association between reduced skin spottiness of the blue-colored rainbow trout as a function of the blue color intensity. This result would be consistent with observations in other blue-colored phenotypes of rainbow trout, such as the cobalt variant, which shows a depigmented skin attributable to a reduction in dermal melanophores [3].
The covariation between the blue coloration and other phenotypic traits such as growth performance and spottiness parameters, suggests a pleoitropic effect for the underlaying genes of this phenotype. To date, the gene(s) that control this trait in rainbow trout remains unknown. Although this aspect was not addressed in our study, candidate genes may include those that control pteridin and melanin synthesis, based on biochemical analysis of cobalt-variant specimens of this species, which show significantly reduced levels of these pigments, as compared to typical trout [28]. In addition, given that the blue coloration in fish is generally considered a structural color rather than a true color, emerging through the Tyndall effect, genes controlling the structural changes to skin layers may also be involved. In fact, evidence obtained in other fish indicates that some genes related skin structure appear to participate in the origin of blue coloration. For example, in cichlids, the blue color appears to arise from a differential expression of genes related to collagen synthesis [29]. Further studies, ideally using a combination of molecular genetics and experiments focusing on specific gene interactions with phenotypic traits, would be helpful in analyzing the maintenance or disruption of the correlation between the blue-colored phenotypes and growth performance or spottiness. This information will help elucidate the variations in this interaction. For example, some blue-colored phenotypes of common carp [30, 31] produce opposing effects on growth performance, which suggests different underlying genetic bases for this trait. To date the analysis of genetic basis of blue-colored phenotypes of rainbow trout, such as the new blue variant [4] and the Blue Back strain [32], indicates a different underlying genetic base for these phenotypes.
CONCLUSION
This study concludes that the blue color intensity on the back skin of a blue-colored phenotype of rainbow trout is positively correlated with growth performance. In addition, there would be an inverse relationship between blue skin color intensity and dark spot number; that is, fish with greater blue color intensity tend to have skin that is less spotty. These findings may be useful to enhance trout farming in Chile, given that these characteristics are highly desirable in terms of increasing the profitability of this culture.
ETHICS APPROVAL AND CONSENT TO PARTICIPATE
This research was certified by the Chilean Undersecretary of Fisheries and Aquaculture related to the application of a protocol of sanitary management and animal care that must be applied in fish farms that operate under its jurisdiction (Decree DS319-2001). This investigation was developed according to the guidelines of the bioethics committee of the University of Los Lagos.
HUMAN AND ANIMAL RIGHTS
During the period of registration of the biometric and skin coloration data, the fish were managed in accordance with the recommendations of the Guidelines for the Use of Fishes in Research (http://fisheries.org/guide- for-the-use-of-fishes-in-research).
CONSENT FOR PUBLICATION
Not applicable
CONFLICT OF INTEREST
The authors declare no conflict of interest, financial or otherwise.
ACKNOWLEDGEMENTS
This study was partially financed by the Innova-Corporación de Fomento de la Producción de Chile (CORFO) Project 05CT6PPT–08.

