All published articles of this journal are available on ScienceDirect.
Estimating Soil Thermal Diffusivity Using Pedotransfer Functions with Nonlinear Regression
Abstract
Background and Objective:
Pedotransfer Functions (PTFs) are widely used for estimating soil thermal diffusivity. Some attempts have been made to indirectly predict soil thermal diffusivity from the easily available fundamental soil physics properties. The aim of the work was not only to validate the usage of PTFs with Nonlinear Regression (NLR) for estimating soil thermal diffusivity (KD), but to select the best predictor variables used for determination of PTFs.
Materials and Methods:
Soil thermal diffusivity was measured at different values of water content using Kondratieff method. The parameters of the quadratic equation, which described the relation between thermal diffusivity and water content, were determined by the fitting curve and using PTFs (exponential equations) based on soil physical properties. The combination of different soil physical properties used as PTF model’s independent variables was tested. Three classes of PTFs were proposed using NLR to estimate KD were: KDPTF-1 (Sand+ Silt+ Clay), KDPTF-2 (Sand+ Silt+ Clay + Bulk density), and KDPTF-3 (Sand+ Silt+ Clay+ Bulk density + Organic matter).
Results:
The best class of PTF could be used for calculating the parameters of the quadratic equation and soil thermal diffusivity was KDPTF-1 which considered the percentage of sand, silt and clay, RMSE=2.94×10⁻⁸ m2/s, and GMER =1.05.
Conclusion:
The quadratic and exponential equations represented the nonlinear regression equations, which could be used for estimating soil thermal diffusivity at different values of water content from easily available data on soil texture, bulk density, and organic matter content.
1. INTRODUCTION
Soil thermo-physical parameters are widely used parameters of soil physics in the field of agricultural and especially in applications of soil heat flux [1, 2]. They strongly depend on soil moisture, soil texture, soil bulk density, soil porosity, and organic matter [3-6]. The information of soil thermo-physical parameters is required to accurately predict soil temperature and modeling soil heat flux [7]. It directly and indirectly affects soil physical properties, such as soil hydraulic conductivity [8], infiltration rated, thermal conductivity, soil water and heat transfer. Also, the physical and environmental processes are affected by soil thermo-physical parameters, such as the amount of dew, soil aeration, evaporation, crop growth, soil CO2 production [9], and ecosystem carbon sequestration. Soil thermo-physical parameters are soil thermal conductivity, volumetric heat capacity, and soil thermal diffusivity. Thermal diffusivity  is defined as the ratio of the thermal conductivity (λ) to the volumetric heat capacity (Cv) defined by Huang and Liu [10]. It is a parameter that quantifies the ability of soil to store thermal energy during soil heat transfer processes. Thermal diffusivity is a fundamental property for studying the thermal process of soil. Two main methodologies are usually used for estimating soil thermal diffusivity. The first one are the direct methods, based on laboratory measurements [11, 12] which are more accurate. However, they are costly and time-consuming. The second one are the indirect methods, based on mathematical models and Pedotransfer Functions (PTFs). PTFs translates data which is easy to measure such as soil bulk density and organic matter into data which is difficult to measure such as soil thermal diffusivity [13]. PTFs are often developed using statistical regression and nonlinear regression walczak et al. [14]. Particle size distribution, soil bulk density and soil organic matter are commonly used as predictor variables in PTFs [15]. There are many mathematical models which study soil thermal parameters by defining equation, such as a model of Chung and Horton [16]. It describes the relation between soil thermal conductivity and soil moisture as shown in Eq.1.
 |
(1) |
The empirical parameters b1, b2, and b3 depend on soil physical properties. HYDRUS-1D program [17] can estimate those parameters which depend on soil texture.
On the other hand, Tikhonravova and Khitrov [18] suggested the relation between soil thermal diffusivity and water content by a polynomial equation. Moreover, Arkhangel’skaya19 suggested another kind of equation: a lognormal equation which shows dependence of thermal diffusivity at different water content. Arkhangel’skaya [19] calculated the parameters of the model taking into account only soil bulk density and organic matter, moreover, this model included 4 parameters. Also, Ghader [20] estimated the values of the thermal conductivity and thermal diffusivity as a function of specified moisture content and bulk density using PTFs. Most of the previous models predicted for soil thermal diffusivity at different values of water content were complicated and involved many parameters (3-4). However, they did not consider all the physical properties of the soil. Although soil texture is one of the main soil physical properties which influences volumetric heat capacity and soil thermal diffusivity values, it was ignored in estimating soil thermal diffusivity using many mathematical models and PTFs. The objectives of the work were: (1) to propose the model used for estimating soil thermal diffusivity from soil water content based on soil physical properties, and (2) to select the best class of soil physical properties (predictor variables) used for estimating KD using PTF.
2. MATERIALS AND METHODS
2.1. Soil Sampling
In this study, 30 different undisturbed soil samples were collected from surface and subsurface layers of different soil profiles from Moscow region (56° 08′ N, 037° 48′ E), Russia. Three soil profiles were dugout and then divided into three horizons for each profile, horizon A (0-30) cm, horizon EL (30-40) cm and horizon B1 (40-50) cm. Then, undisturbed soil samples were collected according to the difference in the depth from each horizon. Standard 100 cm3 (a 5 cm diameter) sampling rings were used in the analysis. Silty loam and silty clay loam soils represented major agricultural in agro-podzolic soils of the Moscow region, Zelenograd field laboratory of Soil Science, Institute named V.V.Dokuchaev. International soil science system of soil texture classification was used to define soil texture. Soil texture was silty loam in horizon A for surface layers and silty clay loam in horizon B1 for subsurface layers. Soil thermal diffusivity was measured at different water content (7 levels for each sample), N=210 replicates.
2.2. Soil Physical Characteristics
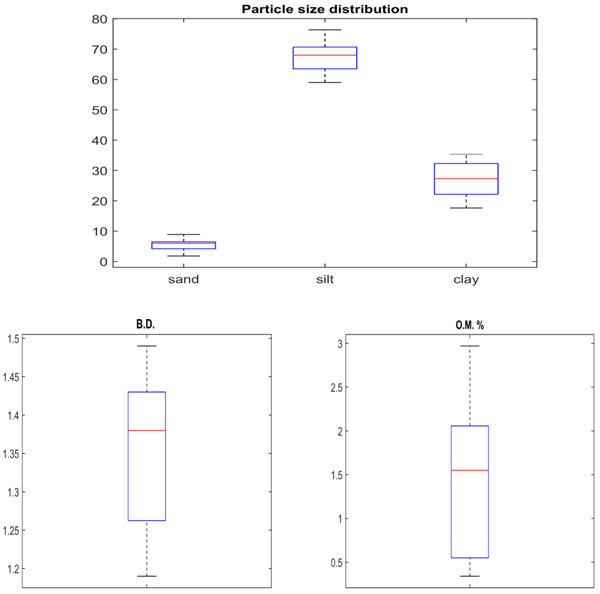
Particle Size Distribution (PSD) was measured using the pipette method based on stock law. Sodium pyrophosphate solution 4% was used as a dispersing agent as described by Gee and Bauder [21]. International Data Based: Sand > 0.05 mm, Silt (0.002-0.05) mm and Clay <0.002 mm. Soil bulk density (ρb) was determined by the volumetric cylinder method Klute and Dirksen [22]. The soil samples were initially sieved through the 2 mm sieve before PSD and OM determination (Fig. 1).

2.3. Determination of the Thermal Diffusivity (KD)
Soil thermal diffusivity was measured in the laboratory using Kondratieff method [12] at different water content according to Shein and Mady [5]. The levels of soil water content were 0.14, 0.16, 0.18, 0.22, 0.25, 0.28 and 0.30 g/g soil.
One method for measuring thermal diffusivity is based on placing a heat source, having a constant temperature in contact with the surface of a soil column having constant cross-sectional area and insulated sides, then measuring soil temperature every 15 sec for 30 min.
 |
KD is the soil thermal diffusivity m2/s, α is the heating or cooling rate of the soil (second-1) and β is the constant which depends on the shape and volume of the soil in core.
2.4. Model of the Quadratic Equation for Calculating Soil Thermal Diffusivity KD
The relationship between soil thermal diffusivity and water content was represented using a quadratic equation as Eq.2 Shein and Mady [5]. The quadratic equation, one of the nonlinear regression forms, was selected according to the highest value of determination coefficient (R2) between soil thermal diffusivity and water content.
 |
(2) |
Where, b1, b2, and b3, were the experimental parameters depended on soil physical properties and ɷ was the weight of soil water content.
2.5. PTFs Calculated Parameters of the Quadratic Equation.
The parameters of the quadratic equation (b1, b2, b3) were estimated by fitting curve using MATLAB program. PTFs models were developed using the exponential equation for predicting parameters of quadratic equation (b1, b2, and b3) based on fundamental of soil physical properties. Soil physical properties used as independent variables were the percentage of sand, silt, clay, soil bulk density, and organic matter. Soil samples were divided into training data and testing data. Twenty soil samples (140 replicates) used as the training dataset to determine and propose PTF, and ten soil samples (70 replicates) used as the testing dataset in order to evaluate the efficiency of this PTF. Table 1 showed that three different classes of PTFs (KDPTF-1 to KDPTF-3) were proposed to calculate thermal diffusivity as a function of water content based on soil physical properties.
| PTFs Name | Input Variables |
|---|---|
| KDPTF-1 | Sand, Silt, Clay |
| KDPTF-2 | Sand, Silt, Clay, BD |
| KDPTF-3 | Sand, Silt, Clay, BD, OM |
The parameters of the quadratic equation b1, b2 and b3 were calculated as a function of soil physical properties using PTFs (exponential equations). All suggested PTFs give KD in [m2/s], and the following equations were suggested as (Table 2).
| The Parameters of the Quadratic Equation | Developed PTFs by Nonlinear Regression |
|---|---|
| PTFs developed using soil texture | |
| b1 | 4.96×10-8.exp (8.67×10-3.sand -1.4×10-2.silt +1.03×10-2.clay) |
| b2 | 1.551× 10⁻⁶ .exp (5.33×10-3.sand+2.33×10-3.silt-2.67×10-3.clay) |
| b3 | 3.5 ×10⁻⁶ .exp (1.83×10-2.sand+1×10-3.silt-3.3×10-3.clay) |
| PTFs developed using soil texture and soil bulk density | |
| b1 | 3.72×10-8.exp (0.0062.sand -0.01.silt +0.0078.clay+0.43.B.D) |
| b2 | 1.86 × 10⁻⁶ .exp (0.004.sand+0.0017.silt-0.002.clay-0.11.B.D) |
| b3 | 4.95 ×10⁻⁶ .exp (0.014.sand+0.00075.silt-0.0025.clay-0.24.B.D) |
| PTFs developed using soil texture, soil bulk density, and organic matter | |
| b1 | 3.65×10-8.exp (0.0052.sand -0.0084.silt +0.0062.clay+0.35.B.D-0.034.O.M) |
| b2 | 1.81 × 10⁻⁶ .exp (0.0032.sand+0.0014.silt-0.0016.clay-0.09.B.D+0.01.O.M |
| b3 | 4.54 ×10⁻⁶ .exp (0.011.sand+0.0006.silt-0.002.clay-0.19.B.D+0.024.O.M) |
2.6. Statistical Analysis
The efficiency of the Pedotransfer Functions (PTFs) was determined using Root Mean Square Error (RMSE) and Geometric Mean Error Ratio (GMER) expressed as:
 |
Where, Yi denotes the measured value,  refers to the predicted value,
  represents the average of the measured value of Y and N is the total number of observations.
Geometric Mean Error Ratio (GMER) was calculated from the error ratio (rk) of measured soil thermal diffusivity (KD) m versus predicted soil thermal diffusivity (KD) p values:
 |
 |
The GMER equals to 1 which corresponds to an exact matching between measured and predicted soil thermal diffusivity; the GMER<1 indicates that the predicted values were generally underestimated; GMER>1 points to overestimation.
Software tools used for statistical analyses were Microsoft Excel 2007, MADLAB and SPSS (version 16.0) (IBM SPSS Statistics, Armonk, NY).
3. RESULTS AND DISCUSSION
3.1. Modeling Soil Thermal Diffusivity as a Function of Soil Moisture
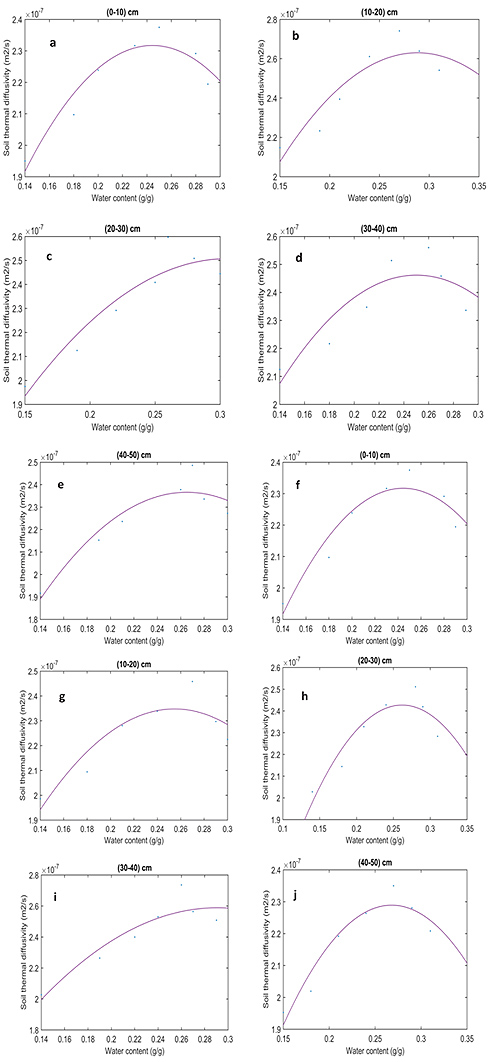
Variation of the soil thermal diffusivity as a function of soil water content is shown in Fig. (2). The soil thermal diffusivity values were varied from 1.40×10⁻⁷ to 2.56×10⁻⁷ m2/s for silty clay loam and silty loam soils, the range of soil water content was 0.14 to 0.30 g/g. The mean value of soil thermal diffusivity was 1.52×10⁻⁷ m2/s for silty clay loam in the subsurface layer (40-50) cm as Figs. (2e, j), while it was 2.05×10⁻⁷ m2/s for silty loam soil in the top surface layer (0-10) cm as Figs. (2a, f). In general, higher soil thermal diffusivity values were at the top surface than at subsurface layers. This result agreed with Danelichen et al. [23]; they showed that the average of thermal diffusivity was 1.95×10⁻⁷ m2/s in the top layer (0.01-0.15 m) and was 1.02×10⁻⁷ m2/s in the subsurface layer (0.01-0.30 m). Soil thermal diffusivity at first increased rapidly with increasing water content to reach the maximum at soil moisture (23-28 g/g), then decreased at a slower rate. The reason of that water content increased thermal contact between soil particles and replaced the air (which has lower thermal conductivity than water) increasing the specific heat between soil partials. While soil thermal diffusivity increased more rapidly than the volumetric heat capacity decreasing thermal diffusivity. This result was in agreement with Usowicz et al. [24]; Arkhangel’skaya et al. [25]; they found that soil thermal diffusivity (KD) is amplified by increasing the soil bulk density and moisture content. And also with depth, soil bulk density was increased and soil organic matter was decreased, which affected soil porosity, pore size distribution, volumetric of heat capacity and decreased the soil thermal diffusivity according to Shein and Mady [5].
Soil thermal diffusivity was measured at different water content. It was represented by ∩ shaped curve using a quadratic equation as Eq. (2)
 |
(2) |
Where, b1, b2, and b3, were the experimental parameters those were estimated by 3 proposed PTFs based on soil physical properties, in order to estimate soil thermal diffusivity at different water content, and ɷ was the weight water content.

3.2. The Efficiency of PTF for Predicating Soil Thermal Diffusivity
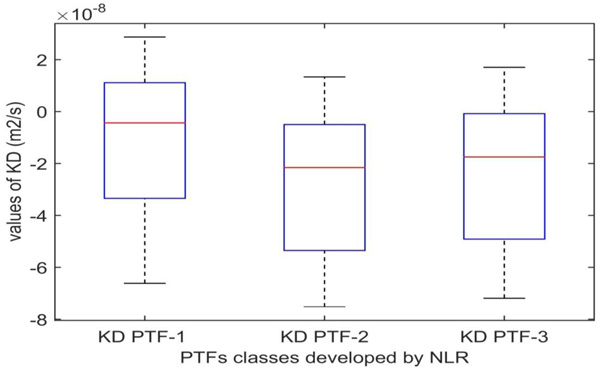
In the case of KDPTF-1, the parameters of the quadratic equation were more accurate than KDPTF-3 and that in the case KDPTF-2, respectively. The results of statistical comparison between developed PTFs classes by NLR are presented in Table 3. The smallest value of GMER close to 1 was 1.05 for KDPTF-1, which showed a small overestimation, while the largest GMER value was 1.15 for KDPTF-2, which showed a big overestimation. Also, the smallest value of RMSE was 2.94×10⁻⁸ m2/s for KDPTF-1, while the largest value of RMSE was 3.82×10⁻⁸ m2/s for KDPTF-2. The best class of PTFs developed by NLR was KDPTF-1 (RMSE=2.94×10⁻⁸ m2/s, and GMER =1.05), which took into account the percentage of sand, silt, and clay (soil texture). While the worst PTFs class developed by NLR was KDPTF-2(RMSE = 3.82×10⁻⁸ m2/s, and GMER =1.15), which considered the percentage of sand, silt clay, and soil bulk density. RMSE for KDPTF-2 was 1.3 times larger than for KDPTF -1, while it was 1.1 times for KDPTF-3. Table 3 showed that the best PTFs classes developed by NLR were KDPTF-1, KDPTF-3, and KDPTF-2 according to the smallest values of RMSE (which were 2.94×10⁻⁸, 3.52×10⁻⁸, and 3.82×10⁻⁸ m2/s, respectively), and according to the GMER close values to 1 (which had the perfect values) as illustrated in Table 3. Box plots in Fig. (3) showed that the difference between measured KD and calculated KDPTF-1 was lower than the difference between measured KD and both of the calculated KDPTF-3 and KDPTF-2, respectively. Moreover, the mean difference between measured KD and calculated KDPTF -1 was closest to the zero. These results were in agreement with the mentioned results of the statistical analysis. Also, the parameters of quadratic equation (b1,b2, and b3) were calculated by KDPTFs-1, considering that the soil texture was more accurate than KDPTFs-3, which further considered that soil texture, bulk density, and organic matter, were more accurate than KDPTFs-2, considering soil texture, and bulk density. This result was in agreement with the HYDRUS-1D program [17], which was used for estimating thermal conductivity and thermal regime using the model of Chung and Horton [16] and the parameters of the model were estimated using only soil texture [17]. Also, Mady and Shein [26] found that the soils which have the same texture, have same soil physical characteristics. Moreover, Ghader [20], studied the effect of the bulk density on increasing the thermal properties of clay‒loam soil which was more than that of moisture content. Those results ensured the impact of soil texture on the soil thermal diffusivity and parameters of the quadratic equation were more than bulk density.
| PTF’s models | RMSE (m2/s) | GMER |
|---|---|---|
| KDPTF-1 | 2.94×10⁻⁸ | 1.05 |
| KDPTF-2 | 3.82×10⁻⁸ | 1.15 |
| KDPTF-3 | 3.52×10⁻⁸ | 1.12 |

For the validation of quadratic equation, the relation between soil thermal diffusivity and water content was represented by ∩ shaped curve. It appears to be more logical because with increasing soil moisture, increasing contact points between the soil particles lead to increasing soil bulk density and thermal diffusivity reaching the maximum values of thermal diffusivity at soil field capacity. With more soil moisture, soil particles have less cohesion with water consequently resulting in decreasing soil thermal diffusivity [5, 13].
Also, Ghader 20 estimated soil thermal diffusivity as a function of soil bulk density and soil moisture using quadratic equation. Quadratic equation and exponential equation represent nonlinear regression which are usually used for developing PTFs using statistical regression [27, 28]. On the other hand, no significant difference found between three developed models used for estimating the parameters of the quadratic equation and thermal diffusivity at different values of water content. The correlation coefficient (r) between the parameters of the quadratic equation (b1, b2, and b3) and each of the sand, silt, clay fractions represented as PSD, bulk density, and organic matter is shown in Table 4. It appeared that no correlation found between parameters of the quadratic equations b1, b2 and b3 and soil physical properties. While the parameters of the quadratic equation based only on water content, as well as on the rate of increasing or decreasing soil moisture with soil thermal diffusivity.
| Parameters | Correlation Coefficient | ||||
|---|---|---|---|---|---|
| B.D | O.M | Sand | Silt | Clay | |
| b 1 | 0.25 | - 0.28 | 0.15 | - 0.51 | 0.41 |
| b 2 | - 0.26 | 0.24 | 0.23 | 0.20 | - 0.26 |
| b 3 | - 0.28 | 0.30 | 0.35 | 0.04 | - 0.17 |
Measurements of the soil thermal diffusivity are required for modeling soil heat flux and temperature regime. Those measurements consume both time and money. So it is important to estimate soil thermal diffusivity based on easily available data such as soil moisture, bulk density and soil texture using mathematical models and PTFs.
CONCLUSION
Soil texture is one of the main soil physical properties which effects the volumetric of heat capacity, thermal conductivity, and thermal diffusivity. In general, higher soil thermal diffusivity values were found for silty loam then silty clay loam soils at different water content, soil bulk density, and organic matter. Soil moisture has a great effect on thermal diffusivity. Thermal diffusivity at first increased rapidly with increasing water content then decreased at a slower rate. The relationship between soil thermal diffusivity and soil moisture was described using a quadratic equation. Moreover, the parameters of this equation were calculated by PTFs based on soil physical properties. No correlations were found between the parameters of the quadratic equation b1, b2 and b3 and soil physical properties. The parameters of the quadratic equation are not based on soil physical properties. The PTF of the quadratic equation is the accurate and simple equation for forecasting soil thermal diffusivity for agro-podzolic type of soils genesis.
ETHICS APPROVAL AND CONSENT TO PARTICIPATE
Not applicable.
HUMAN AND ANIMAL RIGHTS
No animals/humans were used for studies that are the basis of this research.
CONSENT FOR PUBLICATION
Not applicable.
CONFLICT OF INTEREST
The authors declare no conflict of interest, financial or otherwise.
ACKNOWLEDGEMENTS
Decleared none.


