All published articles of this journal are available on ScienceDirect.

Planting Date Recommendation for Chili and Tomato Based on Economic Value Prediction of Agricultural Commodities
Abstract
Introduction:
Chili and tomato are a type of fruit vegetable plant that is very often consumed by Indonesians in their daily diet. Fluctuating commodity prices are causing anxiety among consumers, especially farmers. The price of these commodities, especially chilies, has become a major concern for the Indonesian government. Price changes occur due to several factors: product quality, market demand, and production costs. The quality of the product is determined by the growth process of the commodity. If the selling price is influenced by product quality and product quality is influenced by weather, then there is an indirect correlation between price and weather.
Material and Method:
In this study, the selling price of chilies and tomatoes was predicted using a modified Artificial Neural Network algorithm, optimized by a Nested Genetic algorithm.
Results:
The results were then classified to obtain economic price and planting recommendations. The price is said to be economic in value if the selling price is greater than the cost of production. Farmers can use planting recommendations to decide the right planting period, so that there is no harvest failure. In addition, using this information, farmers will not suffer from losses due to selling prices that cannot cover production costs.
Conclusion:
The results obtained from this experiment show that there is a match of the values of economic price and planting date recommendation for chilies and tomatoes, with an accuracy of 81% and 100%, respectively.
1. INTRODUCTION
Chili (Capsicum annuum L.) and tomato (Solanum lycopersicum L.) are one of the fruit vegetables, which are widely used by Indonesians in daily cooking. Indonesians also process chilies and tomatoes and turn them into condiments such as chili sauce and tomato sauce. This study has focused on both of these plants due to their fluctuating prices [1, 2]. This commodity has also become a concern not only in Indonesia but also in other countries. For example, Zhang et al. [3] and Li et al. [4] conducted studies predicting tomato prices in China using a Neural Network algorithm [3, 4]. Firdaus et al. [1] conducted a study in Indonesia and found that chilies and tomatoes are vegetables that have received a lot of public attention because of their fluctuating prices, while Mariyono et al. [2] revealed that chili is an important commodity and an important element in Indonesian cuisine. In addition, the price of chili has also contributed to the increase in inflation rate in the country, such that the price of the commodity has become a major concern for the Government of Indonesia [1, 2, 5]. Tomato is an agricultural commodity that can be eaten raw, cooked or juiced. The tomato has many vitamins, especially vitamin C [6-8]. In addition, tomato juice also has various properties that can potentially cure diseases such as diabetes, as studied by Upritchard et al. [6].
Chili and tomato are a family of plants that have similar growth processes. Agricultural commodities are widely grown in Indonesia, e.g., Bandung Regency. One of the problems faced by tomato farmers is that the quality of the tomato will determine its selling price. The selling price of a commodity is also determined by various factors such as market demand, weather conditions, and planting costs, as discussed by Singh et al. [9]. Weather factors such as rainfall, humidity, temperature, and intensity of sunlight also greatly affect the growth of chilies and tomatoes [10]. Chili and tomato plants grown and harvested in the right season will produce plants with great quality, which will in turn affect their selling price [11]. With weather conditions and prices of agricultural commodities changing frequently, an economic prediction of tomato prices is needed to provide recommendations on the right planting dates, so that the productivity and quality of tomatoes can be expected, and so farmers do not experience crop failure and losses due to selling prices that cannot cover planting costs. Diseases and pests were also found to affect crop quality.
One of the well-known and often used algorithms for time-series predictions is the Artificial Neural Network (ANN) algorithm [12-18]. Many optimization algorithms are used to produce better ANN output, as discussed by Inthachot et al. [12] in their prediction of stock prices in Thailand. Our previous research also employed several algorithms for optimizing ANN [19-24]. One of the optimizations was to implement an ANN hybrid algorithm with a Nested Genetic Algorithm (ANN-NGA) [20]. This algorithm has been compared with other hybrid algorithms in the Soft Computing field for weather prediction, with the ANN-NGA results providing the best weather prediction results compared to ANFIS, Evolving Fuzzy, and Fuzzy EA algorithms. Therefore, this algorithm was applied in this paper albeit for different case studies. In this case, this study is one of our agriculture-related research entities investigating planting date recommendations. Previously, we also supplied planting date recommendations for other food commodities such as rice, corn, and potatoes but these were only based on weather information [19, 20]. Predicted prices have also been carried out in another study [24], but the data was obtained from Jakarta city price data while the weather data was derived from the city of Bandung. Therefore, this study improves upon the findings of previous studies.
In this study, the predicted price of chilies and tomatoes was later classified based on economic price and planting date recommendations. The focus of this paper was to assess the compatibility between economic pricing and planting date recommendations. If the price is considered economic, the chilies and tomatoes will be recommended for planting. To obtain a better result, rainfall data was preprocessed using the best Moving Average type [20, 23]. It is expected that the planting date recommendation information from this study will help the Bandung District Agriculture Office to determine future planting targets and help farmers minimize crop failure and losses due to selling prices that cannot cover production costs.
2. PROPOSED METHOD AND MATERIALS
2.1. Proposed Method
In general, the process undertaken in this study is illustrated in Fig. (1):
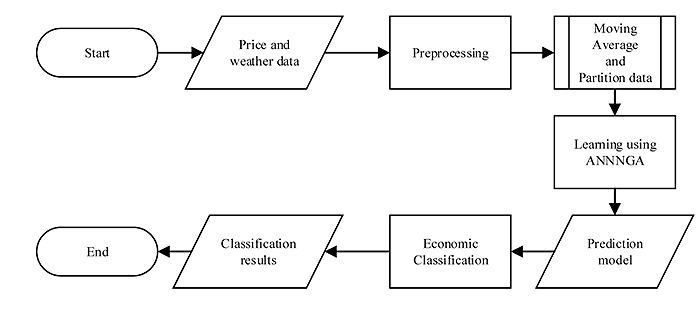
Fig. (1) shows the preprocessing data performed using a Moving Average (MA) algorithm. The only data recorded is rainfall data, while the price data and other weather components used actual data. This is because the value of rainfall is too extreme such that only the MA algorithm can process it. After that, the data is divided into training data and testing data. The learning process was done using the ANN-NGA algorithm. The learning process involved several input parameters for scenario observations and ANNGA parameters, as described in the subsection below. Learning outcomes resulted in the predictive value of chili and tomato prices. Each scenario of training and testing results were evaluated using a Mean Absolute Percentage Error (MAPE) [25]. The smaller the value of MAPE (%), the better the predicted results will be. The best prediction model was chosen from the lowest MAPE value, which was then used for testing or for the prediction process as well as in the process of classification of economic value. In the process of classification, the predicted price was converted into the “economic price category or not”, and “recommendation to plant or not”. The detailed process is explained in Section 2.3.
2.2. Materials
The data used consist of the prices of tomatoes and chilies obtained from the Trade Service of Bandung Regency. The price of loading data from some of the main markets in Bandung Regency was used after which the lowest market price was selected such that it was closer to the farmers’ price. In addition, weather data was also produced from the Meteorology and Climatology Geophysics Agency (BMKG) Bandung for the observation point that is Bandung regency. The weather data components used are rainfall, humidity, wind speed, intensity of sunlight, temperature, and evaporation. The data was then divided into training data (2014–2015) and testing data (2016).
2.3. Economic Value Classification
The process of classifying economic value is the focus of discussion in this paper. The price prediction results from the best prediction model were divided into two categories: “economic or not” and “planting date recommendations or not”. From the results of classification, the suitability was analyzed using the following confusion matrix approach as in Table 1 [26].
| Actual Class (Economic Class) | |||
| Yes | No | ||
| Predicted Class (Planting date recommendation) | Yes | TP | FN |
| No | FP | TN | |
Where, the accuracy of the classification results was calculated using Equation (1):
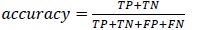 |
(1) |
In this study, the accuracy or compatibility between economic pricing and planting date recommendations was measured using a confusion matrix. Actual class is analogous to economic price class, and predicted class is the class of planting date recommendation. For example, if it is predicted that the price is economic, which means that the farmer does not suffer a loss, then the recommendation for planting will be 'yes'. The classification process is described in the following chart.
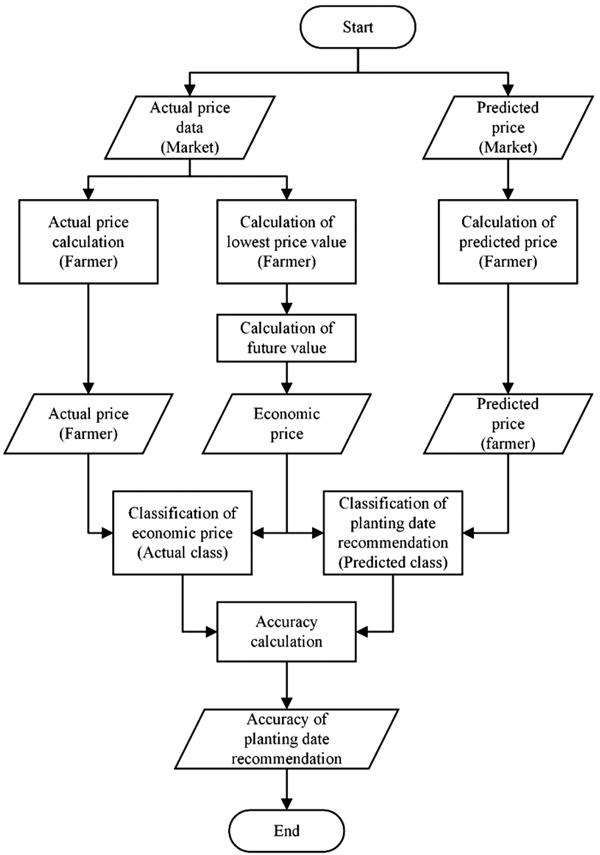
Fig. (2) describes the process of grouping price data into economic class (Yes/No) and planting date recommendation class (Yes/No) following the stages outlined below on:
1. The actual market price data becomes the input to determine the actual price (farmer’s version) that is 50% of the market price. This information is obtained from the results of direct interviews with the Association of Vegetable Farmers in the Bandung Regency. In parallel, the farmer’s lowest price for chili is = 10,000 and the lowest price for tomato = 1,500. The lowest price is the production cost per kilogram. The next step is to calculate the future value (FV) to obtain economic price. FV is calculated according to Equation (2) [24, 27]:
 |
(2) |
Where:
FV = Future Value
P = The lowest price or production cost
r = Average inflation rate (monthly)
Inflation data was obtained from the Indonesian Central Bureau of Statistics. For the year 2014, inflation reached 8.36%. By 2015, inflation decreased to 3.35% and in 2016 inflation continued to decrease to 3.02%. This shows that the average inflation in three years was 4.91%. As a continuous interest rate is used, the inflation average is therefore 4% (in a year), or a monthly average inflation for this problem is r = 0.0033. So, by using Eq. (2), the future value or economic price can be obtained. After the economic price and the actual price (farmer’s version) are both obtained, the classification of economic price can be done, which is YES if the actual price from the farmer is bigger than FV or economic price.
2. In parallel, the calculation of predicted price (farmer’s version) is also done, which is 50% of the market price prediction result. Then, classification of planting date recommendation is done, where YES is the output if the prediction price (farmer’s version) is bigger than FV or economic price.
3. The last process is the measurement of the fit between the class of economic price and the recommendation of planting date using Eq. (1). If the predicted price includes the economic price, the farmer is recommended to plant at that time. Conversely, if the predicted price is not economic, the farmer will experience a loss, so the farmer is not recommended to plant yet.
2.4. Experiment Scenarios
The experiments were conducted with the dataset scenario and parameter observation scenario using ANN-NGA. The predicted value of the price was divided into 2 scenarios, which are; the price one month ahead (Month + 1) and the price in two months to come (Month + 2). Scenario Month + 2 was done because the fastest planting date for chili or tomato plants is 2 months. Therefore, the prediction of price was made for the next two months so that the farmer will know about the tomato price in two months to come. The dataset scenario was divided into three, namely:
- Price and rainfall data (preprocessing using MA)
- Price data and all-weather components
- Tomato or chili history data without weather
Meanwhile, the ANN-NGA parameter observation was done with several scenarios as follows in Table 2.
| Parameter | Value |
|---|---|
| Maximum generation | 3000 |
| Probability crossover (Pc) | [0,7 0,9] |
| Probability mutation (Pm) | [0,1 0,01] |
| Population size (PopSize) | 100 |
| Number of Hidden layer | [1 2] |
| Number of Hidden neuron | [multiples of 5 up to 50] |
| Number of input | [1 2 3] |
3. RESULTS AND DISCUSSION
After experimenting with several test scenarios, a MAPE training result and testing results were obtained, which are outlined in Tables 3 and 4.
From Tables 3 and 4, the lowest MAPE score was obtained for the prediction of one month ahead (Month + 1). As for the prediction results for two months ahead (Month + 2), the MAPE value obtained was greater. This was also influenced by the experimental results; the best number for the month input was obtained by predicting the data of the previous month. So, when there is a skipped month (Month + 2), the predicted results would be quite different than the actual data compared to Month + 1 predictions.
| Commodity | Dataset Scenario | MAPE Training | MAPE Testing | Pc | Pm | #Input | #Hidden Layer | #Hidden Neuron |
|---|---|---|---|---|---|---|---|---|
| Chili | 1 | 44% | 45% | 0,9 | 0,1 | 1 | 2 | 1 |
| 2 | 41% | 42% | 0,9 | 0,01 | 1 | 3 | 1 | |
| 3 | 40% | 40% | 0,9 | 0,01 | 1 | 1 | 2 | |
| Tomato | 1 | 13% | 13% | 0,9 | 0,01 | 1 | 1 | 29 |
| 2 | 14% | 14% | 0,7 | 0,01 | 1 | 1 | 11 | |
| 3 | 14% | 15% | 0,7 | 0,01 | 1 | 1 | 11 |
| Commodity | Dataset Scenario | MAPE Training | MAPE Testing | Pc | Pm | #Input | #Hidden Layer | #Hidden Neuron |
|---|---|---|---|---|---|---|---|---|
| Chili | 1 | 53% | 53% | 0,7 | 0,1 | 1 | 1 | 13 |
| 2 | 50% | 50% | 0,9 | 0,1 | 1 | 1 | 2 | |
| 3 | 57% | 70% | 0,9 | 0,1 | 1 | 2 | 1 | |
| Tomato | 1 | 22% | 23% | 0,9 | 0,1 | 1 | 1 | 1 |
| 2 | 25% | 30% | 0,7 | 0,1 | 1 | 1 | 17 | |
| 3 | 22% | 23% | 0,7 | 0,01 | 1 | 1 | 18 |
The lowest MAPE for chilies was obtained with dataset scenario #3, which was the prediction of the price of chili based only on the price of chili without weather data (40%). However, the MAPE difference was very small with dataset scenario #2 using weather data and chili price history data as input. Therefore, the weather remains a factor that affects the price of chili because the weather determines the productivity and quality of chili while the quality of chili determines the selling price. As for tomatoes, the lowest MAPE was obtained with dataset scenario #1 using rainfall data and historical price data (13%). The MAPE difference between dataset scenarios #2 and #3 was also very small. The scenario with the lowest MAPE value became the best prediction model for the testing or prediction process. The MAPE values of tomato predictions were lower than that of chili. This value could also be influenced by price-addition factors such as market demand, where the price of chili is more expensive than the price of tomato.
For ANN-NGA parameter observation, the best monthly input was obtained from the previous month, with Pc = 0.9, Pm = 0.01, number of hidden layer = 1, and number of hidden neurons for chili = 2 and tomato = 29.
CONCLUSION
This study focused on improving the performance of conformity between planting date recommendations and economic prices for the overall data. Tables 5 and 6 show the results of suitability for chili yielded an accuracy of = 81% while tomato yielded 100%. A value of 100% for tomato accuracy was obtained because all prices were considered economic, so tomato could be planted any time. This can also be due to the price of tomato that is not as expensive as chili.
| Actual Class | |||
| Yes | No | ||
| Predicted Class | Yes | 19 | 2 |
| No | 3 | 2 | |
| Actual Class | |||
| Yes | No | ||
| Predicted Class | Yes | 26 | 0 |
| No | 0 | 0 | |
ETHICS APPROVAL AND CONSENT TO PARTICIPATE
Not applicable.
HUMAN AND ANIMAL RIGHTS
No animals/humans were used for studies that are the basis of this research.
CONSENT FOR PUBLICATION
Not applicable.
CONFLICT OF INTEREST
The authors declare no conflict of interest, financial or otherwise.
ACKNOWLEDGEMENTS
This work was supported by a research grant from the Ministry of Research and Technology of the Directorate General of Higher Education of Indonesia (Letter No. 1603/K4/KM/2017) and Telkom University. In addition, we are especially grateful to the Department of Agriculture and Trade Office of Bandung Regency, as well as to the Bandung Vegetable Farmers Association for providing the data and information required for this study.

