All published articles of this journal are available on ScienceDirect.
Assessment of Rice Panicle Blast Disease Using Airborne Hyperspectral Imagery
Abstract
Rice blast disease occurs in rice production areas all over the world and is the most important disease in Japan. Remote sensing techniques may provide a mean for detecting disease intensity for large area without being subjected to raters. This study evaluated the use of airborne hyperspectral imagery to measure the severity of panicle blast in field crops. Hyperspectral remote sensing imagery was acquired at the dough stage of rice grain development in northern Japan. The most consistent relationship, with high R2 and low P, was the simple band ratio R498 to 515/R700 to 717 (i.e., the reflectance at 498 to 515-nm divided by the reflectance at 700- to 717-nm). The band ratio of R498 to 515/R700 to 717 increased significantly (P < 0.001) with increasing visual estimates of disease incidence, defined as the percentage of diseased spikelets (R2 = 0.83). Assessment of disease distribution and severity could provide useful information for making decisions regarding the necessity of fungicide application and estimate potential yield loss due to the disease.
INTRODUCTION
Rice blast disease, caused by the ascomycete Magnaporthe oryzae B. Couch, is considered to be the most important fungal disease in rice (Oryza sativa L.) because of its worldwide distribution and its destruction [1, 2]. Rice blast causes severe damage under cool summer conditions in northern Japan. The blast fungus affects the leaves, on which it causes diamond-shaped white to gray lesions with dark green to brown borders surrounded by a yellowish halo. After heading, the pathogen invades the panicles and infects the spikelet (spikelet blast), the rachis branch (rachis branch blast), and the neck of the panicle (neck blast). Neck blast is usually the most destructive symptom of the disease [2]. Spores formed in the upper leaf blast lesions are the inoculum responsible for panicle blast. The grain-filling process is remarkably obstructed in these affected panicles and consequently, grain quality and quantity are drastically reduced [2].
The ability to detect rice blast early and quantify severity accurately is one of the fundamental requirements in the assessment and management of rice blast, since timely use of fungicides is one of the most reliable methods of suppressing panicle blast in Japan [3, 4]. Visual assessments are commonly employed by trained pest management staff of local governments in Japan. However, it is impossible to accurately estimate the regional distribution and severity of the disease in large areas, because this method is both labor-intensive and time-consuming. In addition, the ability for raters to accurately detect plant disease may differ, as evidenced by Nutter et al. [5], who reported significant variation among raters in visually assessing dollar spot severity in creeping bentgrass (Agrostis palustris Huds.). Fatigue, lack of concentration, and bias among raters all increase the subjective nature of visual assessments of disease severity [5, 6]. Plants may respond to disease stresses in a number of ways, including leaf curling, stunting, wilting, defoliation, and chlorosis or necrosis of photosynthetic tissues [7]. Furthermore, plant responds to abiotic stress, such as drought, extreme temperatures, edaphic conditions, and high winds. Many of these responses are difficult to quantify and thus make it difficult to assess disease severity visually with acceptable levels of accuracy and speed. However, the aforementioned plant responses to infection often affect the amount and quality of electromagnetic radiation reflected from the plant canopy [7]. This suggests that remote sensing techniques may provide an easily available record of disease severity and a more objective assessment than is possible with visual assessments by raters [8-10]. Several reports have reviewed the use of radiometric remote sensing in plant pathology [11-13].
Previous studies have shown the possibility of assessing leaf and panicle blast of rice using a radiometer [14, 15]. In those studies, the different symptoms of rice blast, leaf and panicle blast, affect reflectance from the rice canopy differently. Two ratios significantly quantified the severity of leaf blast: R550/R675 (the reflectance at 550 nm divided by the reflectance at 675 nm), and R570/R675 [15]. After heading, because the greatest change in spectral reflectance occurred after the yellow-ripe stage, analyses of reflectance responses were divided into two periods, from the flowering to the dough stage and from the yellow-ripe to the maturity stage [14]. Ratios could be used as indicators of panicle blast: R470/R570, R520/R675, and R570/R675 all decreased significantly as the severity of panicle blast increased at the dough stage [14]. At the yellow-ripe stage, R550/R970 and R725/R900 of potted plants were used to estimate the severity of panicle blast in terms of the percentage of diseased spikelets in the laboratory [14]. Thus, ground-based radiometer is effective to assess the severity of rice blast, however this method is not suitable for measuring a lot of fields. Airborne imagery has been useful to detect and assess the disease severity over large crop areas. More studies are necessary to determine whether these ground-based techniques could be extended to airborne or satellite systems.
The advantage of the airborne measurement is to be able to acquire imagery at opportunistic times and has proven useful in assessing disease severity. For example, aerial photographs were used to quantitatively analyze spatial patterns of late blight in irrigated potato circles [16]. Airborne digital imagery was used to distinguish oak wilt disease in a live oak (Quercus fusiformis) population and to assess Rhizoctonia crown and root rot severity in sugar beet [17, 18]. Hyperspectral imagery acquired simultaneously in narrow spectral bands may allow the capture of specific plant attributes previously unavailable from broadband sensors [8]. Coops et al. [9] used airborne hyperspectral imagery to asses Dothistroma needle blight of Pinus radiate D. Don. However, there have been no reports of using airborne sensor data for the detection of panicle blast and measurement of its severity. The objectives of the present research were thus to (i) assess the use of band ratios as an indicator of panicle blast using airborne hyperspectral scanners and (ii) quantify the incidence of rice panicle blast over a wide cropping area.
MATERIALS AND METHODS
Airborne hyperspectral imagery was obtained on 15 September 2003. An image from the AISA Eagle hyperspectral sensor (PASCO Co. Ltd, Tokyo, Japan) with 66 spectral bands (8.56 to 9.12 nm spectral bandwidth) between 430 and 1,000 nm was acquired at the dough stage of rice grain development. Hyperspectral data were acquired at an altitude of 1,440 m, with 1.5-m spatial resolution and a 38° field of view. Imagery was measured under cloudless conditions from 12 p.m. to 2 p.m., when the solar zenith angle was high [17, 19, 20]. Disease incidence was determined by estimating the percentage of diseased spikelets through observation on a field basis. On 18 September 2003, we calculated the percentage of diseased spikelets in 91 fields. Disease incidence was determined by calculating the percentage of diseased spikelets per plant. The values of 150 plants were used to calculate the average value of each field.
The study site was in Sanbongi, Miyagi Prefecture (38.3°N, 140.9°E), Japan, which were paddy fields along a river drainage basin. Rice paddies in the study area ranged from 0.05 to 1.0 ha in size. The predominant cultivars were 'Hitomebore'. Rice seedlings were raised in the nursery for 20 to 30 days, then were transplanted into the fields in mid-May under irrigation at a planting density of 25 to 28 seedlings per square meter. Fertilizer was basally applied at a rate of 40, 13, and 25 kg ha-1 (N, P, and K, respectively) with an additional application at a rate of 10 and 8 kg/ha (N and K) in mid-July. Heading and harvesting dates were in late August and early October, respectively. This region experienced cool in summer and increased rainfall after heading in 2003, creating favorable conditions for panicle blast infection. Panicle blast occurred naturally in study area.
An example of the mean spectral response of a healthy and diseased rice plants in the 400 to 2,000 nm was shown by Kobayashi et al. [15]. As the percentage of diseased spikelets increased, panicle reflectance also increased in the visible (VIS: 400 to 700 nm) and mid-infrared regions (1,300 to 2,000 nm). In the near-infrared (NIR) region (700 to 1,300 nm), reflectance differences between uninfected and infected rice plants were small. Indices of simple ratio for each field were calculated, their usefulness as indicators of disease incidence was assessed using the ERDAS IMAGINE 8.3 software (Leica, Atlanta, GA, USA). A simple ratio index divides the reflectance at one reference band (x) by an index band (y), i.e., x/y. Regression analysis was used to determine whether a significant relationship existed between disease incidence and the single band, band ratio, and normalized difference parameters derived from all bands. The criteria used for model selection was the R2 (coefficient of determination) and P-value (probability). Disease incidence in the study area was predicted using the significant relationship between disease incidence and spectral values.
RESULTS
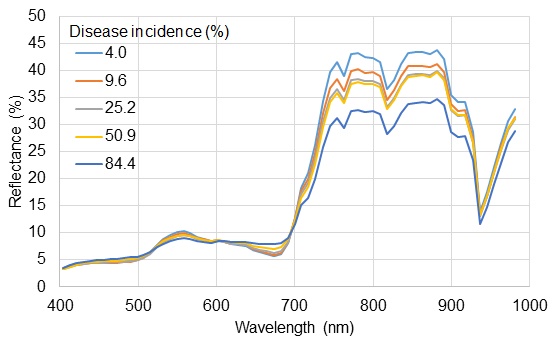
Panicle blast occurred in all fields selected for assessment, and its incidence ranged from 0.4% to 84.4% of diseased incidence. Fig. (1) shows the reflectance spectra of rice fields infected with blast fungus using airborne hyperspectral sensor. As the percentage of diseased spikelets increased, the reflectance of rice plants from field increased in the blue (400 to 510 nm) and red (615 to 700 nm) regions, and decreased in the green (510 to 570 nm) and NIR regions (Fig. 1). Reflectance differences among disease incidences in the VIS region were smaller than the differences observed in NIR region. The general spectral response of diseased rice fields using airborne hyperspectral sensor was roughly similar to the spectral reflectance of diseased rice plants with ground-based radiometer [14].

Spectral reflectance of rice plants infected with blast fungus (Magnaporthe oryzae) at the dough stage from fields in Miyagi Prefecture, Japan. This is from an airborne hyperspectral sensor with 66 spectral bands (8.56 to 9.12 nm spectral bandwidth) between 430 and 1,000 nm. Disease incidence was determined by estimating the percentage of diseased spikelets through observation.
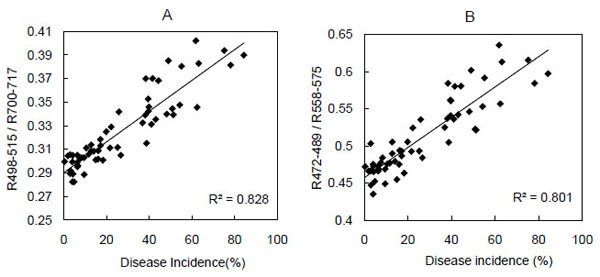
Regression analysis indicated that two band ratios (R498to 515/R700 to 717 and R472 to 489/R558 to 575) increased significantly (P < 0.001) as disease incidence increased (R2 = 0.83 and 0.80) (Fig. 2). The regression coefficients were highly significant, but the coefficient of determination was highest for the regression of the R498 to 515/R700 to 717 ratio and disease incidence.

The relationship between a simple band ratio (y) obtained using data from the hyperspectral sensor and the incidence (x) of rice panicle blast in each field at the dough stage. Disease incidence represents the percentage of diseased spikelets. (A), R498 to 515/R700 to 717: the reflectance at 498- to 515-nm divided by the reflectance at 700- to 717-nm. The regression is y = 0.0013x + 0.2902. P < 0.001. (B), R472 to 489/R558 to 575. The regression is y = 0.002x + 0.4572. P < 0.001.

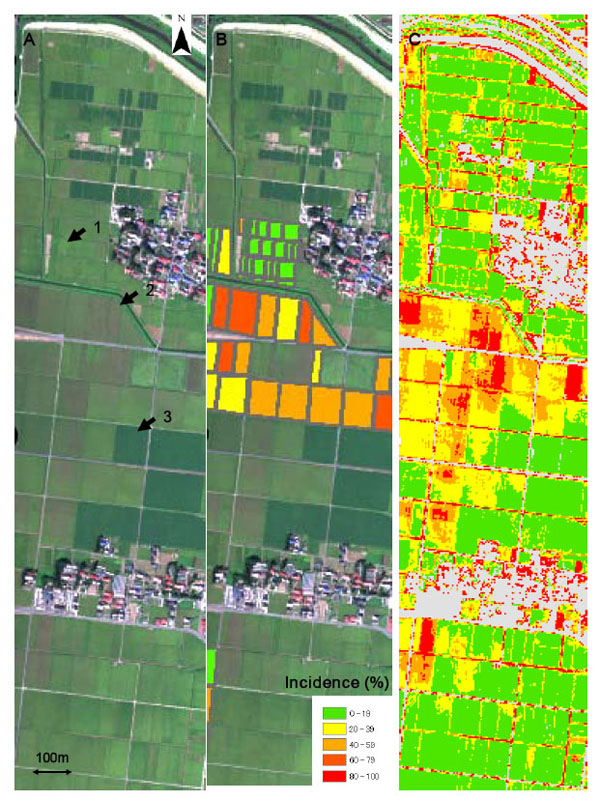
(A) True color composite of the study area with the AISA Eagle hyperspectral sensor bands centered at 655 nm (red), 558 nm (green) and 489 nm (blue). (B) Disease incidence visually assessed by three trained raters. (C) False color composite with the band ratio R498 to 515/R700 to 717. Disease incidence was predicted using the linear regression equation shown in Figure 2A. The arrows in photograph A point to the following fields: arrow 1, healthy rice field at the dough stage; arrow 2, rice field severely affected by panicle blast; arrow 3, a soybean field.
Fig. (3A) shows a true color composite of the study area with the bands centered at 655 nm (red), 558 nm (green) and 489 nm (blue). Mildly affected rice fields are yellow-green (Fig. 3A, arrow 1), whereas severely affected fields have a reddish-brown tone (Fig. 3A, arrow 2). Soybean fields are dark green (Fig. 3A, arrow 3) and can be easily discriminated from the rice fields. Fig. (3A) shows the disease incidence in each field visually assessed by the trained raters. Example of the false-color image of the study area (i.e., predicted disease severity) obtained from the airborne hyperspectral imagery are shown in Figs. (3C). We predicted disease incidence using the linear regression equation shown in Fig. (3C). The comparison between ground truth data and the simple ratio-derived incidence image confirmed the model capacity to predict the disease incidence accurately. Panicle blast was severe in the large fields of the study area (Figs. 3B and 2A). Most of those fields had been used to grow soybeans as the preceding crop.
DISCUSSION AND CONCLUSION
At the dough stage, two band ratios exhibited significant correlations with disease incidence (R498 to 515/R700 to 717 and R472 to 489/R558 to 575). Our results demonstrated that hyperspectral imagery is a potentially useful method for the quantitative assessment of panicle blast incidence. R470/R570 and R570/R675, which were based on sensitivity maxima and minima, were effective in assessing disease severity with a radiometer [14, 21]. Dividing leaf reflectance measured within a stress-sensitive waveband by reflectance measured within a relatively stress-in-sensitive waveband may largely correct variations in irradiance, leaf orientation, irradiance angles, and shading [22]. The wavelengths used in these ratios, which were determined by ground-based measurements, were similar to those in two band ratios (R498 to 515/R700 to 717 and R472 to 489/R558 to 575) identified using our airborne measurements. The results obtained for canopy reflectance with a ground-based radiometer suggest that these bands are also suitable for use in airborne hyperspectral measurements [14].
In speculating about the extension of techniques measured with ground-based radiometry to an airborne system to monitor panicle blast incidence, it is important to remember that the band data acquired from aircraft can be severely affected by atmospheric and measurement conditions such as the sun and view angles. Digital imaging within spectrally narrow ranges such as those provided by a hyperspectral sensor may thus provide an improved capability to detect plant disease [9].
Serious epidemics of rice blast occurred in 1988, 1991, 1993, and 2003 in northern Japan and did considerable damage to the local farm economy. To avoid future supply problems, it is important to be able to roughly predict the yield loss caused by panicle blast that will occur before harvesting. In northern Japan, fungicides are commonly applied to control panicle blast at the booting and full heading stages. If severe panicle blast occurs after heading, additional fungicide will be applied at the milky grain stage. Early detection of panicle blast might thus allow managers to deploy control procedures in a timely fashion. Assessment of disease distribution and severity in near-real-time at the dough stage could provide useful information to support management decisions regarding the necessity for and appropriate timing of fungicide applications.
In the future, leaf blast severity should be assessed using hyperspectral imagery, because the spores from the leaf blast lesions serve as the inoculum that leads to the first panicle blast [15]. As grain ripening advanced after heading, the responses of rice spectral reflectance changed regardless of the degree of blast infection [14]. In particular, because the greatest change in spectral reflectance occurred after the yellow-ripe stage, the indices selected as indicators of disease severity at the dough stage differed from those selected at the yellow-ripe stage with ground-based radiometer [14]. It may be that these ratios selected in this study at the dough stage were not able to assess the panicle blast incidence after yellow-ripe stage. Panicle blast incidence should be assessed using hyperspectral imagery at the yellow-ripe stage. Simulation models of rice growth and rice blast disease will soon be combined with remote-sensing data to produce more accurate severity estimates [3, 4]. Oudemans et al. [23] first used a geographic information system (GIS) combined with remote sensing using satellite multispectral imaging to detect yield losses in cranberry (Vaccinium macrocarpon). Airborne imagery should thus be integrated with GIS to include cultural conditions, crop rotation, and fungicide application data [24, 25].
CONFLICT OF INTEREST
The authors confirm that this article content has no conflict of interest.
ACKNOWLEDGEMENTS
We thank Y. Ohmori, K. Tamura, K. Kudoh, G. Fujimura, K. Hayasaka, Y. Fujisawa, and S. Kikuchi of the Tohoku Agricultural Research Center for their technical assistance.


