All published articles of this journal are available on ScienceDirect.

Quantifying and Comparing Greenhouse Gas Emissions in Monsoon Rice Production: A Comprehensive Analysis of Transplanting and Broadcasting Sowing Methods in Myanmar
Abstract
Introduction
Rice is a staple food, an economic crop, and the second-highest source of greenhouse gas (GHG) emissions in the agricultural sector in Myanmar. To develop the rice sector in a sustainable way, this study aimed to determine the comparative GHG emissions between the two major sowing methods used in monsoon rice production.
Methods
Next, comparative GHG emissions analysis was done by using the Student t-test. This study first quantified GHG emissions from land preparation to straw burning by using emission factors for agricultural inputs and the formulation, default values, and scaling factors of a carbon footprint calculator customized for rice products (CF-Rice).
Results
Soil and water management was the largest contributor among the management practices in monsoon rice production and accounted for 64.8% of the total GHG emissions. At 4,479.5 kg CO2 eq. ha-1, GHG emissions from the broadcasting (BC) method were significantly higher than those from the transplanting (TP) method.
Conclusion
Therefore, the TP method is a better sowing technique than the BC method for reducing GHG emissions without reducing grain yield.
1. INTRODUCTION
Rice occupies approximately 35% of the total cultivated crop area and has the highest proportion among the other crops, with an average yield of 3.86 tons per hectare (t ha-1) in 2020 [1]. As rice is the main staple and economic crop, the government expects to increase exports of rice to at least 6 million metric tons by 2030 [2]. In pursuit of higher productivity, however, it is imperative to consider the associated environmental costs. Rice cultivation accounts for the second-highest share of GHG emissions in the agricultural sector, representing the second-highest proportion (35.77%) of its total national GHG emissions [3]. To achieve sustainable development goals (SDG 2.4) and ensure a balance between the economic, social, and environmental spheres, resource-efficient and low-carbon management practices must be implemented in the agriculture sector [4].
In Myanmar, previous research on GHG emissions has mostly centered on rice fields, examining GHG emissions among various rice varieties [5] and exploring the application of straw and nitrogenous fertilizer [6], as well as organic manure [7] under different water regimes and crop establishment methods [8]. Previous research surveys have focused on comparing GHG emissions by comparing post-harvest and farming practices for producing rice in the wet and dry seasons [9].
In the quantification of GHG emissions from cross-sectional survey data, some researchers applied the life cycle of rice fields [10, 11] based on the Tier 1 methodology of the Intergovernmental Panel on Climate Change (IPCC)) [12]. Other researchers have focused only on CO2 emissions from rice production without considering on-farm emissions (CH4) [13-16]. These research techniques have also been applied to other crops, such as cucumber [17], turnip [18], and wheat [19]. Furthermore, some studies have estimated not only on-farm emissions but also off-farm emissions of GHGs using the IPCC Tier 1 methodology together with the emission coefficients of agricultural inputs [20, 21]. The International Rice Research Institute (IRRI) (2021) developed a tool, the carbon footprint calculator for rice (CF-Rice), to assess the carbon footprint of the rice value chain [22]. The present study followed the guidelines of the tool for crop establishment, soil and water management, N fertilizer management, and straw burning stages. However, the CO2 emissions using the standard emission factors and the farmers’ utilized amounts of P and K fertilizers, pesticides, herbicides [23], fuel [24], and machinery [25] used in tillage and harvesting machine operations were updated and combined.
With the higher usage of N fertilizer and the increasing trend of pesticide utilization [26, 27] in rice production in Myanmar, quantifying GHG emissions from rice production is crucial. A cross-sectional survey of farm households, from seedbed operations to straw burning, is still needed to quantify GHG emissions, by considering specific water management, pre-season aeration, straw incorporation, and organic amendments. GHG emissions estimated in this study covered all emissions from crop establishment to straw burning during monsoon rice production, which is prevalent in Myanmar.
Debates persist regarding the optimal mitigation strategy for reducing GHG emissions in rice cultivation, particularly in the comparison between broadcasting (BC) and transplanting (TP) methods. Studies have yielded conflicting findings on this matter. Rice fields under the BC method were found to emit 5.35% [14] to 31% [28] more total GHGs than those utilizing the TP method. In contrast, the BC method showed a reduction of approximately 59% in total GHGs compared to the method of transplanting with reduced tillage (TP) [29], accompanied by significant decreases of 16.6% and 18.1% in CH4 and N2O emissions, respectively [30]. Therefore, the objectives of this study were to quantify the GHG emissions from land preparation to straw burning utilizing cross-sectional data and to compare GHG emissions between the BC and TP sowing methods in monsoon rice production.
2. MATERIALS AND METHODS
2.1. Estimating On-farm and Off-farm Emissions of Greenhouse Gases
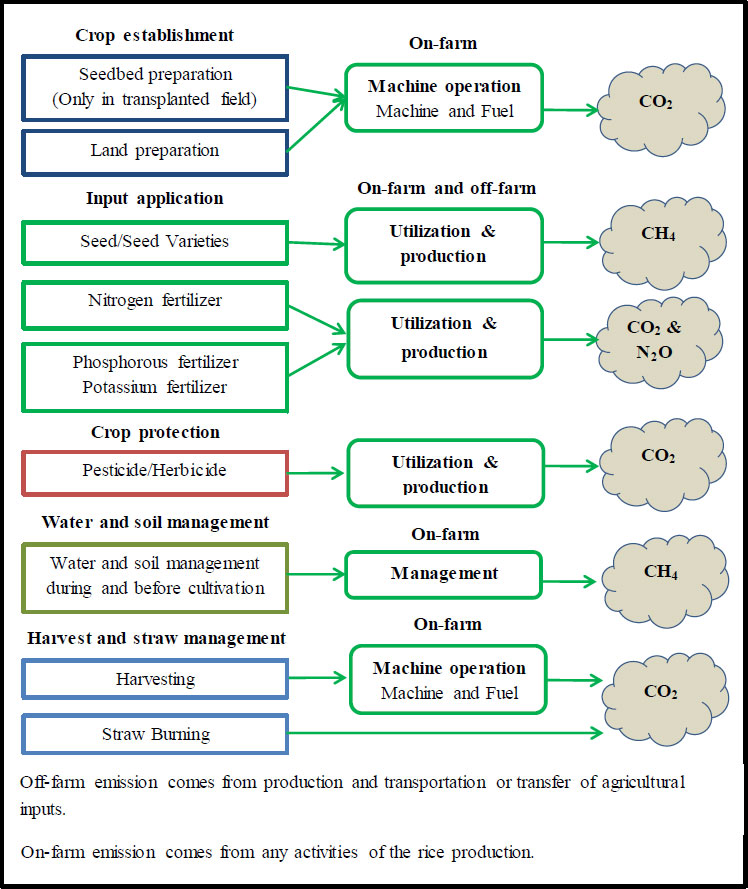
Based on the emission factors for agricultural inputs [23] (Table 1) and CF-Rice’s formulation, default values, and scaling factors [22] (Table 2), this study determined the amount of GHGs emitted from monsoon rice production. According to the Life Cycle Assessment approach guidelines, CF-Rice estimates the carbon footprint, a functional unit of kilogram carbon dioxide equivalent per kilogram of rice (kg CO2 eq. kg-1) based on the IPCC Tier 1 methodology [12]. The functional unit used to estimate GHG emissions in this study was area-based, quantified as kilogram carbon dioxide equivalent per hectare (kg CO2 eq. ha-1). Therefore, all GHGs were converted to CO2 equivalent. Fig. (1) shows the types of GHGs and the range of estimates for GHGs released during rice production, from land tilling to straw burning.
| Input | Emission Factor | Unit | Source |
|---|---|---|---|
| Diesel | 2.76 | kg CO2 eq. L-1 | [24] |
| Machinery | 62.7 | MJ h-1 | [31] |
| - | 0.07 | kg CO2 eq. MJ-1 | [25] |
| Conventional seeds | 1.12 | kg CO2 eq. kg-1 | [22] |
| Hybrid seeds | 2.24 | kg CO2 eq. kg-1 | [22] |
| Herbicides | 6.30 | kg CO2 eq. kg-1 a.i. | [23] |
| Insecticides | 5.10 | kg CO2 eq. kg-1 a.i. | [23] |
| Direct emission from nitrogen fertilizer in continuous flooding | 1.41 | kg CO2 eq. kg-1 N | [22] |
| Direct emission from nitrogen fertilizer in intermittent drainage | 2.34 | kg CO2 eq. kg-1 N | [22] |
| Indirect emission from nitrogen fertilizer | 5.68 | kg CO2 eq. kg-1 N | [22] |
| Phosphorous fertilizer | 0.20 | kg CO2 eq. kg-1 P | [23] |
| Potassium fertilizer | 0.20 | kg CO2 eq. kg-1 K | [23] |
| Activities | Description | Emission Factor | Source | ||
|---|---|---|---|---|---|
| Water regimes during the cultivation period | - | [12] | |||
| Irrigated field | - | - | - | ||
| 1. Single drainage | In the middle and end of the season, water is drained once. | 0.71 | - | ||
| 2. Multiple drainages | Water is drained more than once in addition to end-season drainage. | 0.55 | - | ||
| Water regimes before the cultivation period | - | [12] | |||
| 1. Short aeration | Rice field is not flooded for less than one month | 1.00 | - | ||
| 2. Long aeration | Rice field is not flooded in one to six months. | 0.89 | - | ||
| EFCH4 | Methane emission from rice cultivation in Southeast Asia (kg CH4 ha-1 d-1). | 1.22 | [12] | ||
| EFCO2-CH4 | Carbon dioxide emission converted from methane emission (kg CO2 eq. ha-1 d-1). | 34.16 | [22] | ||
| Straw incorporation | - | [12] | |||
| 1. Long offset | Straw is chopped and incorporated into the soil more than 30 days before flooding. | 0.19 | - | ||
| Organic amendments | - | [12] | |||
| 1. Farmyard manure | A mixture of decomposed dung, urine, litter, and waste from the roughage and fodder that animals eat. | 0.21 | - | ||
| 2. Compost | A decayed organic material resulting from the decomposition of plant, food, and manure waste. | 0.17 | - | ||
2.2. GHG Emissions from Machine Operations
Machine operations included preparing land for seedbeds in the TP and fields in both the BC and TP methods for the main rice fields. Seedbed preparation is required to raise seedlings using the TP method. In the BC method, seeds are directly broadcasted in the field. Fuel represents a direct source of CO2 emissions, the quantity of which depends on the plowing depth, tractor speed, and types of equipment used. Machinery depends on the duration of working hour for preparation. Machine hours are converted into energy (MJ h-1) [31], which is then further converted into carbon dioxide emissions using an emission factor for energy (kg CO2 eq. MJ-1) [23]. The amounts of CO2 released during the preparation of seedbeds and land were determined using Eqs. (1 and 2), respectively [23, 31]:
 |
(1) |
 |
(2) |
where
 is the CO2 emissions from seedbed preparation, Fuel_RateSeedbed is the amount of fuel used to prepare seedbeds (L ha-1), EFFuel is the emission factor of fuel, Machine_TimeSeedbed is the duration of machine use for seedbed preparation (h ha-1), CFMachine is the conversion factor of machine hours to a unit of energy (MJ h-1), and EFMachine is the emission factor of machinery usage (kg CO2 eq. MJ-1),
 is the CO2 emissions from field preparation, Fuel_RateField is the amount of fuel used in rice field preparation (L ha-1), and Machine_TimeField is the duration of machine use for rice field preparation (h ha-1).
2.3. GHG Emissions from Seed Input in Rice Production
Emissions from the production of seed inputs differed between conventional and hybrid seed production. CO2 emissions from seed input were calculated according to Eq. (3) [22]:
 |
(3) |
where
 is the CO2 emission from the production of seed input, Seed_Rate is the rate of seed input (kg ha-1), and EFSeed is the emission factor from the production of seed input (kg CO2 eq. kg-1).
2.4. GHG Emissions from Fertilizer Inputs in Rice Production
N, P, and K fertilizers are the main fertilizers used in rice production. Farmers also use S, Mg, Fe, Zn, and Bo. However, this study only considered emissions from N, P, and K fertilizers. It is noteworthy that N fertilizer contributes to both direct N2O emissions upon application to rice fields and indirect CO2 emissions due to its production, transportation, formulation, storage, distribution, and application. P and K fertilizers exclusively cause indirect CO2 emissions stemming from their manufacturing and utilization processes [23]. CO2 emissions from fertilizer inputs in rice production were calculated according to Eq. (4) [22, 23]:
 |
(4) |
where
 is the CO2 emissions from the fertilizer inputs, NFer_Rate is the rate of N fertilizer application (kg N ha-1), EFCO2-N2O is the emission factor for direct N2O emission from N fertilizer (kg CO2 eq. kg-1 N), EFCO2_N is the emission factor for indirect CO2 emissions associated with N fertilizer (kg CO2 eq. kg-1 N), PFer_Rate is the rate of P fertilizer application (kg P ha-1), EFCO2_P is the emission factor for P fertilizer (kg CO2 eq. kg-1 P), KFer_Rate is the rate of K fertilizer application (kg K ha-1), and EFCO2_K is the emission factor for K fertilizer (kg CO2 eq. kg-1 K).
2.5. GHG Emissions from Biocides for Protecting Rice Crops
The production, transportation, formulation, storage, distribution, and application phases of pesticides and herbicides cause the emissions of CO2 and other GHGs. The CO2 emissions associated with the use of biocides for the protection of crops during rice production were calculated according to Eq. (5) [23]:
 |
(5) |
where
 is the CO2 emission from the production of pesticides and herbicides, Pesticide_Rate is the rate of pesticide application (kg active ingredient (a.i). ha-1), EFPesticide is the emission factor linked to the production of pesticides (kg CO2 eq. kg-1 a.i.), Herbicide_Rate is the rate of herbicide application (kg a.i. ha-1), and EFHerbicide is the emission factor for the production of herbicides (kg CO2 eq. kg-1 a.i.).
2.6. GHG Emissions Converted from CH4 Emissions from Soil and Water Management
CH4 emissions during water and soil management in rice production primarily stem from soil flooding and can be calculated based on the daily emission factors, encompassing water management, pre-season management, and organic amendments during the cultivation period. The assessment of CO2 emissions from soil and water management involved the conversion of CH4 emissions to CO2 emissions using a conversion factor. Eq. (6) was employed for the quantification of CO2 emissions from soil and water management, based on the scaling and emission factors from the IPCC Tier 1 methodology [12] and CF-Rice [22].
 |
(6) |
where
 is the CO2 emissions converted from CH4 emissions in rice fields due to soil and water management, EFCO2-CH4 is the CH4 emission from soils converted to CO2e (kg CO2 eq. ha-1 d-1) [22], Cult_Per is the cultivation period of the rice (days), ScFW is the scaling factor for water regimes during the cultivation period, ScFp is the scaling factor for water regimes in the season before the cultivation period, ROAStraw is the application rate of straw (t ha-1), CFOAStraw is the conversion factor for straw amendment in terms of time before cultivation, ROAAdd_Org is the application rate of compost, farm yard manure and green manure (t ha-1), and CFOAAdd_Org is the conversion factor for compost, farm yard manure, and green manure. The exponent of 0.59 refers to an uncertainty range of 0.54-0.64 as an average.
2.7. GHG Emissions from Harvesting
Combined harvesters are a widespread and popular harvesting method in Myanmar. To determine the GHG emissions linked to harvesting operations, the quantities of fuel and machinery utilized were multiplied by the corresponding emission factors described in Eq. (7) [23]:
 |
(7) |
where
 is the CO2 emission from harvesting.
2.8. GHG Emission from Straw Burning
CO2 is released as a greenhouse gas when rice straw is burned after harvesting. The calculation of CO2 emissions resulting from straw burning was done using Eq. (8):
 |
(8) |
where
 is the CO2 emission from straw burning, Straw_Rate is the amount of rice straw, and EFStraw is the emission factor for straw burning (kg CO2 eq. t-1). Approximately 66% of the farmers initially harvested the straw for use as cattle feed but later burned the remaining portion, totaling 1.50 t ha-1 of rice straw (default straw amount used in the Philippines as per CF-Rice). The remaining farm households (about 34%) burned a total of 3 t ha-1 of rice straw.
2.9. Description of the Study Area and Data Collection
Nay Pyi Taw Union Territory, the administrative capital of Myanmar, was selected as the study area due to previous reports [32, 33] highlighting the excessive use of N fertilizer, the second largest source of GHG emissions, above rates recommended by the Land Use Division of the Ministry of Agriculture, Livestock, and Irrigation for rice fields, namely 102 Kg N ha-1, 90 Kg N ha-1, and 57 Kg N ha-1 for low, medium, and high fertility conditions, respectively. In lowland areas, the main rice production area in Myanmar [32], < 70 Kg N ha-1 of N fertilizer is used. By comparison, in the Nay Pyi Taw and Taungoo Regions of central Myanmar, nitrogen application rates of > 100 Kg N ha-1 [33] and > 115 N ha-1 have been reported, respectively. Despite being situated in a dry zone, this region exhibits a subtropical climate with a high annual drought index, an annual rainfall range of 859 to 1,273 mm, an annual temperature range of 23.4 to 34.4°C, and relative humidity between 72% and 75% [34, 35].
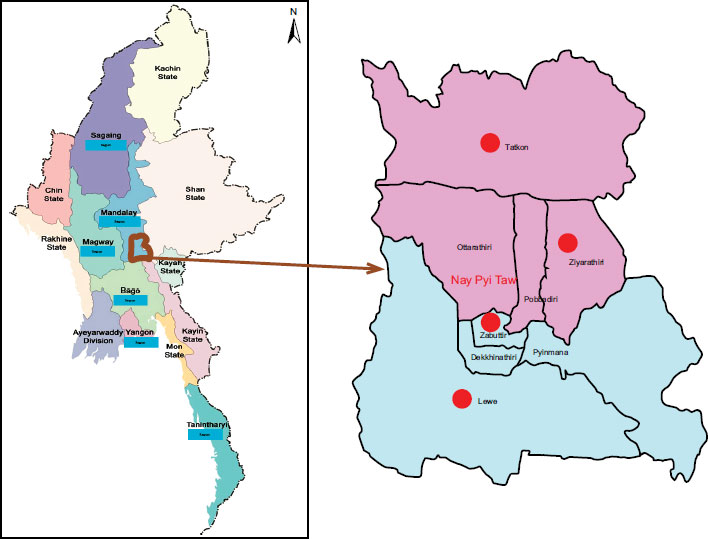
The Nay Pyi Taw Union Territory comprises two districts, Ottarathiri and Dekkhinathiri, each further divided into four townships. Ottarathiri District consists of Tatkon, Zeyarthiri, Ottarathiri, and Pobbathiri Townships, while Dekkhinathiri District encompasses Pyinmana, Lewe, Zabuthiri, and Dekkhinathiri Townships. For data collection, Tatkon and Lewe Townships were selected as they had large sown areas. Zabuthiri and Zeyarthiri Townships were selected based on their comprehensive adoption of all cultivation practices (Fig. 2). Rice is the major crop in these townships, covering an extensive area of approximately 69,623 ha, roughly 48% of the total cropland. The average rice yield in the year 2020 was 4.70 t ha-1. Monsoon rice is cultivated in 90% of the total rice sown area, with summer rice accounting for the remaining 10%. Cultivation practices for rice production include broadcasting (69%), direct seeding with a seeder (16.8%), transplanting by seedlings raised in the field (8.75%), transplanting by seedlings raised in the bed (3.24%), line sowing (1.91%), rice transplanting machine (0.15%), and the system of rice intensification (0.02%) [36].
Detailed information on rice production was systematically collected from a randomly selected group of 317 farmers who willingly participated in interviews and completed structured questionnaires between January and May 2022. The questionnaires were designed to elicit in-depth information on rice production in the four townships, covering aspects such as the amount of fuel used for irrigation, seedbed and land preparation, as well as harvesting. They also addressed the number of seeds sown, the application rates of N, P, and K fertilizers, pesticides, and herbicides, details on water management, soil management of straw and organic matter, and practices related to straw burning. The operational duration of machinery used for tillage and harvesting was also determined. Owing to the limitations of this study, respondents from the sampled farm households were asked about the fate of the rice straw: whether it was used as cattle feed, incorporated into the soil, or burned. In cases where straw incorporation was reported, the time of incorporation was noted. Farmers could not precisely estimate the amount of straw left in the rice fields. Therefore, the present study used a predetermined value of straw amount (3 t ha-1), specifically tailored to the Philippines [22].
2.10. Statistical Analysis
The mean and median values of fuel, machinery, seed inputs, biocides, and N, P, and K fertilizers used in rice production were determined using summary statistics. Frequencies and proportions were calculated to summarize categorical variables related to sowing techniques, soil and water management practices, training attendance, and attitudes toward alternate wetting and drainage practices. Statistical differences between the BC and TP sowing methods were calculated using the Student t-test.
3. RESULTS AND DISCUSSION
3.1. Cultural Management Practices of Sample Farmers in Monsoon Rice Production
The management practices in monsoon rice production are listed in Table 3. The most employed tillage system in the study area involved a combination of machines (tractors or power tillers) and draft cattle (80.1%). The first and second steps involved plowing and harrowing by machines, respectively, while the third step involved leveling with draft cattle. A total of five rice varieties are grown in the area,
| Items | Number | Items | Number |
|---|---|---|---|
| Double rice cultivation | 89 (28.1) | Irrigated-multiple drainages | 237 (74.8) |
| Single rice cultivation | 228 (71.9) | Pre-season aeration | - |
| Land preparation | - | Short | 89 (28.1) |
| Animal-drawn | 9 (2.84) | Long | 228 (71.9) |
| Mechanical | 54 (17.0) | Straw incorporation_Long | - |
| Animal-drawn + Mechanical | 254 (80.1) | Long offset (> 1 month) | 109 (34.7) |
| Choice of seed | - | Organic amendments | - |
| Ayamin (130-145 d) | 23 (7.26) | Compost | 16 (5.05) |
| Manawthukha (135-155 d) | 267 (84.2) | Farmyard manure | 133 (42.0) |
| Pearlthwe (105 d) | 6 (1.89) | No utilization | 168 (53.0) |
| Thaihnankaut (110 d) | 20 (6.31) | Harvesting | - |
| Thukhahmwe (140 d) | 1 (0.32) | Manual harvesting | 5 (1.58) |
| Sowing technique | - | Combine harvester | 312 (98.4) |
| Transplanted | 66 (20.8) | Straw burning | 207 (65.3) |
| Broadcasting | 251 (79.2) | 50% of straw | 137 (66.2) |
| Water management | - | 100% of straw | 70 (33.8) |
| Irrigated-single drainage | 80 (25.2) | - | - |
| Activities | Mean Value | Std. Dev. | Range | Percent (%) |
|---|---|---|---|---|
| Machine operations | - | - | - | - |
| Seedbed preparation | 1.97 | 7.11 | 0.00 – 78.2 | 0.04 |
| Field land preparation | 154.1 | 71.2 | 0.00 – 542.5 | 3.47 |
| Crop establishment and protection | ||||
| Seed input | 87.7 | 36.6 | 31.4 – 157.0 | 1.97 |
| Pesticide and herbicide use | 3.59 | 2.60 | 0.00 – 20.0 | 0.08 |
| Soil and water management | 2,878.9 | 572.8 | 1,839.4 – 5,180.8 | 64.8 |
| Fertilizer management | - | - | - | - |
| Inorganic fertilizer use | 641.3 | 335.1 | 122.3 – 2,436.8 | 14.4 |
| Harvesting | 97.8 | 7.55 | 47.8 – 125.2 | 2.2 |
| Straw burning | 580.1 | 205.6 | 433.5 – 867.0 | 13.1 |
| Total emission (kg CO2 eq. ha-1) | 4,446.9 | 665.8 | 2,698.2 – 6,665.6 | 95.5 |
| Yield (kg ha-1 ) | 4,670.5 | 776.3 | 2,523.1 – 6,167.6 | 776.3 |
Table 5.
| Inputs | Broadcasting (N = 251) | Transplanting (N = 66) | t-value | ||
|---|---|---|---|---|---|
| Amount |
GHG (kgCO2eq.ha-1) |
Amount |
GHG (kgCO2eq.ha-1) |
||
| Machine operations | - | 162.1 | - | 133.2 | -2.94*** |
| Seedbed preparation | - | - | - | - | - |
| Fuel (L) | - | - | 0.60 | 6.26 | - |
| Machinery (h) | - | - | 0.72 | 3.20 | - |
| Field land preparation | - | - | - | - | - |
| Fuel (L) | 12.3 | 128.1 | 9.09 | 95.0 | - |
| Machinery (h) | 7.63 | 34.0 | 6.47 | 28.8 | - |
| Crop establishment and protection | - | 102.4 | - | 49.0 | -18.1*** |
| Seed (kg) | 86.90 | 98.6 | 40.78 | 46.2 | - |
| Pesticide (kg a.i) | 0.30 | 1.51 | 0.32 | 1.62 | - |
| Herbicide (kg a.i) | 0.36 | 2.28 | 0.19 | 1.22 | - |
| Soil and water management | 2,884.0 | - | 2,859.4 | -0.35 | |
| Fertilizer management | - | 637.3 | - | 656.7 | 0.42 |
| Nitrogen (kg) | 78.6 | 630.7 | 81.1 | 650.1 | - |
| Phosphorus (kg) | 17.6 | 3.52 | 19.6 | 3.91 | - |
| Potassium (kg) | 15.3 | 3.07 | 13.5 | 2.71 | - |
| Harvest and Post-harvest | 693.8 | - | 587.7 | -4.31*** | |
| Harvest | - | - | - | - | - |
| Fuel (L) | 7.25 | 75.7 | 7.30 | 76.2 | - |
| Machinery (h) | 4.94 | 22.0 | 4.94 | 22.0 | - |
| Straw Burning | 2.06 | 596.1 | 1.69 | 489.4 | - |
| Total emission | - | 4,479.5 | - | 4,286.1 | -3.02*** |
| Yield (kg ha-1) | 4,617.6 | - | 4,872.1 | - | 2.39*** |
Source: Field survey (2022).
including four high-yielding varieties (Ayamin, Manaw- thukha, Thaihnankaut, and Thukhahmwe) and one hybrid variety (Pearlthwe), which is grown by about 1.89% of the farmers. About 34.7% of the farmers incorporated straw into the field for more than one month, while the other 65.3% burned the rice straw after harvesting. More than 50% of the sampled farmers did not use organic matter for soil management. Farmyard manure was the most used organic matter in the study area, with an average amount of 2.74 t ha-1 in the TP and 2.21 t ha-1 in the BC method. Due to the plant lodging, only five farmers (1.58%) manually harvested the rice fields in the study region.
3.2. Greenhouse Gas Emission Sources in Monsoon Rice Production
Table 4 displays the descriptive statistics of GHG emissions from monsoon rice production. Among the cultural management activities, soil and water management were the biggest contributors to GHG emissions, accounting for 64.8% of the total GHG emissions. Inorganic fertilizer management and straw burning accounted for 14.4% and 13.1% of total GHG emissions, respectively. Activities that accounted for < 5% of emissions included seedbed preparation, land preparation, seed input, biocide utilization, and harvesting. Together, these activities accounted for < 10% of emissions. Similar to the findings of Arunrat et al. [38], methane emissions from soil and water management were the highest. However, the second and third major sources of GHG emissions differed from their study. In this research, soil and water management accounted for about 72% of emissions, the burning of rice straw and stubble accounted for 14%, and the use of chemical fertilizer accounted for 11%. Other rice production practices accounted for < 5% of emissions [38]. The difference could be explained by the fact that 66.2% of farmers in this study used the harvested straw for cattle feed, with the amount assumed to be half of the total.
3.3. Comparison of Input Inventory, Greenhouse Gas Emissions, and Yield between BC and TP Sowing Methods
The comparison of input inventories and GHG emissions from monsoon rice production between BC and TP sowing methods is provided in Table 5. For the TP method, seedbed and field preparation emissions were 9.46 kg CO2 eq. ha-1 and 123.8 kg CO2 eq. ha-1, respectively. These emissions were still less compared to the BC method (162.1 kg CO2 eq. ha-1). The emission from crop establishment and protection under the BC method (102.4 kg CO2 eq. ha-1) was significantly higher than that of the TP method (49.0 kg CO2 eq. ha-1) at a 1% significance level. This difference can be attributed to the BC method using more seeds and herbicides than the TP method. It was found that farmers using the BC method employed twice as many herbicides as those using the TP method. This result aligns with the findings of Saha et al. (2021), who found that the BC method had a higher weed density compared to other direct-seeding methods such as line-seeding or drill seeding methods because of non-uniform crop stand in the former [39]. The total GHG emission from the BC method was significantly greater than that of the TP method, totaling 4,286.1 kg CO2 eq. ha-1, at a 1% significance level. This result is consistent with findings from a field experiment in 2020 where GHG emissions from plots with the line-sowing method increased by 21% for continuous flooding and 22% for the alternate wetting and drying method when compared to the TP method [28]. Rice yields were approximately 4,872.1 kg ha-1 and 4,617.6 kg ha-1 using the TP and BC methods, respectively. The differences between the two sowing methods were statistically significant at a 1% significance level. Thus, the TP method is a more effective sowing method than the BC method for reducing GHG emissions while increasing rice yield.
CONCLUSION
This study assessed greenhouse gas emissions from monsoon rice production in the Nay Pyi Taw Union Territory. The data comprised inputs, cultural management practices, and outputs from a sample of 317 farmers. Emissions from soil and water management were the highest among the various management practices. Although emissions from soil, water, and fertilizer management were not significantly different between the two sowing methods, those from machine operations, crop establishment and protection, harvesting, and post-harvest management were significantly lower under the TP method. In conclusion, the TP sowing method is an environmentally beneficial option that also leads to an increase in rice yield. To simultaneously mitigate detrimental environmental effects and improve rice yield, the government should encourage the expansion of the TP sowing method in monsoon rice production by highlighting its inherent advantages through field demonstrations and training.
ABBREVIATIONS
| GHG | = Greenhouse Gas |
| TP | = Transplanting |
CONSENT FOR PUBLICATION
Not applicable.
AVAILABILITY OF DATA AND MATERIALS
The data presented in this study are available on request from the corresponding author [M.M]. The data are not publicly available due to confidentiality require-ments for the thesis.
FUNDING
This research was funded by the Southeast Asian Regional Center for Graduate Study and Research in Agriculture (SEARCA), Philippines. The article processing charge was not funded.
CONFLICT OF INTEREST
The authors declare no conflict of interest, financial or otherwise.
ACKNOWLEDGEMENTS
Declared none.

