All published articles of this journal are available on ScienceDirect.
Enhancing NPK Uptake and Biomass of Blueberries in Alluvial Clay Soil Using Biochar and Compost
Abstract
Background:
The Mekong Delta features acidic clay soil of alluvial origin with a soil texture ranging from silty clay to clay. The growth of wild blueberry plants in clay soils requires the addition of materials to enhance soil porosity and aeration.
Objective:
The objective of this study was to examine the effects of the combined use of biochar and compost on the growth, yield, and NPK uptake of blueberry ( Vaccinium tenellum) cultivated in the Mekong Delta.
Methods:
The pot experiment had a 3 × 3 factorial design, containing the application of biochar at 0, 10, and 20 t ha -1 (B0, B10, and B20, respectively), compost at 0, 5, and 10 t ha -1 (C0, C5, and C10, respectively), and NPK at 45:20:20 kgha -1 according to the growth stages of blueberries.
Results:
The interaction between biochar and compost provided a more efficient response in terms of plant growth, yield, and NPK uptake. Notably, in the combined application of B20 and C10, NPK uptake and biomass of blueberries were significantly increased. However, only the concentration (gkg -1) of N (14.8) and K (3.82), except for P (1.37), in the blueberry leaves were below the Trevett threshold.
Conclusion:
This approach effectively mitigates the challenges posed by high clay content in the soil, which results in poorer soil porosity and aeration. The findings emphasize the potential benefits of tailored soil amendment strategies to optimize blueberry cultivation in similar environments.
1. INTRODUCTION
Blueberry is a plant native to North America that has successfully grown in Vietnam [ 1]. Blueberry fruits contain many nutritional compounds and are a valuable source of raw materials for the pharmaceutical and functional food industries. Blueberries contain a large amount of anthocyanins, flavonols, and flavonoids [ 2], so they are used for medicinal purposes and functional foods [ 3, 4]. Blueberry plants grow best in full sun, requiring a temperature of 20–30 °C for growing, and their optimal growth occurs on well-draining soil with a pH of 4.5–5 [ 5].
The soil in the Mekong Delta (MD) consists of three main types (alluvial, acid sulfate, and saline); alluvial soils are located along the main river, accounting for 31% of the MD area, whereas acid sulfate soils account for 41% of the MD area [ 6, 7]. The average pH and base saturation values (n = 237) in the topsoil of alluvial soil were 5.08 and 66.2%, respectively, and those in acid sulfate soil (ASS; n = 79) were 3.99 and 28.5%, respectively [ 5-8]; this could be attributed to the acidity imparted from the oxidation of pyrite in ASS [ 9]. In MD, blueberry is a widely distributed plant with ornamental flowers. Most soils in the MD contain kaolinite, illite, and montmorillonite in the clay fraction. Over 30% of soil possesses a silty clay-to-clay texture, which is a characteristic inherited from parent materials [ 10, 11], making it poorly drained [ 12, 13]. Consequently, the growth of wild blueberry plants in clay soils requires large amounts of organic matter (OM) [ 14]. A study on alluvial acidic soil in MD showed that both rates of biochar and compost (4 and 6 tons ha -1 year –1, respectively) could improve soil organic matter (SOM) and phosphorus availability, which can contribute to more stems and leaves in blueberry plants after 12 months of planting [ 15]. In MD alluvial soil conditions with high clay content, although blueberries can produce flowers and fruits, fruit density and blueberry yield are low. Therefore, it is necessary to research to improve the disadvantages of clay-rich soils for blueberry growth on alluvial soils in the Mekong Delta.
Biochar is a carbon-rich product obtained from biomass pyrolysis in an oxygen-limited environment [ 16, 17], and nowadays, it attracts significant attention among researchers and farmers due to its various benefits [ 18, 19]. Owing to its high surface area and porous nature, biochar application to soil increases its microbial activity, ion exchange, capacity, soil nutrient availability, and water retention [ 20-22]. Biochar also benefits crops by adding SOM and mineral elements to the soil [ 23], which results in a high rate of nutrient transformation and utilization efficiency [ 24, 25]. A biochar application rate of over 10 tons ha −1 has been recommended to achieve a noticeable effect on P availability in soil [ 26]. It may also have some other benefits for soil microorganisms while suppressing soil parasites [ 27].
Some recent studies have indicated that applying a compost-biochar combination positively synergizes soil physicochemical characteristics and microbiological properties, significantly enhancing crop growth and improving field conditions [ 28].
Although many studies have focused on blueberry plants with individual or combined applications of biochar and compost fertilizers, most of these studies have been conducted on sandy soils. The novelty of the research is growing blueberries on acidic clay soil. Therefore, the aim of the study was to determine the best method of using biochar and compost to achieve high growth and yield for blueberries grown in acidic clay soil.
2. MATERIALS AND METHODS
To achieve the objective, a greenhouse pot experiment was conducted by growing blueberry plants ( Vaccinium tenellum) in the alluvial clay soil of MD, which was then analyzed for the effects of the combination of biochar and compost on improving plant growth and NPK uptake better than compost or biochar alone.
2.1. Study Site, Soil, and Climate
The soil (Gleyic Anthrosols) [ 29] was collected for the pot experiment from a location in Dong Thanh commune, Chau Thanh district, Hau Giang Province, Vietnam (9°51′48.8″N, 105°47′21.8″E), and the physicochemical characteristics of the soil are listed in Table 1.
| Parameters | Unit | Depth (cm) | ||
|---|---|---|---|---|
| 0–20 | - | 20–40 | ||
| pH H2O | - | 5.62 | - | 6.01 |
| EC | mS cm −1 | 0.13 | - | 0.14 |
| Available phosphorus | mg kg −1 | 19.1 | - | 8.87 |
| Soil organic matter | % | 3.11 | - | 1.32 |
| CEC | cmol c kg −1 | 21.9 | - | 23.9 |
| Exchangeable cations | - | - | - | - |
| K + | cmol c kg −1 | 0.58 | - | 0.47 |
| Ca 2+ | 10.2 | - | 10.7 | |
| Mg 2+ | 4.66 | - | 6.95 | |
| Bulk density | g cm −3 | 1.13 | - | 1.1 |
| Soil texture | - | - | - | - |
| Sand | % | 0.3 | - | 0.7 |
| Silt | 43.2 | - | 33.7 | |
| Clay | 56.5 | - | 65.6 | |
| Soil textural class | - | silty clay | - | clay |
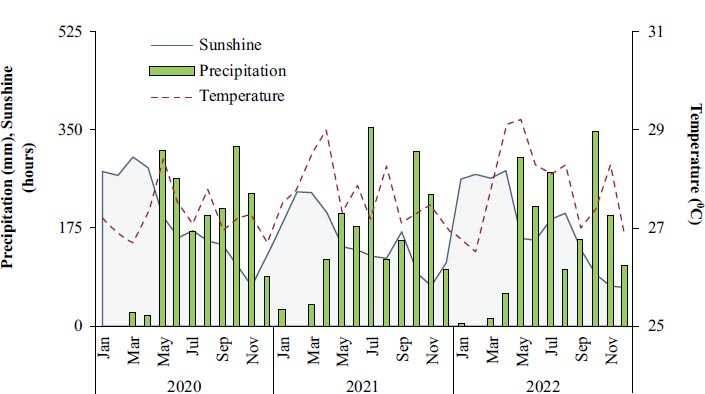
The average monthly temperature during 2020–2022 was 28 °C, with May usually having the highest temperature (29 °C) and January having the lowest temperature (26 °C). The average monthly rainfall during 2019–2021 was 175 mm, with the highest rain in September (300 mm) and the lowest in January (10 mm). The meteorological data for the study locations are shown in Fig. ( 1).
2.2. Varieties of Blueberry
Blueberry varieties used in the experiments were sourced from the Center of Agricultural Crops, Vietnam National University of Agriculture [ 1]. Some varieties have been evaluated for suitable growth in greenhouses, produced from the micropropagation project in the Laboratory of Biochemistry of Can Tho University.
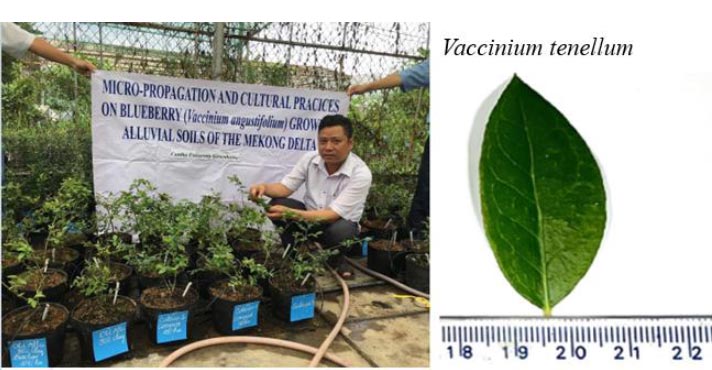
Three-year-old blueberry plants ( Vaccinium tenellum) used in this greenhouse experiment (Fig. 2a, b) were obtained from a micropropagation project. To identify the genus name of the blueberries, young leaves of the genus Blueberry were used to extract DNA based on Rogers and Bendich [ 30]. DNA was extracted at the Laboratory of Molecular Biology, Biotechnology Research and Development Institute, Vietnam. Using the Basic Local Alignment Search Tool, the Internal transcribed spacer (ITS) gene sequence of the blueberry samples was compared with the gene sequences of other species in the National Center for Biotechnology Information’s GenBank database. The results showed that the ITS gene sequence of the blueberry sample was similar to the sequence of the species AF273709.1 [ 31], as determined by Quynh, i.e., 96.84% [ 32]. Vaccinium tenellum is a species of shrub in the family Ericaceae [ 33].
2.3. Experimental Design
The pot experiment started in June 2021, was performed in the greenhouse of Can Tho University, and was laid out in a factorial randomized block design (RBD) with two alterations: (a) three levels of biochar (0, 10, and 20 t ha -1) and (b) three levels of compost (0, 5, and 10 t ha -1) (Table 2). Each treatment was replicated four times. The distance between the pots was 30 cm × 30 cm.
N, P, and K fertilizers were applied as described by Marty et al. [ 34] as follows: 45 kg N ha -1, 20 kg ha -1 P 2O 5, and 20 kg ha -1 K 2O. The single fertilizers used were ammonium sulfate (21% N), triple superphosphate (45% P 2O 5), and potassium sulfate (52% K 2O). Ammonium sulfate was used to fertilize blueberries because its ammonia form is absorbed by plants more efficiently than nitrate [ 35, 36].
| Factor Levels | Amount of Compost Applied (t ha -1) | ||
|---|---|---|---|
| Amount of biochar applied (t ha -1) | 0 | 5 | 10 |
| 0 | TRT-1 | TRT-2 | TRT-3 |
| 10
20 |
TRT- 4
TRT-7 |
TRT-5
TRT-8 |
TRT-6
TRT-9 |
As recommended by Rutgers University [ 37], in this study, the application of N fertilizer was split into three timings: first during 3–4 weeks after bud-break (April 10 th, 2023), second during 7–8 weeks after bud-break (May 10 th, 2023), and third during 11–12 weeks after bud-break (June 10 th, 2023). P and K fertilizers were applied in January or February (prior to bud-break) [ 38].
For each pot, 10 kg of soil was applied (20 cm × 12 cm/10 L), and the corresponding amounts of biochar at 10 and 20 t ha -1 for each pot were 50 and 100 g, respectively. Before planting blueberries in the pots, the soil at the plant's root zone was mixed with biochar and compost, with a root zone size of approximately 10 cm × 5 cm/2 L.
2.4. Soil Sampling and Analysis
The soil sampled for the greenhouse experiment was located in Hau Giang Province (9°54′30.3″N, 105°51′06.7″E). The chemical properties of the soil were determined. Based on many observation points for exploration, the most representative soil profile for the land was selected [ 39]. Soil sampling in the soil profile was carried out separately at depths of 0-20cm and 20-40cm. Representative soil samples for each soil layer were mixed from 05 representative positions in the soil layer. The total number of soil samples was 2 (1 soil sample/layer × 2 layers).
All soil samples were air-dried to dryness, then crushed and sieved with a 2 mm sieve for laboratory analysis.
The soil pH was determined using a digital pH meter (Metrohm 744) for a 1:2.5 soil-to-water suspension. Soil organic carbon was determined by the Walkley and Black method [ 40]. Soil total N was established through the semi-micro-Kjeldahl method after digesting the samples in H 2SO 4. The total and available P levels in the soil samples were estimated using the ammonium phosphomolybdate and Bray-2 methods, respectively.
2.5. Plant Sampling and Analysis
During harvesting, lowbush blueberries were separated into stems, leaves, and fruit, and then the fresh stem and leaf tissues were oven-dried at 70 °C for 3 days to obtain a constant weight. After the dry weight was recorded, the dried plant tissues were ground in a pulverizer and sieved through a 2 mm sieve. A freeze-drying method was used to prevent fruit degradation due to thermal decomposition to obtain a dried sample of fresh blueberry fruit. Five grams of each of the 20 fresh fruits, cut in half lengthwise, were placed in special freeze-drying bottles and frozen at −40 °C for 1 h, followed by immediate freeze-drying for 72 h in an ultra-freezer at −40 °C. A Labconco FreeZone 4.5 Liter Benchtop Freeze Dry System (7750020) was used at a pressure of 0.002 mBar. Once the fruit was freeze-dried, it was placed in a vacuum plastic bag for its mineral composition (N, P, and K) analysis.
The nutrient (N, P, and K) content of the plant parts was determined at the Laboratory of Soil Science Department, College of Agriculture, Can Tho University. The dried samples were digested in an H 2SO 4 and H 2O 2 mixture, and then the N concentration of air-dried samples was determined by the Kjeldahl method. The P concentration was determined spectrophotometrically as the molybdenum blue color was formed by the reaction of ammonium molybdate with ascorbic acid [ 41], and the K concentration was determined photometrically using an air-acetylene flame.
At harvest, different plant parts from treatments four (TRT-4), five (TRT-5), and six (TRT-6) (Table 2) were collected for plant nutrient (N, P, and K) analysis.
2.6. Plant Growth and Fruit Yield
At the time of fruit harvest, the number of leaves and stems on the plant was counted, and the plant’s height was measured. Each treatment was repeated four times, and the number of plants in each was measured in four replicates.
To determine the leaf and stem dry weights, the leaf and stem fresh weights were measured and then dried in an oven for 24 h.
The blueberries in the trees did not ripen simultaneously. To determine fruit yield, the total number of fruits was the cumulative number on the tree of the treatment calculated in each harvest; on average, there were four fruit harvests. Each time, all the fruits on the tree were weighed. The mean fruit weight was determined based on the total weight (kg) of fruits per plant divided by the total number of fruits.
2.7. Statistical Analysis
The mean with standard deviation ( ± SE) was calculated for each treatment. SPSS software (version 20.0) was used to conduct a two-way analysis of variance, and Duncan’s multiple range test was used for multiple comparisons with statistical levels at 5% and 1%. The relationships among plant dry weight, nutrient (N, P, and K) content, and nutrient uptake were determined using Pearson’s correlation coefficients.
3. RESULTS
3.1. N Application and the Growth Stages of Blueberries
The N application to blueberries was based on the bud-break stage of the plant. In the greenhouse experiment of 2022, some noticeable stages of fruit development were recorded: (i) Bud-break on March 11 th; (ii) Early bloom on April 01 st; (iii) Green fruit on April 08 th; and (iv) Late green fruit on April 18 th.
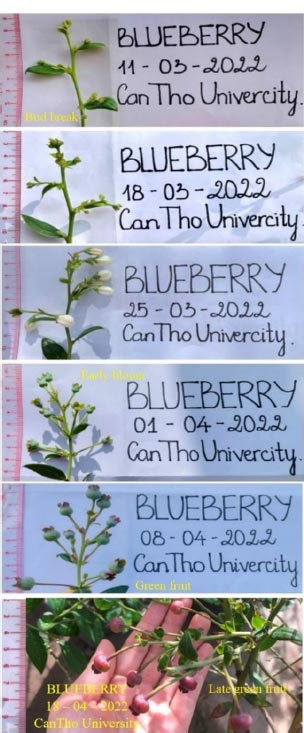
N was applied to the blueberry approximately two months after bud-break. As the bud of Vaccinium tenellum broke in the second week of March (Fig. 3), the green fruit stage occurred one month later; therefore, the N fertilizer application rate was divided into the following: first N in late April, second in mid-May, and third in mid-June.
3.2. Effect of Combined Biochar and Compost Application on Blueberry Growth and Yield
3.2.1. Plant Growth and Yield
Increasing the amount of biochar applied to the soil (0, 10, and 20 t ha -1) resulted in increased numbers of leaves and fruit per plant, plant height, and fruit yield. Specifically, the fruit yield at B20 was the highest (9.3 g plant -1) (Table 3). Similarly, plant growth increased with increasing compost application, with the highest fresh blueberry fruit yield of 9.1 g plant -1 at C10.
The numbers in parentheses represent the standard deviation. B0, no biochar applied; B10, biochar applied at 10 t ha -1; B20, biochar applied at 20 t ha -1; C0, no compost applied; C5, compost applied at 5 t ha -1; C10, compost applied at 10 t ha -1. The blueberry plants were treated with 45 kg N ha -1, 20 kg P 2O 5 ha -1, and 20 kg K 2O ha -1.
| Treatments | Leaf Number | Shoot Number | Plant Height (cm) | Fruit Number/Plant | Fruit Weight (g/fruit) | Fruit Yield (g/plant) |
|---|---|---|---|---|---|---|
| Biochar | - | - | - | - | - | - |
| B0 | 154 | 33 | 45 | 13.7 | 0.243 | 3.5 |
| - | (±103) | (±17) | (±12.5) | (±5.01) | (±0.02) | (±1.61) |
| B10 | 298 | 54.0 | 62.0 | 31.7 | 0.247 | 7.80 |
| - | (±92.5) | (±15.9) | (±8.2 0) | (±8.92) | (±0.02) | (±2.53) |
| B20 | 446 | 66.0 | 68.0 | 36.4 | 0.254 | 9.30 |
| - | (±87.2 0) | (±11.8) | (±14.20) | (±8.19) | (±0.01) | (±2.37) |
| Compost | - | - | - | - | - | - |
| C0 | 207 | 38.0 | 46.0 | 18.6 | 0.229a | 4.30 |
| - | (±97.0) | (±14.9) | (±14.6) | (±8.61) | (±0.01) | (±2.0) |
| C5 | 312 | 51.0 | 64.0 | 28.0 | 0.257b | 7.30 |
| - | (±12) | (±17.7) | (±12.2) | (±10.6) | (±0.02) | (±2.94) |
| C10 | 379 | 61.0 | 65.0 | 35.5 | 0.259b | 9.10 |
| - | (±134) | (±15.6) | (±15.9) | (±12.0) | (±0.02) | (±2.96) |
| CV(%) | 47.5 | 35.9 | 26.9 | 45.2 | 9.2 | 47.8 |
Due to the interaction between biochar and compost (Table 3), the number of leaves, number of fruits, and fruit yield exhibited significant coefficient of variation (CV) values (Table 3) of 47.5%, 45.2%, and 47.8%, respectively.
In this study, multiple regression analysis was used to predict fruit yield by considering leaf number, stem number, and stem height as the three important independent variables, which are presented in the following equation (Eq. 1):
 |
(1) |
Significant at: *** p = 0, ** p = 0.001, and * p = 0.01; R 2 = 0.89***
Where fruit yield (Y) is expressed in tons of fresh fruit per hectare, Leaf # is the leaf number per plant, Stem # is the stem number per plant, and Stem H is plant height measured in cm. Among all factors, Leaf# is most significant in increasing the fruit yield.
3.2.2. Plant Dry Weight
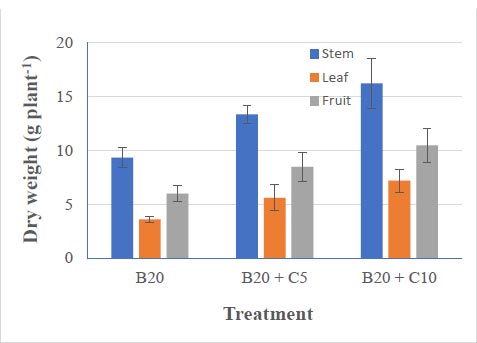
In the B20+C10 treatment, the dry weight of stems and leaves and fresh fruit yield were 16, 7.0, and 10.1 g ha -1, respectively (Fig. 4), higher than those in the combined treatment at B20+C5. However, the dry weights of the stems, leaves, and fruits in the biochar B20 treatment were significantly lower at 9.34, 3.60, and 5.99 g ha -1, respectively.
3.3. The Combined Effect of Biochar and Compost Fertilization on N, P, and K Contents and Uptake of Blueberry Plants
3.3.1. N, P, and K Contents in Blueberry Plants
Evaluating the nutritional status of leaves using published thresholds, along with observations of plant growth, is the best method for developing fertilizer management programs. The N, P, and K contents in the blueberry stems, leaves, and fruits were lowest when using biochar alone (B20) (Table 4). Using combined biochar at B20+C5 helped improve the N, P, and K contents. Moreover, at B20+C10, the N, P, and K contents in the plant parts increased markedly. The leaves had greater N, P, and K accumulation than the stems and fruits (Table 4).
Different letters indicate significant treatment differences (* p < 0.05 and ** p < 0.01). B10, biochar applied at 10 ha -1; B20, biochar applied at 20 ha -1; C0, no compost applied; C5, compost applied at 5 t ha -1; C10, compost applied at 10 t ha -1. The blueberry plants were treated with 45 kg N ha -1, 20 kg P 2O 5 ha -1, and 20 kg K 2O ha -1.
According to Trevett (1972) [ 42], the sufficiency ranges of N, P, and K in leaves of lowbush blueberry were 16.0–23.8, 1.2–2.2, and 4.0–9.0 g kg -1, respectively. However, in the present study, the leaf N and K contents were found to be 14.8 and 3.82 g kg -1, respectively (Table 4), for B20, which were less than those of Trevett.
At B20+C5, the N, P, and K contents of leaf tissues were 17.5, 1.25, and 4.62 g kg -1, respectively, whereas those of B20+C10 were 19.2, 1.48, and 5.23 g kg -1, respectively. Both combined treatments exhibited higher values than those of Trevett, indicating that compost played a positive role in improving mineral nutrient uptake by plants.
The CV (%) of N and K contents in stems, leaves, and fruits was approximately 10%–15% (Table 4), except for P content in stem and fruit, which was 34.5% and 26.2%, respectively.
3.3.2. N, P, and K Uptake by Blueberry Plants
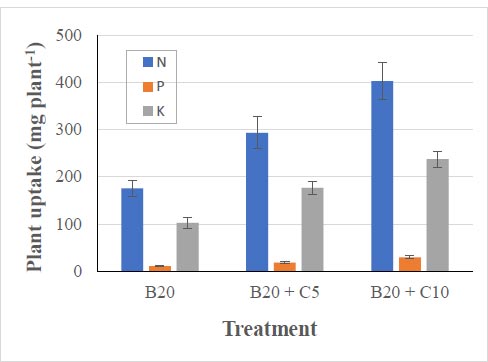
Total plant N, P, and K uptake, considered the total N, P, and K contents of the plant stems, leaves, and fruits, was measured after the destructive harvest on May 28 th, 2022. The highest N, P, and K uptake was recorded for B20+C10 treatment plants at 400 mg N, 29 mg P, and 237 mg K per plant (Fig. 5), whereas the lowest uptake was for B20 treatment at 175 mg N, 10 mg P, and 102 mg K per plant.
| Effect of Biochar and Compost Application on N, P and K Content in Stem, Leaf and Fruit of Blueberry | |||||||||||
|---|---|---|---|---|---|---|---|---|---|---|---|
| Treatment | Stem Mineral Content (g kg -1) | - | Leaf Mineral Content (g kg -1) | - | Fruit Mineral Content (g kg -1) | ||||||
| - | N | P | K | - | N | P | K | - | N | P | K |
| B20 | 6.33 | 0.27 | 6.7 | - | 14.8 | 1.17 | 3.82 | - | 10.5 | 0.65 | 4.29 |
| - | ±0.49 | ±0.05 | ±0.76 | - | ±0.61 | ±0.09 | ±0.26 | - | ±0.54 | ±0.07 | ±0.72 |
| B20 + C5 | 7.08 | 0.31 | 8.07 | - | 17.5 | 1.37 | 4.62 | - | 11.8 | 0.78 | 5.12 |
| - | ±0.25 | ±0.04 | ±0.49 | - | ±1.12 | ±0.06 | ±0.18 | - | ±0.79 | ±0.07 | ±0.32 |
| B20 + C10 | 7.79 | 0.46 | 8.65 | - | 19.3 | 1.48 | 5.23 | - | 13.3 | 1.08 | 5.79 |
| - | ±0.42 | ±0.12 | ±0.83 | - | ±1.7 | ±0.05 | ±0.44 | - | ±0.92 | ±0.19 | ±0.25 |
| CV% | 10.2 | 34.4 | 13.7 | - | 12.8 | 11.1 | 14.5 | - | 11.5 | 26.2 | 15.2 |
3.4. Correlation Matrix Between Blueberry Plant Dry Weights and Mineral Nutrients
A correlation matrix was built to reflect the interrelationships among different plant parameters. A positive correlation was observed among the dry weight of the plant parts (stems, leaves, and fruits) (Pearson’s r ranged from 0.81 to 0.88). Furthermore, the correlation was strong among fruit’s N ( r = 0.80), P (r = 0.90), and K (r = 0.83) uptake (Fig. 6).

Among the correlation coefficients presented in Fig. ( 6), correlations between N, P, and K uptake and dry weight were significant. The positive correlations between N uptake and stem (r = 0.95), fruit (r = 0.92), and leaf (r = 0.93) weights (Fig. 6) were highest compared to the correlation relationship between P uptake and stem (r = 0.88), fruit (r = 0.91), and leaf (r = 0.84) weights. Similarly, the K uptake capacity was also strongly correlated with stem, fruit, and leaf weights at r = 0.95, 0.89, and 0.94, respectively.
4. DISCUSSION
4.1. N Application and the Growth Stages of Blueberries
In this study, N fertilizer was applied according to the growth stages of the blueberry plants; in particular, the first N fertilization was applied 3–4 weeks after bud break.
N is the most important nutrient for maintaining vegetative growth, fruit development, and flower sprout formation and differentiation [ 43]. Sufficient N content in tissues is required to grow the following year’s crop. However, the plant took up less than 2% of N before the end of April [ 3] because blueberry growth in this stage relied on the amount of N stored at the beginning of the season. Stored N was used to maintain reproductive and vegetative growth. Flowering, fruit formation, and initiation of fruit development depend on stored nutrients [ 44].
Excess N at the beginning of a crop can reduce fruit quality, increase the risk of fruit disease, and delay ripening. Excess N at the end of the crop leads to excessive vegetative growth, late budding, and reduced flower bud development [ 38].
N fertilization for blueberries in this study was based on research by Rutgers University, which was based on the appearance of bud-break because, at this time, less fertilizer is needed, and active fertilization after the leaves and buds is ten times more effective than fertilization before bud-break. P and K are not absorbed by plants immediately after application but are absorbed later; therefore, P and K should not be applied before planting [ 37].
4.2. The Combined Effect of Biochar and Compost Application on Blueberry Growth and Yield
As shown in Table 3, the growth and fruit yield of blueberries increased with increasing biochar application rates at 10 and 20 t ha -1, which is consistent with previous studies showing that biochar alone can increase soil nutrient content and crop production [ 45]. According to Steiner et al. [ 46], grain yield can be doubled when biochar is used together with mineral fertilizers, but its effect fades after a number of crop seasons. However, considering the cost of these materials, excessive application of biochar or compost fertilizer may reduce net income [ 47]. Farhangi et al. [ 48] indicated that a high rate of biochar application (>30 t ha -1) did not substantially affect crop yield. Moreover, over-fertilizing biochar does not improve crop yields; even over-fertilizing at 20 t ha -1 reduces plant yield [ 49]. Gao et al. determined that biochar application at 10–20 t ha -1 is the most suitable application rate [ 50].
A previous study [ 51] revealed that plant growth increases with increasing compost application (Table 3) because compost contains the major nutrients required by all plants, including N, P, K, Ca, Mg, S, and essential trace elements considered essential for plants [ 52, 53]. Incorporating compost into the soil before planting a blueberry crop is recommended to improve plant growth and yield [ 54].
In blueberry soils with a high clay content, incorporating organic matter into the root zone improves aggregate stability, pore volume, hydraulic conductivity, and soil field capacity [ 55]. This would improve aggregate stability, pore volume, hydraulic conductivity, and soil field capacity [ 56].
Application of organic fertilizers is also related to increased soil total N, which promotes the growth of beneficial soil microorganisms, decomposes biomass, and indirectly provides NPK and other nutrients to plants through the crop rhizosphere [ 57]. One efficient method for increasing SOM levels is compost application, which is an effective way to treat waste, improve soil quality, and promote a better environment [ 56]. According to Amlinger et al. [ 50], the requirements of farmland using SOM can be fulfilled by an annual application of 7–10 tha -1 of dry matter compost; further decomposition of organic compounds results in stable humus, which is an organic product with slow decomposition rate [ 56].
The results in Table 3 show the interactive effects of biochar and compost on the leaf number, fruit number, and fruit yield of blueberries. Amlinger et al. [ 52] indicated that the combination of compost and biochar could enhance the material quality, leading to long-term stability of biochar and increased C sequestration potential. Therefore, the application of biochar-organic amendment mixtures or mineral fertilizers could sustainably and economically increase crop yield [ 58].
The crop yield model (Equation 1) observed in this study showed that crop yield was strongly associated with and dependent on plant growth and development (r 2 = 0.89). This result is consistent with that of a study by Fournier et al. [ 59], where more flowers had a good correlation with stem height and the number of leaves, which resulted in higher fruit biomass. Therefore, the proposed model can be used to predict wild blueberry yields.
4.3. The Combined Effect of Biochar and Compost Fertilization on Npk Content and Uptake of Blueberries
Trevetts’s sufficiency ranges (g/kg) of N, P, and K contents (16.0–23.8, 1.20–2.20, and 4.0–9.0, respectively) in the lowbush blueberry leaves [ 42] were compared with those of Hart et al. (14–22, 0.8–2.0, and 4.0–5.5, respectively) [ 38], which showed that the N and P ranges of Trevett were higher than those of Hart et al.; however, there was an insignificant distinction between the K range of Trevett and Hart et al.
As shown in Table 4, in the B20 treatment, the concentrations of N (14.8 g N kg -1) and K (3.82 g K kg -1) in the blueberry leaves were below the Trevett threshold. Since K plays an important role in photosynthesis and subsequent carbohydrate translocation and metabolism [ 60], the leaf number and size were reduced due to K values lower than the Trevett threshold [ 42]. However, the results in Table 4 show that in the B20 treatment, the concentration of P in the blueberry leaves (1.37 gP kg -1) was above the Trevett threshold [ 42], which is consistent with the conclusion of a previous study [ 26] that the addition of biochar significantly increases the availability of P in agricultural soil by a factor of 4.6.
Soil nutrient levels are not always the same as those of leaves; for example, sometimes, P content in soil is low, not in leaves. Thus, fertilizer recommendation for lowbush blueberry is mainly based on testing leaf tissue; nonetheless, soil testing is complementary [ 61]. Therefore, David and Kevin [ 39] also monitored the N, P, and K contents in leaf tissues. Many studies have shown that blueberries can be fertilized with N, P, and K, but K application has minimal or no effect on the lowbush blueberry fruit yield [ 62].
When K was applied to blueberry plants [ 63] based on soil K content in Michigan, the yield of ‘Bluecrop’ blueberry increased at low soil K (0.001–0.03 g kg -1) [ 64], but the yield of ‘Jersey’ blueberry had no effect at high soil K (0.03–0.08 g kg -1) [ 65].
Some studies have indicated that P application does not improve crop productivity despite low soil P content [ 66].
According to Parent et al. [ 67], based on growth-limiting nutrient concentrations, nutritive variables are multivariate in nature, and components should be understood as a whole. Pereira [ 68], based on the concept of nutritional balance, establishes limits on nutrients according to the plant’s requirements, facilitating a nutritional balance between nutrients in the leaf.
4.4. Correlation Matrix of Blueberry Plant Dry Weights and Mineral Nutrients
N, P, and K contents in stems, leaves, and fruits were positively correlated (Pearson’s r range of 0.67–0.85 in stem, 0.73–0.88 in leaf, and 0.68–0.71 in fruit) (Fig. 6). Kamprath [ 69] revealed that leaf P content was positively correlated with fruit P content, and total P accumulation was also positively correlated with total N accumulation [ 69]. Under traditional and organic farming methods, N, P, and K contents in leaves are all positively correlated with each other [ 70]; this reflects the dilution of those elements with increasing leaf and stem biomass. It has been suggested that soil N availability and plant N status greatly influence P and K uptake by plants. In the case of low P and K content, the N content was correspondingly low; thus, an increase in crop yield is mainly associated with N fertilization [ 67].
The results of this study are in agreement with those of a study by Quesnel et al. [ 71], in which N, P, K, Ca, and Mg contents in leaves are positively correlated with fruit yield. Many factors were assumed to have caused the differences between the values published in earlier studies and those obtained by Quesnel et al. However, the most important factor is SOM, as demonstrated by Trevett et al. [ 72], and a positive correlation exists between the leaf nutrient concentration and SOM.
CONCLUSION
Although alluvial soil is acidic, which is favorable for blueberry growth, the soil has poor porosity and aeration due to its high clay content. The use of biochar did not improve nutrient uptake for blueberries, but compost showed a positive role in improving this uptake.
In the combined application of biochar and compost, the interaction between these two materials results in a more effective response in terms of plant growth, yield, and NPK uptake. This approach effectively mitigates the challenges posed by high clay content in the soil. The findings emphasize the potential benefits of tailored soil amendment strategies to optimize blueberry cultivation in similar environments.
AUTHOR’S CONTRIBUTIONS
Ngo Ngoc Hung and Ngo Phuong Ngoc conceptualized and designed the experiment. Le Ngoc Quynh, Le Van Dang and Tran Hoang Em conducted the experiments and collected and analyzed samples. Le Van Dang, Le Minh Ly, and Pham Thi Phuong Thao analyzed the data and wrote the paper-original draft. Ngo Ngoc Hung and Ngo Phuong Ngoc reviewed, edited, and approved the final manuscript. All authors have read and agreed to the published version of the manuscript.
LIST OF ABBREVIATIONS
| MD | = Mekong Delta |
| ASS | = Acid sulfate soil |
| OM | = Organic matter |
| SOM | = Soil organic matter |
| RBD | = Randomized block design |
| SE | = Standard deviation |
| B0 | = No biochar applied |
| B10 | = Biochar applied at 10 t ha -1 |
| B20 | = Biochar applied at 20 t ha -1 |
| C0 | = No compost applied |
| C5 | = Compost applied at 5 t ha -1 |
| C10 | = Compost applied at 10 t ha -1 |
| Wt | = Weight |
| Y | = Fruit yield |
CONSENT FOR PUBLICATION
Not applicable.
AVAILABILITY OF DATA AND MATERIALS
All data generated or analyzed during this study are included in this published article.
FUNDING
This project was supported by the Ministry of Education and Training, Vietnam, with grant number B2021-TCT-10.
CONFLICT OF INTEREST
There is no conflict of interest among the authors.
ACKNOWLEDGEMENTS
The authors would like to thank Ms. Huynh Ngoc Truyen, a graduate student, for providing support in the measurements of the agronomic parameters.

