All published articles of this journal are available on ScienceDirect.
Irrigation Efficiency in Banana Crops in the Canary Islands
Abstract
Background:
When planning the use of available water resources and the hydraulic infrastructures needed to make them available to irrigators, it is important to know the water consumption of the different crops. In addition, it is interesting to know the agricultural practices used in each place, since cultural practices in agriculture have an important effect on the flows, when there is no specific study of the water needs of the crop under study.
Methods:
In order to obtain the data, surveys were conducted among irrigators in the area and for the crop to be studied. However, data collection is not a simple task, depending on the characteristics of the irrigation area studied. Irrigation of the plots is not always accounted for individually, or a study of the water needs of the crop has not always been done. In addition, it has been observed that cultural factors affect the way farmers irrigate.
Results:
The water consumption of banana plantations on the islands of Gran Canaria and Tenerife (Canary Islands) was determined in a field study. The results revealed similar consumption on both islands; however, the island of Gran Canaria showed lower water consumption in terms of banana irrigation. The uniformity coefficient was calculated for the island of Tenerife but not for the island of Gran Canaria, so the results could not be supported by this aspect of the agronomic calculation of irrigation efficiency.
Conclusion:
Knowledge of the agronomic and irrigation practices of the Canary Islands' main crop, bananas, is vital to improve water consumption data in the archipelago, where agriculture is the main water demander. In addition, a series of improvements within the irrigation network, as well as improvement in sustainability practices, such as the introduction of reclaimed water in irrigation on the islands, is considered vital in order to be more efficient with water use in a region so vulnerable to climate change.
1. INTRODUCTION
Water in the Canary Islands is a scarce resource. The subtropical climate of the islands has low rainfall concentrated in the winter period [1], which makes it difficult to grow crops on dry land. In addition to seasonal variations, there are also variations in altitude and orientation. The southern slopes of the islands are much drier than the northern slopes and, within the northern slopes, the midlands receive the highest rainfall.
The origin of water for human use on the different islands is diverse: while on the islands of Tenerife, La Palma, or El Hierro, groundwater predominates, on the islands of Gran Canaria and La Gomera, surface water collected in dams also plays an important role. On the more arid islands of Lanzarote and Fuerteventura, desalination plants play an important role [2].
The agro-forestry sector is an important consumer of water in the Canary Islands and, within it, the agricultural sub-sector. Table 1 shows how, except for the islands of Lanzarote and Fuerteventura, the proportion of water used for crop irrigation is significant, exceeding 40% in the central islands and 87% in the island of La Palma (data from the National Institute of Statistics of Spain, the year 2015).
| Island | Water Consumption (hm3/year) | % Over Total | Year of Reference |
|---|---|---|---|
| Lanzarote | 1.56 | 7,3% | 2015 |
| Fuerteventura | 1.37 | 3,4% | 2015 |
| Gran Canaria | 66.7 | 42,7% | 2015 |
| Tenerife | 85.3 | 45,5% | 2015 |
| La Gomera | 5.07 | 64,6% | 2015 |
| La Palma | 71.1 | 87,7% | 2015 |
| El Hierro | 1.72 | 51,8% | 2015 |
In the context of climate change, where the expected trend for the islands is increased temperatures (and therefore increased water needs of crops) and reduced rainfall [3], it is a challenge for the agroforestry sector to make the best use of available water resources, and more specifically for the agricultural sector as the main consumer [4].
Plants use water in the following ways: a) conformation of its tissues, b) photosynthesis, and c) transpiration, which is the most important use, so much so that for determination of water needs of the crops, the other two are negligible. Crop irrigation deficiency could be defined as the relationship between the water used and the necessity to use it in a certain period [5]. In an irrigable area, the main water management operations would be [6] i) water collection and storage, ii) pipes for general use (urban, agricultural, industrial, etc.), iii) general storage in the irrigation area, iv) general distribution pipes in the irrigation area and v) on-farm storage and on-farm application.
For each of these operations, it would be possible to determine partial efficiency, which, added together, would give an overall efficiency for the irrigable area. However, as in the Canary Islands, the water collection and distribution systems are not exclusive to irrigation water, and it is impossible to estimate efficiency in the upper steps. This study will therefore focus on the last part – on-farm irrigation efficiency. This can be defined as the “Volume of water that has a beneficial destination for the crop compared to the volume of water applied, in a certain space and during a fixed time that has already passed” [7]. It is calculated using Equation 1:
 |
(1) |
where: Er is the efficiency of on-farm irrigation, Nb is the volume of water applied on a farm with a beneficial destination for the crop, and Vf is the volume of water applied on a farm.
1.1. Case Study: Tenerife and Gran Canaria (Canary Islands)
Tenerife and Gran Canaria are the two capital islands of the Canary archipelago, which is made up of eight islands located in the Atlantic Ocean off the coast of Morocco. The climate of these islands is subtropical, with a great variety of microclimates within them [8]. What largely marks the climate of each area is its orography and its relationship to the trade winds, which generates areas of high humidity (north) and drier areas (south). In the northern zone of these islands, there are dry crops, mainly vines and potatoes, while in the coastal areas, there are irrigated crops, with a great concentration of bananas (Fig. 1) and tomatoes.
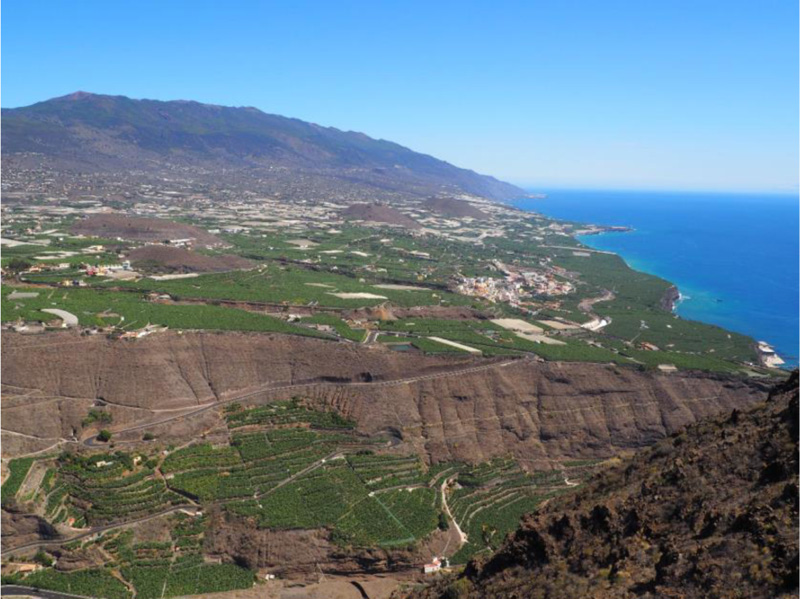
Bananas represent 43% of the total agricultural production of the island of Tenerife [9], and it is the most representative and important crop in economic terms [10, 11]. The water consumption of the island of Tenerife related to agriculture is 52% of the total and, precisely, the banana requires 50.75 Hm3/year [12]. On the island of Gran Canaria, the water demand of banana plantations was estimated at 21.07 Hm3/year (32% of the island's total agricultural water consumption).
This study aims to determine the water consumption of banana crops on the islands of Tenerife and Gran Canaria in two scenarios: greenhouse and open air. Surveys of irrigators were used, specifically on irrigation on the selected farms.
2. METHODOLOGY
2.1. Tenerife
In order to conduct this study (2006), a region in eight different agro-climatic zones on the island of Tenerife was chosen (Fig. 2). This zoning has been undertaken by the institution governing the island (called Cabildo in the Canary Islands) of Tenerife.
Surveys were chosen for data processing. These surveys were subdivided among the different crops according to their importance in water consumption and the area they occupied on the island. There were 293 surveys conducted for the banana crops. A computer application loaded on an electronic agenda with GPS was used to conduct the survey. This application allowed for calculations and checks on the data in situ during the survey so errors could be corrected on the fly. In addition, it was possible to precisely define the surface of a specific section of the farm, which was essential for the correct estimation of unit consumption.
The questionnaire included the following: 1) water inputs on the farm (flow rates, duration, frequency, etc.), 2) a description of the farm (area, greenhouses, pond), and a description of the crop (planting framework, area, duration, etc.) 3) characteristics of the irrigation installation (filtering, fertigation, automatisms, emitters, pipes, etc.) 4) management habits of the irrigator (duration and intervals between irrigations at various stages of the crop, etc.) and 5) the amount of water applied.
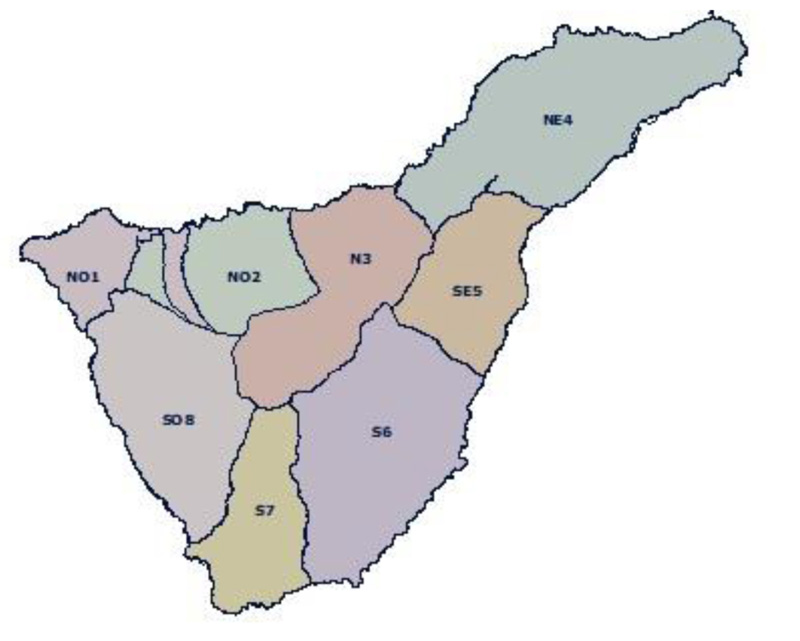
Determination of unitary consumption could be done in different ways, depending on the data provided by the answers the irrigator gave in the survey. Methods included the sum of the inputs to the farm if it was confirmed that all the water is consumed in irrigation, by direct response, or based on responses regarding the irrigation habits of the irrigator (duration of irrigation and the interval between sessions in the different stages of the crop).
In the second phase of the work, one out of every five surveyed farms was selected to evaluate the pressurized irrigation system. A total of 142 irrigation assessments were conducted – 105 drip irrigation systems and 37 sprinkler irrigation systems. The methodology was proposed by the Irrigation Training and Research Centre (ITRC) in California [13]. The specific factors considered were:
Lack of uniformity due to different pressures in the system (Eq.2):
 |
(2) |
where P25% is the arithmetic mean of 25% of the lowest pressures; P is the arithmetic mean of the measured pressures; x is the emitter discharge exponent. Lack of uniformity due to uneven plant and/or emitter spacing (Eq.3):
 |
(3) |
where LASminor is the minor water film applied weekly (mm); LASavg is the average water film, weighted by surface, applied weekly (mm). Non-uniformity due to uneven drainage of the emitters after watering (Eq.4):
 |
(4) |
where textra is extra drainage time after closing the irrigation (min); tavg is average watering time (min); %Surface is affected by extra measured drainage. The average value of extra drainage for all affected surfaces is calculated.
Lack of uniformity due to other factors (Eq.5): this is the most relevant factor, as it measures the flow differences in the emitters during irrigation and highlights blockages and poor-quality emitters, among others:
 |
(5) |
where q25% is the arithmetic average of 25% of the lowest volumetric flows (l/h); qavg is the average of the volumetric flows (l/h); e is the number of gauges per element.
From these partial uniformities, a global distribution uniformity is determined (Eq.6). The calculation is based on the concept of an element, understood as the maximum area or number of plants that receive water, within which the lack of uniformity is unimportant:
 |
(6) |
In order to obtain the necessary data, a two-person team established a work protocol that varied depending on whether it was a drip or sprinkler irrigation system.
In the case of drip irrigation systems, the irrigation evaluation consisted of a) taking flow measurements in 16 emitters from three different laterals (initial, middle, and final) of an irrigation shift b) taking flow measurements in the 16 initial emitters at half the normal working pressure to determine the discharge exponent c) taking pressures at the beginning, middle and final of first and last laterals of three sub-units of the evaluated shift d) measuring drainage in an initial and final emitter to determine uneven drainage e) taking water samples to measure pH and EC and f) taking waste samples at the end of a lateral using a nylon sock.
The performance of all this work during an irrigation shift (usually less than an hour) requires prior selection of the sides, placement of gauges, placement of ports for pressure measurements, and location of keys or pressure regulators to reduce the pressure to half of normal.
For sprinkler irrigation, an evaluation required the following steps: 1) measurement of pressures and flows of four sprinklers for three shifts (first and final of first and last lateral), 2) measurement of drainage time at the end of irrigation, and 3) carrying out a uniformity test in six sprinklers, mounting a network of rain gauges at a separation of 1x1 m, and noting the duration of irrigation and controlling the working pressure during it. Interferences such as the pseudostem of the plant are considered; thus, the uniformity coefficient has been calculated according to the reality of the plots studied. As in the case of drip irrigation, prior selection of sprinklers is required, as well as placement of pressure gauges and gauges, selection of the site for the uniformity test, and assembly of the rain gauge network (which could include the need to clean the plot) (Fig. 3).
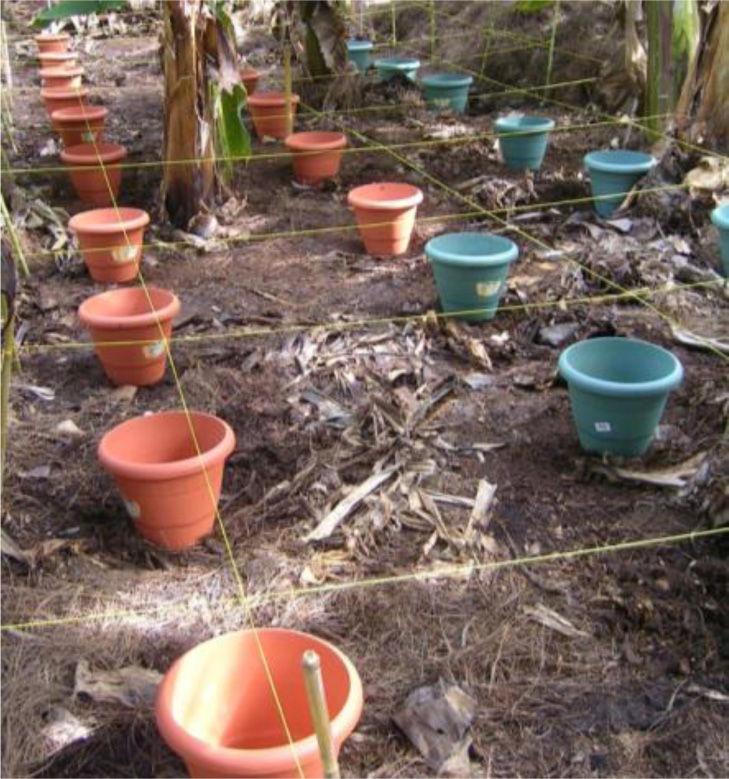
In the case of drip irrigation, high values were reached for irrigation uniformity, above 80% in many areas. In this case, it should be noted that the number of emitters per element is usually greater than one; thus, uniformity values are quite acceptable.
3. RESULTS AND DISCUSSION
For each zone of the study, irrigation efficiency in the banana crops was estimated, and irrigation needs (Nb) were taken from the irrigation recommendations made for those crops by the Service of Agriculture and Rural Development of the Cabildo of Tenerife [15].
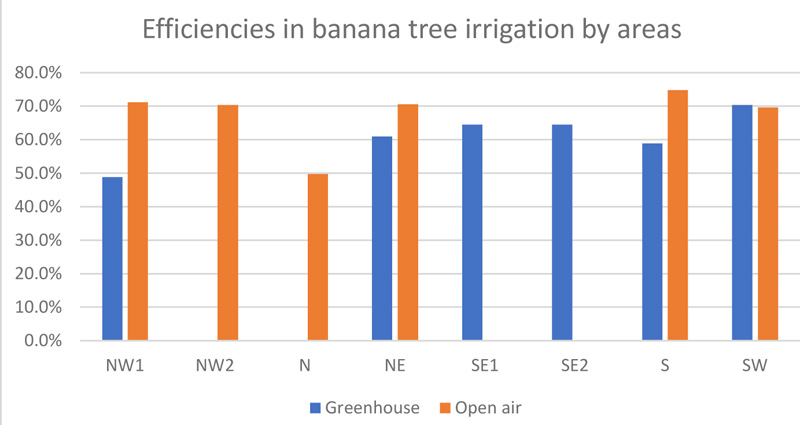
In the case of the banana tree, the average irrigation efficiencies on the farm for localised irrigation were estimated at 70% in the open air and 60% in the greenhouse. This difference is because, although the irrigation needs inside the greenhouse are lower, the water consumption is very similar. The area with the least efficient irrigation was the municipality of Valle de la Orotava (N), with an average of less than 50% (Fig. 5). For sprinkler irrigation, the irrigation efficiencies were very different, varying from 70% outdoors in the southwest zone to 34%, again in Valle de la Orotava (N). For flood irrigation, efficiencies were estimated at less than 30%.
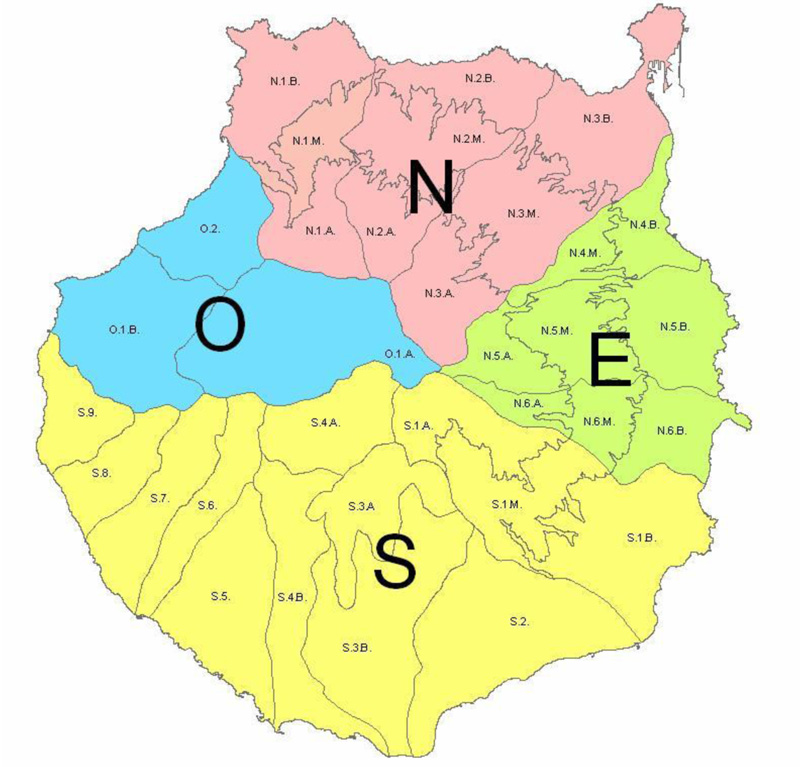
In the case of Gran Canaria, water demand was estimated with the data obtained, resulting in 65.29 hm3 per year. Among the crops, the banana crops stand out, with 21.07 hm3 (32% of the total). In addition, the value of unit consumption on the island of Gran Canaria was calculated at 11,647 m3/ha and year, based on the surveys received.
The Gran Canaria Irrigation Survey did not estimate irrigation efficiency. However, an attempt was made to approximate a specific area (northern zone) using data from a Spanish Agro-climatic Information System for Irrigation (SiAR network), the Galdar station. From there, we took the values of ET0 and calculated the crop's evapotranspiration using the Kc coefficients obtained by Dr. Carmen Luisa Suárez [16]. To estimate the ETc, we added the ET0 by months and multiplied by its corresponding Kc. The results are shown in Table 2.
| - | ET0 (mm) | Kc | ETc (mm) |
|---|---|---|---|
| Jan | 67,81 | 1,11 | 75,27 |
| Feb | 72,23 | 1,01 | 72,95 |
| Mar | 106,08 | 0,81 | 85,92 |
| Apr | 137,25 | 0,56 | 76,86 |
| May | 148,44 | 0,49 | 72,74 |
| Jun | 137,04 | 0,56 | 76,74 |
| Jul | 133,51 | 0,77 | 102,8 |
| Aug | 131,83 | 0,94 | 123,92 |
| Sep | 108,88 | 1,08 | 117,59 |
| Oct | 97,08 | 1,21 | 117,46 |
| Nov | 73,2 | 1,21 | 88,58 |
| Dec | 64,3 | 1,13 | 72,66 |
| Total | 1.277,65 | 1.083,50 |
For that year, rainfall registered in that station was 119.8 mm. This low value can be disregarded; therefore, we can consider an effective precipitation (Pe) equal to 0. To calculate irrigation needs (Eq.7), water distribution uniformity is needed (data obtained from the survey), and an average value of the electrical conductivity (EC) of the water in the area (1.2 dS/m) [16] (Eq. 7):
 |
(7) |
where: Nr is irrigation needs;Etc is evapotranspiration of the crop; Pe is effective precipitation;
CU is the irrigation uniformity coefficient; LR is washing requirements (LR= CE/8 is calculated).
This results in 15,933 m3/ha of irrigation needs for that year which, compared to the water consumption of the crop (11,648 m3/ha), gives us an application efficiency of over 135% (i.e., farmers use much less water than necessary). The only data that was merely indicative was the water quality; the others were real and verified. In a sensitivity analysis of the EC value, if we were to increase it to 1.6 dS/m (very bad value) or reduce it to 0.45 dS/m (very good value), the irrigation needs would vary between 16,929 m3/ha and 14,351 m3/ha, values, which are still above the actual use by the farmers. These results can be interpreted in two ways: either the farmers are applying deficit irrigation of just over 25% (unlikely), or the Kc's used are inappropriate for this area and increase the excess consumption.
Therefore, the island of Gran Canaria showed a lower water consumption for banana cultivation than the island of Tenerife. Nevertheless, the uniformity coefficient study was not made on the island of Gran Canaria, and no conclusions can be drawn from this. However, the uniformity coefficient on this island is expected to be more efficient than on the island of Tenerife.
Banana cultivation is characterized as a great consumer of water, which happens in all the territories where they are grown [17, 18]. In the Canary Islands, it is especially important to know how much water this crop demands since the agricultural sector has the highest water consumption on the island of Tenerife [19]. The islands are territories with limited resources [20], and water is one of them; therefore, sustainable water management is required [21], especially during climate change.
The current trend in new farms or the remodelling of existing farms is to modify the irrigation system, going from blanket irrigation to drip irrigation (diffusers with flows of 200 l/h or drippers with flows of 16 l/h) [22].
CONCLUSION
Tenerife and Gran Canaria islands have one characteristic crop that is easily exported – bananas. This crop is an important consumer of the island's water resources, so it is important to learn about the usual irrigation practices on island farms. It is important to learn first-hand about the sector's water habits and the improvements that should be made to achieve water savings without compromising the productivity of the crop studied. For this purpose, a correct agronomic design is considered key. At the farm level, irrigation application efficiency shall be based on the good design of the irrigation installation. This design will allow water to be applied uniformly to the crop, to avoid excessive volumes of water and ensure that the entire crop receives the water it needs to develop properly. Using a mathematical expression, good irrigation uniformity is necessary but not sufficient to irrigate efficiently.
Due to its orography and rainfall, the water catchment and distribution system on the Canary Islands is complex. It is not exclusive to agriculture, so it is difficult to determine concrete data on the efficiency of water catchment and distribution for irrigation. However, at the level of irrigable areas or districts within the islands, a number of actions can be considered case-by-case to improve water use efficiency. For example, a) construction of reservoirs to store winter surpluses at high altitudes in irrigable areas, b) pressurised distribution networks, c) replacement of open pipes with closed ones, and the control of consumption using meters are also fundamental tools for reducing water losses and obtaining reliable information on real consumption, d) reuse for irrigation of reclaimed water can put water to second use, allowing either an increase in the cultivable surface area or less extraction pressure on aquifers and e) correct management of the extraction of the flow in wells can limit the risks of salinisation due to sea intrusion.
LIST OF ABBREVIATION
| ITRC | = Irrigation Training and Research Centre |
CONSENT FOR PUBLICATION
Not applicable.
AVAILABILITY OF DATA AND MATERIALS
Some or all data, models, or codes that support the findings of this study are available from the corresponding author [J.C.S] upon reasonable request.
FUNDING
None.
CONFLICT OF INTEREST
The authors declare no conflict of interest, financial or otherwise.
ACKNOWLEDGEMENTS
The development of this study has been possible thanks to the government of the Canary Islands through the project “Analysis of the carbon and water footprint of the three main economic activities in the Canary Islands: Tourism, Agriculture and Integrated Water Cycle” under grant agreement Noº 20160026.
The authors thank the Consejería de Agricultura, Ganadería y Pesca for information regarding the project “Study of Irrigation Systems on the Island of Gran Canaria,” developed through the public company GMR Canarias. The authors also thank the Cabildo Insular de Tenerife for realizing the project “Study on agricultural water consumption, evaluation of irrigation systems and estimation of the efficiency of irrigation in the island of Tenerife.”

