All published articles of this journal are available on ScienceDirect.
Assessment of Mineralized Nitrogen During Maize Growth Succeeding Different Winter Cover Crops in the Mediterranean Environment
Abstract
Background:
Understanding soil nitrogen (N) dynamics is essential to find alternative N sources and improve N use efficiency in agriculture.
Objective:
The aim of this study was to assess N mineralization rates from residues of winter cover crops, during maize crop season, under Mediterranean conditions.
Methods:
A field experiment was carried out from May to September in central Portugal, with four replications, two sowing dates of cover crops (15/10/2011 and 29/11/2011) and three cover crops residues (balansa clover, ryegrass and yellow lupine) that were incorporated in the soil. Plots were cropped with local maize and net N mineralization was measured during the crop cycle, using soil cylinders placed inside micro-perforated polyethylene bags.
Results and Discussion:
Early sowing of the cover crops residues increased the NH4+ and NO3- contents in the soil. Yellow lupine residue had the highest rate of daily N mineralization (0.71 mg N kg-1 day-1). For all treatments, the highest mineralization rate was found in the last incubation period, ranging between 0.78 mg N kg-1 day-1 and 1.84 mg N kg-1 day-1, both for balansa clover, from the second and the first sowing date, respectively.
Conclusion:
The present study suggests that, under Mediterranean field conditions, cover crops residue of Italian ryegrass, balansa clover and yellow lupin can be used as a nitrogen source namely for sustainable maize crops.
1. INTRODUCTION
Nitrogen (N) is one of the most important elements in all agricultural ecosystems and significantly influences ecosystem functioning. With the rising costs of synthetic (mineral) fertilizers, cover crops are increasingly used as a source of nutrients, namely N. In Mediterranean environment, cover crops were efficient as N source for maize crop [1]. Integration of cover crops in cash crops can regulate net N mineralization and reduce NO3- leaching losses [2]. Understanding patterns of N mineralization and its kinetics is essential to improve N use efficiency in agriculture [3], especially when it comes to meet N demands of crops. Nitrogen mineralization and nitrification produce NH4+ and NO3-, which are taken up by plants. These processes also control the supply and magnitude of mineral N from the soil system to the plant [4]. Improving timing, between N demand and supply, is a way to increase and improve N use efficiency in agricultural systems, which is reflected in an increasing of the productivity and environmental quality improvement, because much N is lost through leaching and gas emissions, leading to eutrophication and contributing to climate change [5].
To assess mineralized N, under field conditions, without any profound alteration of the soil and climatic conditions, in situ evaluations are used. In situ field experiments are more labour intensive but provide more realistic estimates of soil N mineralization under environmental conditions and take into account the effects of soil architecture [6, 7]. In this method, mineralized N is estimated by increasing mineral N values in soil samples, incubated under field conditions [8]. Compared with other methods for evaluating mineralized N, in situ incubation has the main advantages of being simple to use, allowing measurements in environmental conditions (for long periods of time) [9], and allowing more reality-like estimates, as soil N dynamics is strongly affected by environmental conditions [10, 11].
Several techniques have been proposed to quantify N mineralization and/or immobilization through in situ incubations [8, 9] such as core sampling, resin-core sampling and buried bags [7]. All these techniques have the disadvantage of underestimating the total mineralized N, as they lack to consider plant presence. Plant presence increases mineralization, due to the release of root exudates, rich in organic N, which promote microbial activity, and contrariwise, reduces immobilized N, due to the competition they establish with microorganisms for N in the soil. However, Monaco et al. [8], consider the buried bags methodology as a good indicator of N mineralization in the soil. In this method, usually called “in situ”, the soil samples were sealed in a sterile polyethylene bag and then reinserted to their respective depth [12]. Thus, the in situ method previously referred to is easy to carry out, sensitive to on-site temperature fluctuations [13], and therefore the results obtained are closer to the real condition.
Net N mineralization (NNM) of soil organic matter is the result of two simultaneous and opposite processes (N mineralization and immobilization), however, in the fields, it also includes processes such as gas losses, leaching, atmospheric deposition and ammonium dynamics (fixation / release) [7]. Clivot et al. [6] highlighted that improved assessment and prediction of NNM rates under field conditions are essential for better management of N in arable cropping systems and improve fertilizer recommendations for farmers because the actual availability of inorganic N depends on the rate of NNM and its transport through the soil.
Previous studies reported that the addition of inorganic N into the soil, derived from cover crop decomposition, by subsequent plant cultivation is important [14] and is recommended as a N source for crop production [1]. Therefore, understanding the impact of different forage legumes on N content and yield of the main crop is important to improve the efficiency of N fertilization in annual crop rotations. Also, the sowing date of cover crops condition, their development and the impact on nutrient accumulation are key factors for N fertilization management [1, 15]. Thus, the delayed sowing of cover crops could affect the carbon:nitrogen (C:N) ratio, which influences the rate of N mineralization [15].
Optimizing N rates for agronomic and environmental considerations continues to receive much attention because N is commonly the most limiting nutrient for agricultural production, representing a large input cost. Losses to the environment usually increase when N is applied in excess [16]. Hence, more studies are needed to obtain knowledge about the N fertilizer value of the residues of cover crops under specific soil and climate conditions.
Synchronization of cover crop decomposition and nutrient release with cash crop uptake can provide benefits to agroecosystems but can be difficult to implement. Thus, in response to the above consideration, we have proposed the following hypotheses: (H1) Net N mineralization would be higher from leguminous than non-leguminous CCs; (H2) leguminous cover crops would be able to supply the N to the cash crop synchronously with its needs. To test these hypotheses, we have conducted a 98-day incubation to compare the N mineralization of leguminous and non-leguminous cover crops.
Our study aimed to evaluate the effects of the winter cover crop (leguminous and non-leguminous), under Mediterranean field in the soil NNM, by measuring in situ NNM incubation in the upper soil (0-150 mm) during maize growing season and by quantification of mineralized N deposited in the soil at the end of incubation.
2. MATERIALS AND METHODS
2.1. Experimental Setup
A field experiment was carried out from May to September 2012 in central Portugal (Viseu, Portugal; latitude: 40.641789º, longitude: -8.655840º). The soil of the field experiment was classified as a Dystric Fluvisol [17], with a sandy-loam texture (44.2% coarse, sand, 24.0% fine sand, 16.3% silt and 15.4% clay), and the following physicochemical properties: 1.0 g cm-3 of bulk density, 6.1 of pH (H2O), 15.70 g [kg dry soil]-1 of total C and 1.85 g (kg dry soil)-1 of total N. Briefly, the soil texture was determined by the International pipette, bulk density by Keen & Raczkowski method, pH (H2O) was determined, in a 1:2.5 soil:water ratio, by EN 13037, total organic C by Dumas method, and total N by Kjeldahl method.
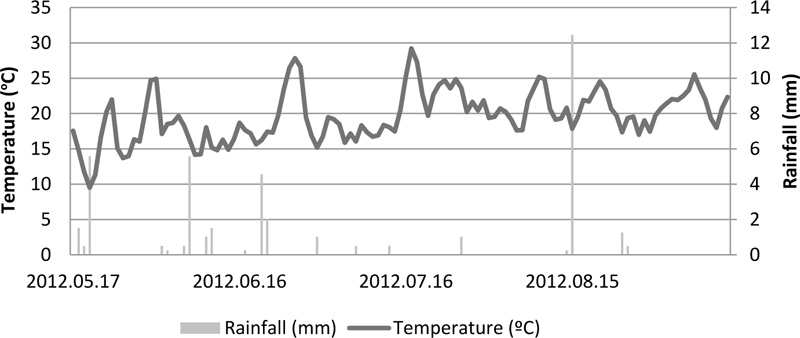
A weather station (WS-GP1, Delta-T Devices Ltd. UK) located near the experimental site was used to collect meteorological data during the experimental period (Fig. 1). Air temperature ranged from 9.5 to 29.2 ºC and accumulated rainfall was 41.4 mm, highlighting that 12.5 mm of this total occurred in a single day (August 15).
The cover crops used in this study were Italian ryegrass (Lolium multiflorum Lam.), balansa clover (Trifolium michelianum Savi.) and yellow lupin (Lupinus luteus L.), which were sown in two different dates, 1st sowing date or early sowing (15-10-2011) and 2nd sowing or late sowing date (29-11-2011). The sowing densities were 341 seeds m-2 for ryegrass, 1786 seeds m-2 for balansa clover and 60 seeds m-2 for yellow lupin.
These three cover crops were incorporated into the soil, in full bloom, on the 16-05-2012. The experimental design was a split-plot with four replications, with the two-sowing date of cover crops (1st sowing date or early sowing and 2nd sowing or late sowing date) as the main factor (or large plots) and three cover crops residues incorporated in the soil the sub-factors (or small plots with size of 3 m × 5 m). Plots were cropped with local maize, sown on the 31-05-2012 (density of 9 seeds m-2) and harvested on 15-09-2012. The cover crops, as well as, maize, did not receive any fertilizers and weed control more details about the cropping practices are given in Perdigão et al. [1].
To know the content of N added by the cover crops residues, samples of the cover crops were collected, dried ground, and subsequently evaluated for their total N content. Thus, the total N content added in the soil (0-150 mm) to the cover crops residues was determined and increased significantly (p < 0.05) by the following order: ryegrass (81.0 mg N kg-1 dry soil) < balansa clover (110.4 mg N kg-1 dry soil) < yellow lupine (141.8 mg N kg-1 dry soil).
2.2. Nitrogen Mineralization
Nitrogen mineralization in the 0-150 mm soil layer was measured, from the incorporation into the soil of cover crops residues (16-05-2012) and maize harvesting (15-09-2012), by sealed microperforated plastic bags and by employing incubation periods of two weeks. Thus, NH4+ and NO3- contents were collected from soil samples for assessment every 14 days, except in the first three weeks with a time interval of 7 days.
At the beginning of each incubation period (t0) a soil sample was collected to determine mineral N (NH4+ and NO3-). On the same day, a sample consisting of six subsamples was collected and placed in six perforated polyvinyl chloride (PVC) tubes that were buried in the ground during the incubation period, in a sealed microperforated plastic bag. At the end of this period, the sample consisting of six sub-samples was collected to determine the mineral N at time t1. From the difference in the measurements of mineral N in the soil, at the beginning (t0) and at the end (t1) of each incubation, the net mineralization for each incubation period was calculated. The PVC tubes were 150 mm in length, 40 mm in diameter and had perforations to facilitate the aeration of soil during incubation. All samples were collected at a depth of 0-150 mm. Each incubation period lasted for 14 days, except for the first three incubations, which lasted for 7 days. The latter incubation period considered the possibility that at the beginning of decomposition there might be more evident alterations in N mineralization in the soil. In total, nine incubation periods were carried out.
The samples collected per each treatment and replication were immediately sieved (2 mm mesh), weighed to determine their moisture content, and a subsample was used to determine the mineral N content and assess the mineralization/ immobilization rates. The NH4+ and NO3- contents of the soil samples were determined as described in Houba et al. [18]. Briefly, to extract NH4+ and NO3- from the soil samples, 6 g of each treatment were weighed, 30 mL of 2 M KCL was added and shaken for 1 hour. The suspension of each sample was then centrifuged for 10 min at 3000 rpm and the supernatant analyzed for NH4+ and NO3- contents by molecular absorption spectrophotometry (by the Berthelot reaction for NH4+ and by the Griess-Ilosvay reagent for NO3-) in a continuous flow analyzer (SanPlus, Skalar, Breda, NL) [18]. This segmented flow analyzer was equipped with dialyzers to prevent interferences from colour or suspended solid particles in the extracts [18]. The remaining soil of each treatment and replication was used to determine soil moisture content by the gravimetric method, after drying at 105 ºC for 24 h.
2.3. Data Analysis
The net N mineralization (NNM) was calculated based on the variation of mineral N content in each incubation period (t1-t0). Accumulated net mineralization (ANM) was calculated by adding the net mineralization of the period to the net mineralization of all previous periods. The potentially mineralizable N of cover crops residues was assessed using the model proposed by Stanford & Smith [19, 20], being calculated by Equation (1):
 |
(1) |
where Nm was the cumulative N mineralized N (mg N kg-1 applied N) at time t (days), N0 refers to potentially mineralizable N (mg N kg-1 applied N), k is the mineralization constant (day-1), and t is the time from the start of the incubation (days).
Obtained data were subjected to an analysis of variance, using software SPSS statistics 17.0 (Chicago, IL, USA). The significance of differences was assessed by analysis of variance (GLM) and the normality of the distribution of the studied traits was tested using the Shapiro-Wilk normality test. A General AOV was performed to test the effects of each treatment and time independently. Means were separated by Duncan's test for a significance level of 5%.
3. RESULTS
3.1. Soil Mineral N
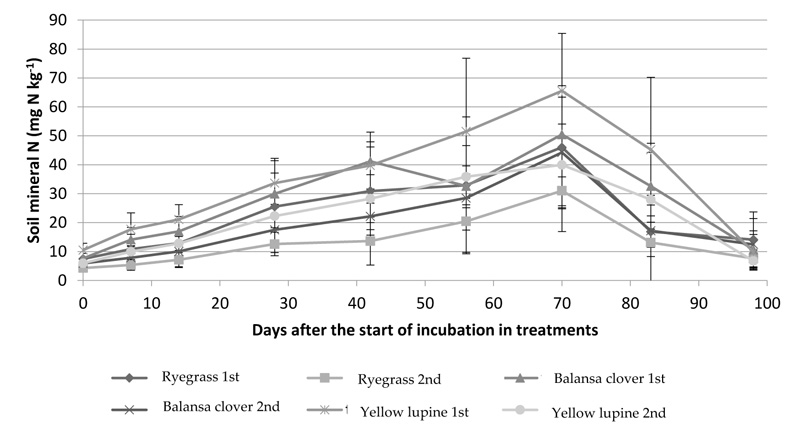
Mineral N measured in the surface layer of the soil (0-150 mm) during the experimental period, referring to T0, showed significant differences (p < 0.01) between sowing date up to 42 days after the incorporation of cover crops residues in the soil (up to 27 days after sowing maize because this was sown 15 days after incorporation of cover crops residues) (Fig. 2). Significant differences (p < 0.05) between cover crops residues on day 83, after incorporation, is shown in Fig. (2).
It was found that, regardless of the cover crops residue, there was an increase in the mineral N content in the soil until day 70 after its incorporation (Fig. 2). A single exception was the balansa clover treatment on the 1st sowing date, where a decrease in soil N content was found between days 42 and 56 after incorporation (Fig. 2). From day 70 onwards, there was a decrease in mineral N content in the soil in all treatments (Fig. 2).

On the day of incorporation (day 0) and on the seventh day after incorporation, NH4+ levels in the soil were higher than NO3- levels (Fig. 3) for the 1st sowing date and for all residues. On the 2nd sowing date, the same was observed, except for the balansa clover on the seventh day, where the NO3- content was higher than the NH4+ content. In the remaining periods, the NO3- content was always much higher than the NH4+ content (Fig. 3).
Regarding the NH4+ content in the soil, there were significant differences (p < 0.05) between the sowing date up to day 83 after incorporation of the residues (Fig. 3). In this period, the 1st date always had higher values of NH4+ than those on the 2nd sowing date (Fig. 3). In relation to the different residues of the cover crops, there were no significant differences (p > 0.05) regarding the NH4+ content, in any analysed period (Fig. 3).
On the day of incorporation of the residues, there were only significant differences (p < 0.05) in the values of NO3- in relation to sowing date, with the 1st date with a value of NO3- (2.79 mg N kg-1) higher than on the 2nd date (1.56 mg N kg-1) (Fig. 3). Seven days after incorporation, there were significant differences regarding sowing date (p < 0.01) and residues (p < 0.01) (Fig. 3). The 1st sowing date continued to have the highest NO3- values (6.28 mg N kg-1) compared to the 2nd sowing date (4.02 mg N kg-1) (Fig. 3). With regard to cover crops residues, ryegrass (3.26 mg N kg-1) was significantly lower (p < 0.05) than balansa clover (5.31 mg N kg-1) and lupine (6.89 mg N kg-1) (Fig. 3). There were significant differences (p > 0.05) between sowing date up to 42 days after the incorporation of cover crops residues, with the 1st date always having higher NO3- values than the 2nd date (Fig. 3). Significant differences (p < 0.05) between residues only occurred again on day 83 after incorporation, where ryegrass (12.2 mg N kg-1) was significantly lower than lupine (31.9 mg N kg-1) (Fig. 3).
3.2. N mineralized
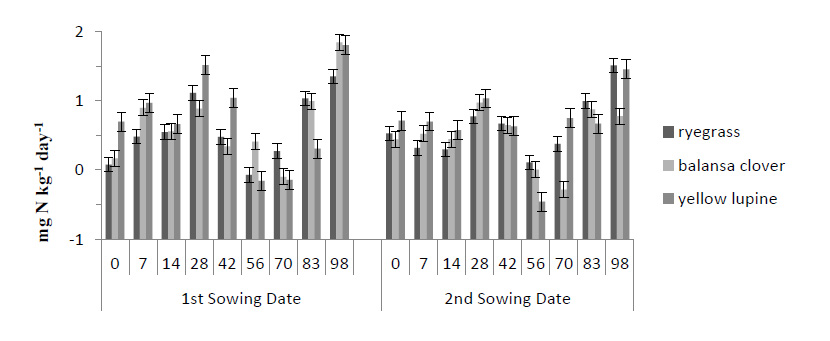
In all treatments, N mineralization occurred until day 56 after incorporation of cover crops residues, with immobilization flow occurring between days 56 and 83 Fig. (4). The only treatment where there was no immobilization was for ryegrass from the second sowing date (Fig. 4). In addition, for all treatments, the highest mineralization rate was verified in the last incubation period, which varied between 0.78 mg N kg-1 day-1 and 1.84 mg N kg-1 day-1, both for the balansa clover from the second sowing date and the first sowing date, respectively (Fig. 4).
Values of mineralized N evaluated in the different treatments, throughout the test, and obtained in each period, were added to obtain the accumulated net mineralization during the test period (Fig. 5). About accumulated mineralized N, there were significant differences between sowing date on day 42 and day 70 after sideration of the residues (p < 0.01 and p < 0.05, respectively) (Fig. 5). The mineralized N, 42 days after the incorporation of residues in the plots from the 1st sowing date, was higher than the values from the 2nd date (Fig. 5). There were significant differences (p > 0.05) between the residues from the 1st sowing date (Fig. 5). On this date, the N mineralized by lupine (43.6 mg N kg-1) was significantly higher (p < 0.05) than that of balansa clover (29.7 mg N kg-1) and ryegrass (29.6 mg N kg-1) (Fig. 5). Regarding the 2nd sowing date, there were also significant differences (p < 0.05) between the treatments, with the highest mineralized value also being verified by the treatment with the lupine (35.6 mg N kg-1); and also, being significantly different (p < 0.05) from mineralized N by treatments related to balansa clover (24.7 mg N kg-1) and ryegrass (18.6 mg N kg-1) (Fig. 5).
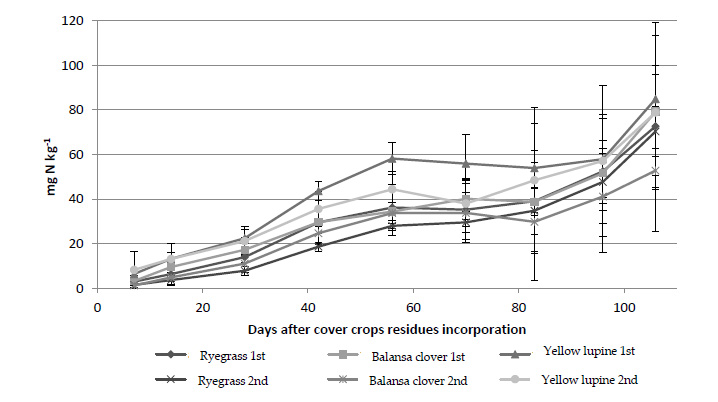
Seventy days after the incorporation of the cover crops residues, there were also significant differences (p < 0.05) between sowing date, with the 1st date showing better results than the 2nd sowing date (43.8 mg N kg-1 and 33.8 mg N kg-1, respectively) (Fig. 5). There were significant differences between treatments (p < 0.05) until the end of the 5th incubation period (56 days after incorporation) (Fig. 5). In all these periods, it was verified that the treatment of the lupine was the one in which the highest value of mineralized N was observed (Fig. 5).
At the end of the experiment, accumulated mineralized N values varied between 81.9 mg N kg-1 for the treatment with lupine, 71.5 mg N kg-1 for the treatment with ryegrass and 66.0 mg N kg-1 for treatment with balansa clover (Fig. 5). Throughout the test, the treatment concerning lupine from the 1st sowing date recorded the highest values of accumulated mineralized N (Fig. 5). Although not showing significant differences (p > 0.05), it is worth noting the difference in values for the treatment with balansa clover for the two-sowing date, with regard to the average daily net mineralization (Fig. 5). In the treatment from the 1st sowing date, a value of 6.0 mg N kg-1 day-1 was recorded while for the treatment from the 2nd date it was 4.4 mg N kg-1 day-1, which represents a difference of approximately 25% (Fig. 5).
3.3. Potentially Mineralizable N
Several models have been proposed to estimate the decomposition rate of plant residues [21, 22]. All of these models are composed of equations with exponential functions. The results of applying the model to N mineralized by waste (plant residues + soil) are shown in Table 1. Potentially mineralizable N ranged from 105 mg N kg-1 for lupine residues from the 1st sowing date to 2721 mg N kg-1 for ryegrass residues from the 2nd sowing date (Table 1). These values are unrealistic, rendering the model not adjusted to these plant residues. The incubation time required to mineralise half of N0 (t ½), varied between 64 days and 3721 days for lupine residues from the 1st sowing date and ryegrass residues from the 2nd sowing date, respectively (Table 1).
4. DISCUSSION
The quantification of mineralized N in the soil is important for both economic and environmental issues [1, 23]. In this study, both sowing date and residues interfered with mineralized N, although this interference was canceled out with time advancement, after the date of soil residues incorporation into the soil. Nakhone & Tabatabai [22] reported species used as residue conditions for the mineralization of N. Previous studies [1, 23] reported that environmental conditions, such as temperature and humidity, influence the rate of N mineralization. In this study, incubation periods where immobilization ensued coincided with the occurrence of higher temperatures and with the lowest water content in the soil. In addition, Schomberg et al. [24] observed a lower mineralization rate in the presence of higher temperatures. Also, Carsky et al. [25] stated that, with this method, different temperatures can lead to different values of mineralized N.
| Treatments | 1st Sowing Date | 2nd Sowing Date | ||||||
|---|---|---|---|---|---|---|---|---|
| N0 (mg kg-1) |
k (day-1) |
r2 | t 1/2 (days) |
N0 (mg kg-1) |
k (day-1) |
r2 | t 1/2 (days) |
|
| Ryegrass | 1452.39 | 0.00040 | 0.96 | 1738 | 2721.36 | 0.00019 | 0.98 | 3721 |
| Balansa clover | 1384.53 | 0.00044 | 0.96 | 1577 | 130.85 | 0.00414 | 0.93 | 167 |
| Yellow lupine | 105.08 | 0.01090 | 0.93 | 64 | 208.57 | 0.00364 | 0.95 | 190 |
The soil N contents observed in this study were higher in the treatments with legume residues. Rodrigues et al. [26], reported that legume residues increase the mineral N content in the soil. These values increased up to 70 days after the incorporation of the residues, and then, progressively decreased. This decrease can be explained by two reasons: (i) the start of irrigation (which started about 1.5 months after maize sowing), and (ii) the greater uptake of N by the main crop, since during the first 6-7 weeks, the plants absorbs between 10 to 20% of the total N present at harvest [27]. The explanation previously stated is validated by the values of the accumulated net mineralization, which is always increasing on most incubation dates. The immobilization observed in this study, between day 70 and 83 after incorporation of cover crops residues, could be related to the lack of water before the start of irrigation and, on the other hand, to excess moisture in the soil in the first days of watering, with the consequent occurrence of leaching or denitrification, due to the decrease in aeration, as well as, coincidence with the period when the highest temperatures were registered. Soil temperature and moisture are the environmental factors that most influence the mineralization rate [9].
The values of NH4+ ranged between 1.26 and 9.96 mg N kg-1 in this study. Similar values of NH4+ were found by Dias et al. [20], when they evaluated, under field conditions, grasses, legumes and spontaneous vegetation, varying the values of NH4+ from 3 to 9 mg N kg-1. At the beginning of this study, levels of NH4+ were higher than the levels of NO3-, followed by a decrease in residual values, explained by the fact that nitrifying bacteria rapidly transform N from the NH4+ form to the NO3- form [21]. The daily net mineralization for the different residues was: 0.59 mg N kg-1 day-1 for ryegrass, 0.67 mg N kg-1 day-1 for balansa clover and 0.74 mg N kg-1 day-1 for lupine, for residues from the 1st sowing date, and 0.62 mg N kg-1 day-1 for ryegrass, 0.49 mg N kg-1 day-1 for balansa clover and 0.68 mg N kg-1 day-1 for the lupine of the 2nd sowing date. Values referring to cover crops residues of the 2nd sowing date are the opposite of what was expected, since the residue of the balansa clover presents a mineralization rate lower than the mineralization rate of ryegrass. Li et al. [28], state that legume residues decompose faster than non-legume residues.
Net mineralization accumulated in the plots with the residues of lupine was 82 mg N kg-1, this value being much higher than that found by Rodrigues et al. [26], also using field incubation and lupine, where the value found was 45 mg N kg-1. Values higher than those observed in this study, are reported by Nakhone & Tabatabai [22], for other legume species: between 170 and 353 mg N kg-1.
When analyzing the results of the mineralization model, we found that there were very low mineralization constants (Table 1). The mineralization constant indicates how fast the mineralizable N from residues is released and is not equivalent to the rate of residue decomposition [29, 30]. Such low k values indicate that either the incubation conditions were not satisfactory, or the active N fraction was not easily decomposed by soil microorganisms. This is also in line with the values referring to the half-life (t ½), where it is shown that an appreciable period of time is necessary for the N to mineralize (Table 1). Also, the fact that the highest mineralization rate was observed in the last incubation period, may indicate that the duration of the test was not sufficient to mineralize a large faction of the N. As the test took place until maize harvest, it may imply that there is N still available to be lost by leaching if a new culture is not installed.
The N0 values varied greatly between residues, and even for the same residue, between sowing dates, as was the case for balansa clover (Table 1). The residue from the 1st sowing date had a N0 value of 1385 mg N kg-1 and the residue from the 2nd sowing date had an N0 value was 131 mg N kg-1. The value relative to the 1st date residual was an exaggerated value, probably due to an unreliable prediction of the regression. Cordovil et al. [30], state that the value of N0 can vary depending on several factors such as humidity, aeration, temperature, nature and amount of waste incorporated into the soil and other physical, chemical and biological factors. Based on the values found in this study, it is possible to verify that the model used does not adapt to the mineralization of the waste used.
Linear regressions were tested to verify the influence on the mineralization of the N added by the residues and the initial N content in the soil. Although both regressions were significant (p < 0.05 and p < 0.01, respectively), only about 17% of mineralized N is explained by the added N content and about 25% is explained by the initial N content in the soil.
CONCLUSION
For the residues of cover crops tested and under the edaphoclimatic conditions of this assay, all residues showed N mineralization in most of the incubation periods, with immobilization occurring only in one or two incubation periods, which coincided with the highest recorded temperatures and with the start of irrigation, which allows us to conclude that environmental conditions are of great importance in the mineralization process.
In all treatments, the highest mineralization rate was verified in the last incubation period. The sowing date of the intercropping used as residues influenced the NH4+ and NO3- contents in the soil, with these contents being higher in treatments related to early sowing. It was in the treatments with legume residues that a greater increase in N content in the soil was observed. In the treatment with ryegrass, from the second sowing date, there was no net immobilization. It was in the treatment with lupine residue that there was a higher rate of daily mineralization (0.71 mg N kg-1 day-1) and, consequently, a higher value of mineralized N (82 mg N kg-1).
The present study suggests that, under Mediterranean field conditions, the cover crops residues of Italian ryegrass, balansa clover and yellow lupin are important N sources for the maize crop and its use as a source of N is promising, mainly in sustainable agriculture. To better affirm this sustainable solution for the supply of N, it is necessary to carry out more in situ incubation tests, over several years and in other soil-climatic conditions.
AUTHOR CONTRIBUTIONS
Conceptualization, A.P., N.M., H.T. and J.C.; methodology, A. P, and J.C.; software, A.P.; validation, A.P., J.L.S.P., H.T. and J.C.; formal analysis, A.P. and J.L.S.P.; investigation, A.P.; resources, A.P.; data curation, A.P.; writing—original draft preparation, A.P.; writing—review and editing: A.P. and J.L.S.P.; visualization, A.P., J.L.S.P., H.T. and J.C.; supervision, H.T. and J.C.; project administration, A.P.; funding acquisition, A.P. and J.LS.P. All authors have read and agreed to the published version of the manuscript.
LIST OF ABBREVIATION
| NNM | = Net N Mineralization |
ETHICS APPROVAL AND CONSENT TO PARTICIPATE
Not applicable.
HUMAN AND ANIMAL RIGHTS
Not applicable.
CONSENT FOR PUBLICATION
Not applicable.
AVAILABILITY OF DATA AND MATERIALS
Not applicable.
FUNDING
This research was funded by the National Funds by FCT – Portuguese Foundation for Science and Technology, under the project UIDB/04033/2020 and UIDB/00681/2020. Adelaide Perdigão has received a grant from the FCT (SFRH/BD/69105/2010).
CONFLICT OF INTEREST
The authors declare no conflict of interest, financial or otherwise.
ACKNOWLEDGEMENTS
The authors thank Dr. Cristina Mega for the English review.

