All published articles of this journal are available on ScienceDirect.

Land Use Capability and Suitability Classifications of a Plinthic Alfisol of a Derived Savannah Ecology of Nigeria
Authors Info & Affiliations
Abstract
Background:
In derived savanna ecology, the evaluation of soil characteristics for the current and future capability and suitability for crop production is crucial. Therefore, studies were conducted to evaluate the capability and suitability of plinthic soil of a derived savannah ecology of Nigeria for sustainable crop production.
Methods:
The methodology was essentially Grid using hand-held GPS to determine the coordinates of sampling points for the collection of soil samples. In all, 18 profile pit samples were collected. The profile pits were described morphologically on the field using the FAO guideline on soil profile description. From the various horizons of these profile pits, soil samples were collected.
Results:
Land assessment indicates that the soils of the area are very fragile and inherently low in nutrients. Mapping unit A is moderately suitable for arable crop production while Units B and C are fairly suitable. For agricultural activities, mapping unit D is marginal for arable crop production. Stoniness, steep slope, and shallow soil depth are the major limitations. Mapping unit E is the most suitable for lowland rice production. Soil fertility management ought to be integrated (organic and inorganic). The land evaluation shows that the soils of the project site are very fragile and poor in native fertility. Also, the soils are generally defined by the plinthite content. Apart from the traditional crops grown in the area, some other crops like sweet potato and cowpea will do well on the soil of the area. Crop residue has to be well managed and adopted. Crop rotation and intercropping should be encouraged and included in the soil management plan. Also, due to the low level of organic carbon in the soils, the soils will benefit optimally from the application of manure. This will improve the soil aggregation, water, and nutrient-holding capacities as well as improve the pH status of the soil.
Conclusion:
Soil fertility assessments should be undertaken every two years after continuous cropping. ’High-Intensity Detailed Soil Survey’ of this nature should be carried out every ten years.
1. INTRODUCTION
Nigeria is a tropical agrarian country with a land area of about 923,769 km2 with ecological zones ranging from forests (swamp and rain) to savannah (guinea, Sudan and Sahel) with the savannah occupying almost 79% of the total land expanse [1-3]. In Nigeria's agro-ecological zone, derived savanna developed from the rain forest zone through anthropogenic activities like seasonal fire burning of forest vegetation, regular felling of economic trees, and continuous cropping [4]. Limited fire-resistant trees are present and this zone can change to a forest if these human activities are stopped [5]. The soils of this zone similar to the soils of savannah are generally Alfisols which are known to be low in activity clays, organic matter, and in native fertility. Physically, the soils are fragile with high sand content and prone to degradation [6]. Most of the soils are also plinthic. Plinthic soils are soils that have undergone a series of oxidation processes upon exposure to air and harden irreversibly. They are generally made up of 1: 1 clay minerals (kaolinite and quartz), mainly oxides of aluminum, iron, or both. They are deficient in the primary silicates and their bases [7].
Also, when plinthic soils are exposed to air, they harden up quickly and irreversibly on exposure to wetting and drying. In addition, the plinthic soils are made up of a series of red, brown, and yellow fine-grained residual soils of light texture with nodular gravels and cemented soils [8, 9]. The capabilities of plinthic soils for crop production are related to the thickness of the overlying surface soil.
Therefore, so as to realize the optimum potential of any land, land use capability and suitability classifications should especially be applied for the sensitive and vulnerable areas including such as agricultural lands. Land capability classification is aimed at predicting the crop production potentials of the land improvement units and the use of the land resources [10]. Land suitability is the ability of a portion of land to allow for the cultivation of crops continuously year in year out [11]. The land uses must be in relation to their natural, morphological, and fertility attributes as well as constraints to guide against soil resources from degradation thus realizing farmers' demands for best crop production results [12, 13]. Otherwise, the misuse of lands incompatible with their formation will gradually lead to the degradation of these lands.
Furthermore, it allowed for finding the major constraint for crop production and also allows stakeholders on land use to come up with a crop management plan to overcome such problems, therefore increasing productivity [11]. For Nigeria’s derived savannah soils, there is a dearth of such land-use plans. Also, the derived savannah is known for high agricultural activities by peasant farmers who constitute over 70% of the entire population, and yet the area is hitherto not benefited from any soil studies relevant to the productivity of their crops. Therefore, it is expected that such a study of this nature will enable farmers to embark on well-articulated integrated and sustainable management of soil and crop for optimum performance with the possibility of introducing other arable crops that are not popular in the area. For this reason, the evaluation of land characteristics for the current and prospective capability and suitability of crop production in this ecology is necessary. Therefore, the objective of this study was to evaluate the capability and suitability of plinthic soil of a derived savannah ecology of Nigeria for sustainable crop production.
2. MATERIALS AND METHODS
2.1. Description of the Study Area
The study was carried out in Landmark University Commercial and Teaching and Research Farms, Omu-Aran, Kwara State, Nigeria in the derived savanna agro-ecological zone of Nigeria, and lies within Latitudes 080 37’ and 120 59’N and Longitudes 030 10’ and 070 27’E. The terrain is highly undulating and rugged at the Teaching and Research Farm, with a rolling landscape of various slopes in various directions, and fairly undulating at the Commercial Farm. The areas are generally well-drained with the main hydrological feature being rivers Orisa, Omi Pupa, and other minor rivulets. The slope aspects are gentler on the northern portion while the southern portion is steeper.
Omu-Aran town is situated some 88 kilometers south of Ilorin, capital of Kwara State, and 16 km North-East of Otun- Ekiti, in Ekiti State.
Rainfall in the survey area generally begins in April and ends in October, with a break of about two weeks occurring either in July or August. The Omu-Aran area has a range of 1100 mm to 1300 mm rainfall per annum and with a dry season occurring between November and March/April).
The area falls under the Typic Ustic moisture regime [14]. The concept of the Ustic moisture regime [15] is one of limited moisture, but the moisture is present at a time when conditions are suitable for plant growth. Temperature varies throughout the year. The mean annual temperature is about 32.5°C, with an estimated annual soil temperature of about 34°C. Thus, the area can be regarded as an iso-hyperthermic temperature regime [16]. Relative humidity seldom varies from the average of about 60% throughout the year.
The vegetation consists of tree growth of six to twenty meters in height. Under the tree layers are to be found the usual forest floor shrubs and herbs. The dominant trees are the Sheabutter tree (Butyrospermum paradoxum), rubber tree (Ficus vogelii), locust bean tree (Parkia Clappertoniana), oil palm tree (Elaeis guineensis), Borassus palm, Iroko (Milicia excelsa), Ayin (Anogeissus leiocarpus) and Iya (Daniellia oliveri). Grass species present include Andropogon tectorum, Ctenium newtonii, Pennisetum purpureum, Andropogon gayanus and Imperata cylindrica. The vegetation is presently a woody savanna. The grasses account for about 80% of the total vegetative cover while the shrub and trees only account for 20%.
2.2. Field Study
The exercise was carried out in four (4) stages.
Stage 1: This was a Reconnaissance visit to the site for identification, and to get familiar with the site. During this visit, several landmarks that would be useful during the exercise were identified. These were useful for the location of a baseline and traversing.
Stage 2: This was the Desk Study of all available information, data and maps of the area including topographic maps, survey plans, and perimeter maps. However, a survey map (survey plan) of the area at a scale of 1:10,000 was provided by the Physical Planning and Development (PPD) Landmark University, and this in conjunction with other maps, was used as a base map for the exercise.
Stage 3: This was the proper field work. The methodology was essentially Grid using hand-held GPS to determine the coordinates of sampling points for collection of surface samples.
The Base maps that were used for the surveys were obtained from the Director of Physical Planning and Development (PPD), Landmark University, Omu-Aran. The entire area was then gridded into rectangular polygons 100 m by 100 m to obtain surface soil samples in designated areas. A flexible Grid method was thus employed for the survey and supplemented with a free system of survey. The Base maps were used to identify the land use/land cover pattern of the area, settlements, road networks, and water channels. At each sampling point, the following observations were recorded: coordinates, using hand-held GPS, land use, topography, erosion and erosional features, surface pans, rock outcrops, vegetation, etc. The following assignments were also carried out; (a) identification of major land features and landmarks, (b) traversing along with planned Grids, (c) collection of surface soil samples (0-30 cm) from each sampling point for laboratory analyses, (d) air drying of all soil samples after each day’s work, (e) land use characterization, (f) observation, identification, and recording of other field features.
The ‘Grid’ map was used as the basis of sampling. At each designated sampling point, augering was done at intervals of 15 cm from the surface of the soil to 100 cm depth except in areas where underground plinthite or stone limited the augering depth. The purpose of this augering is to delineate soil boundaries and cite soil profile pits. Soil samples were collected from some designated points as well as from the profile pits.
A total of 18 profile pit samples were collected. The profiles pits were described morphologically on the field using the FAO [16] guideline on soil profile description. Soil samples were collected from the pedogenic horizons of these profile pits.
Stage 4: This involved laboratory analyses of the soil samples for the following nutrient parameters; (a) soil reaction (pH), (b) particle size distribution (textural analysis), (c) exchangeable bases (calcium, sodium, potassium and magnesium), (d) available phosphorus, (e) total acidity, (f) organic carbon / organic matter, and (g) cation exchange capacity.
2.3. Laboratory Analysis
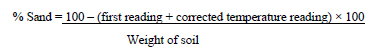
The particle size analysis was determined using the method of Bouyoucos [17] as described by Gee and Or [18]. Fifty grams of 2 mm sieved soil was weighed into 250 ml conical flasks and 50 ml of 5% sodium hexametaphosphate solution (Calgon solution) was added and left for 15 minutes to disperse. One hundred mills of distilled water were added to the soil sample and left till the following day. The mixture was quantitatively transferred into a dispersing cup and dispersed using a mechanical stirrer for 10 minutes. The mixture was immediately transferred to a 1000 ml measuring cylinder. The dispersing cup was rinsed into the measuring cylinder until there was no trace of soil particle in the cup. Thereafter water was added to fill the cylinders up to the 900 ml mark and a hydrometer was inserted into the cylinder before adding water to the 1000 ml mark. After the hydrometer was removed, the cylinder was tightly covered carefully to avoid leakage and the content was thoroughly mixed by inverting the cylinder several times. The cylinder and the content were placed on the laboratory table and the stopwatch was immediately set to take count of the time. At about 40 seconds, the hydrometer was gently inserted into the cylinder and at 40 seconds, hydrometer reading was taken. Immediately after the hydrometer reading, the temperature of the dispersing medium was also taken. Both the hydrometer and temperature reading were recorded (first readings). After 2 hours, the temperature and the hydrometer readings were taken again for the second readings. The percentages of sand, clay, and silt content in the soil were calculated using the formula below:
 |
(1) |
 |
(2) |
 |
(3) |
The soil pH was determined in water (1:2 soil to water ratio) and in 1N potassium chloride (1:2 soil to solution ratio) using a digital pH meter. The organic carbon was determined by the Walkley-Black method on soil samples reduced to 0.5mm particle size [19] as described by Nelson and Sommers [20].
The available P was determined according to the method of Frank et al. [21] by using Bray-1 extractant at a soil: extractant ratio of 1:5. The exchangeable bases (K, Ca, Na and Mg) were extracted using normal neutral ammonium acetate [22]. 5 grams of 2 mm sieved soil sample was weighed into a sample bottle and 50 mL of ammonium acetate (pH 7.0) was added. The solution was shaken by a mechanical shaker for an hour, allowed to settle and then filtered. The exchangeable sodium (Na+) and potassium (K+) contents of the filtrates were determined by a flame photometer while the exchangeable calcium (Ca+) and magnesium (Mg+) were read on Atomic Absorption Spectrophotometer (AAS). The Effective Cation Exchange Capacity was expressed as the summation of exchangeable cation and exchangeable acidity [23].
Exchange acidity was determined by weighing 5 g of dried soil into a sample bottle and 50 mL of 1N KCL was added to it. The mixture was shaken for 1 hour and the suspension was filtered using a filter paper to obtain the filtrate. 25 mL of the extract was pippeted into a 100 mL conical flask and 4 drops of phenolphthalein indicator were added. The mixture was titrated against 0.01N NaOH. The colour changed from colourless to pink colour at the end point.
 |
Where, T = sample titre value (mL), B = blank titre value (mL), W = soil weight (g), V1 = volume of extracting solution (mL), V2 = volume of soil extractant (mL), CNaOH = standardized concentration of NaOH (0.002 M NaOH).
2.4. Land Capability and Suitability Evaluation
The Land Capability Evaluation system (USDA) was assessed using seven key soil qualities considered important for crop production. The soil qualities include nutrient availability, nutrient retention capacity, rooting conditions, oxygen availability to roots, excess salts, toxicities, and workability. The land qualities selected for the evaluation are those that cannot be changed by minor land improvement (permanent limitation) and include slope angle, soil depth, and climate. Others include the cation exchange capacity of the subsoil, soil permeability, soil texture, and coarse fragment content of the soil (Tables 1 and 2).
The capability class of each mapping unit was determined by assigning ratings to the selected land qualities in accordance with the conversion (Tables 3 and 4). Applying the principle of the most limiting characteristics, a mapping unit belongs to the lowest class to which it is allocated by this procedure; that is, the most limiting land quality determines the capability classification of each mapping unit.
| Limitation | Arable- Classes | Non- Arable Classes | ||||||
|---|---|---|---|---|---|---|---|---|
| I | II | III | IV | V | VI | VII | VIII | |
| Slope angle (Degrees) | 1 | 3 | 5 | 8 | 10 | 18 | 35 | Any |
| Outcrops and Boulders | 0 | 1 | 2 | 5 | 10 | 15 | 25 | >25 |
| Drainage/Wetness class | WD | MWD | MD | MD | ID | PD | PD | Any |
| Effective soil depth | 150 | 100 | 60 | 40 | 30 | 20 | 20 | 0 |
| Soil textural class | SCL-C | SL – C | SL - C | LS-C | LS-C | LS-HC | LS-HC | Any |
| Soil Permeability | Moderate | Rapid – slow | Rapid – slow | Rapid – slow | Rapid – slow | Any | Any | Any |
| Available water capacity (cm/m) | 0.25 | 0.20 | 0.15 | 0.10 | 0.08 | 0.05 | 0.02 | 0 |
| ECEC of subsoil (cmol Kg-1) | 20 | 15 | 10 | 8 | 5 | 5 | 2 | 0 |
| Total Soluble Salt (%) | 0.2 | 0.2 | 0.4 | 0.4 | 0.4 | 0.8 | 1.0 | Any |
| Limitation | BL1 | BL2 | BL3 | BL5 | BL6 | BL7 | BL8 | BL9 |
|---|---|---|---|---|---|---|---|---|
| Slope angle (Degrees) | II | II | Ii | II | II | VI | II | II |
| Outcrops and Coarse fragment % | II | II | III | III | III | IV | II | II |
| Drainage/Wetness class | I | II | I | I | I | I | I | II |
| Effective soil depth | II | II | I | III | II | II | I | III |
| Soil textural class | II | II | II | II | II | II | II | II |
| Soil Permeability | II | II | II | II | II | II | II | II |
| Available water capacity (cm/m) | I | I | I | IV | I | II | I | II |
| ECEC of subsoil (ccmol Kg-1) | IV | IV | IV | IV | IV | IV | IV | IV |
| Total Soluble Salt (%) | I | I | I | I | I | I | I | I |
| Capability Class | IV | IV | IV | IV | IV | VI | IV | IV |
| Capability subclass | F | F | Fs | Fsd | Fs | Fsg | F | F |
| Capability unit | 2 | 2 | 2 | 2 | 2 | 2 | 2 | 2 |
| Overall Capability classification | IVf-2 | IVf-2 | IVfs-2 | IVfsd-2 | IVfs-2 | IVfsg-2 | IVf-2 | IVf-2 |
| Land quality and characteristics | S1 | S2 | S3 | N1 | N2 |
|---|---|---|---|---|---|
| Climate (c) | |||||
| Annual rainfall (mm) | 850-1250 | 850-750 | 750-600 | 600-500 | - |
| 1250-1600 | 1600-1800 | >1800 | - | ||
| Length of dry season (days) | 150-220 | 130-150 | 110-130 | 90-110 | |
| Mean annual maximum temp. (oC) | 22-26 | 22-18 | 18-16 | 36-30 | |
| 26-32 | 32+ | ||||
| Relative humidity (%) | 50-80 | 50-42 | >80 | ||
| Topography (t) | |||||
| Slope (%) | 0-2 | 2 – 4 | 4 – 8 | 8 – 16 | >30-50 |
| 0-4 | 4 – 8 | 8 – 16 | 16 – 32 | ||
| Wetness (w) | |||||
| Flooding | FO | Moderate | FI | Aerie | Poor |
| Drainage | Good | Moderate | Good | Poor | Drainable |
| Soil Physical Characteristics (s) | |||||
| Texture/structure+ | CL, L | SL, LS | LCS | CS, S | S |
| Coarse fragments (Vol. %), 0-10cm | <3 | 3 - 15 | 15-35 | 35-55 | - |
| Fertility (f) | |||||
| Cation exchange capacity (cmol-kg-1 | <24 | 16-24 | <16(-) | <16(+) | - |
| Base saturation (%) | <50 | 35-50 | 20-35 | <20 | - |
| pH | 5.5-7.0 | 7.0-7.5 | 7.5-8.0 | > 8.0 | - |
| organic carbon (%), 0-15cm | >2 | 1.2-2 | 0.8-1.2 | <0.8 | - |
| Av. P. (mg, kg-1) | >22 | 13-22 | 7.13 | 7-Mar | >3 |
| Total N. (%) | >0.15 | 0.10-15 | 0.08-01 | 0.04-0.08 | >0.4 |
| Extr, K (cmol.kg-1) | >0.05 | 0.3-0.5 | 0.2-0.3 | 0.1-0.2 | >0.1 |
| Land quality and characteristics | S1 | S12 | S2 | S3 | N1 | N2 |
|---|---|---|---|---|---|---|
| Climate (c): | ||||||
| Annual rainfall (mm) | >1200 | 1000-1200 | 800-1000 | 600-800 | <600 | Any |
| Length of rainy season (months) | >5 | 4-5 | 3-4 | 2-3 | <2 | Any |
| Mean annual maximum temp. (oC) | >29 | 27-29 | 24-27 | 22-24 | <22 | Ditto |
| Mean daily minimum temp. (oC) | >20 | 18-20 | 16-18 | 14-16 | <14 | Ditto |
| Mean annual temp. (oC) | >25 | 22-25 | 20-22 | 18-20 | <18 | Ditto |
| Relative humidity (%) | >75 | 70-75 | 65-70 | 60-65 | <60 | Ditto |
| Topography (t) | ||||||
| Slope (%) | 0-4 | 4-8 | 8-12 | 12-16 | >16 | Ditto |
| Wetness (w) | ||||||
| Flooding | Fo | Fo | F1 | F2 | F2 | F3 |
| Drainage | WD | WD | WD | ID | PD | VPD |
| Soil Physical Characteristics (s) | ||||||
| Texture | LS | SL | SC | SCL | Any | C, CL |
| Structure | Crumb | Crumb | Sbk | Sbk | CO | CO |
| Coarse fragments (Vol. %), 0-30cm | 3-10 | 10-15 | 15-35 | 35-55 | >55 | Any |
| Soil depth | >100 | 90-100 | 50-90 | 25-50 | <25 | Any |
| Fertility (f) | ||||||
| Cation exchange capacity (cmol-kg-1) | >10 | 8-10 | 6-8 | 4-6 | 2-4 | <2 |
| Base saturation (%) | >70 | 60-70 | 40-60 | 20-40 | 10-20 | <10 |
| pH | 6.0-6.5 | 6.5-7.0 | 7.0-7.5 | 7.5-80 | >8.0 | Any |
| organic carbon (%) 0-30 cm | >2.0 | 1.5-2.0 | 1.25-1.5 | 1.0-1.25 | 0.8-1.0 | <0.8 |
| Av. P. (mg, kg-1) 0-30 cm | >22 | 16-22 | 12-16 | 8-12 | 4-8 | <4 |
| Ca (mole fraction) | 0.8-0.9 | 0.7-0.8 | 0.6-0.7 | 0.4-0.6 | 0.2-0.4 | <0.2 |
The suitability of the land for the production of selected arable crops (rice, maize, cassava, and cowpea) was conducted using the parametric linear model of land evaluation [24] and the square root models [25-27]. Each profile was assigned to a suitability class by matching its characteristics and qualities with the land requirements for maize production (Table 3), cowpea (Table 4), cassava (Table 5), and upland rice (Table 6). The land qualities considered for evaluation are those that have direct bearing with the yield of rice and include the climate (c), topography (t), drainage characteristics (w), soil physical characteristics (s), and soil chemical fertility (f). The soil fertility (f) was assessed using the soil reaction, and the level of macro and micronutrients. In computing the potential suitability for the production of the selected crops, the fertility factors that can be amended by fertilizer additions and management practices were excluded. These factors include the level of available micro-nutrients (Fe, Zn, and Mn), the levels of N, P, K, and the organic matter content of the soil. However, the soil CEC, percent base saturation, and pH were considered. The current suitability was computed linearly using the index of current (actual) productivity (IPC) of Storie [24].
Table 5.
| Land quality and characteristics | S1 | S12 | S2 | S3 | N1 | N2 |
|---|---|---|---|---|---|---|
| Climate (c) | ||||||
| Annual rainfall (mm) | >1200 | 1000-1200 | 800-1000 | 600-800 | <600 | Any |
| Length of rainy season (months) | >5 | 4-5 | 3-4 | 2-3 | <2 | Any |
| Mean annual maximum temp. (oC) | >29 | 27-29 | 24-27 | 22-24 | <22 | Ditto |
| Mean daily minimum temp. (oC) | >20 | 18-20 | 16-18 | 14-16 | <14 | Ditto |
| Mean annual temp. (oC) | >25 | 22-25 | 20-22 | 18-20 | <18 | Ditto |
| Relative humidity (%) | >75 | 70-75 | 65-70 | 60-65 | <60 | Ditto |
| Topography (t) | ||||||
| Slope (%) | 0-4 | 4-8 | 8-12 | 12-16 | >16 | Ditto |
| Wetness (w) | ||||||
| Flooding | Fo | Fo | F1 | F2 | F2 | F3 |
| Drainage | WD | WD | WD | ID | PD | VPD |
| Soil Physical Characteristics (s) | ||||||
| Texture | LS | SL | SC | SCL | Any | C, CL |
| Structure | Crumb | Crumb | Sbk | Sbk | CO | CO |
| Coarse fragments (Vol. %), 0-30cm | 3-10 | 10-15 | 15-35 | 35-55 | >55 | Any |
| Soil depth | >100 | 90-100 | 50-90 | 25-50 | <25 | Any |
| Fertility (f) | ||||||
| Cation exchange capacity (cmol-kg-1) | >10 | 8-10 | 6-8 | 4-6 | 2-4 | <2 |
| Base saturation (%) | >70 | 60-70 | 40-60 | 20-40 | 10-20 | <10 |
| pH | 6.0-6.5 | 6.5-7.0 | 7.0-7.5 | 7.5-80 | >8.0 | Any |
| organic carbon (%) 0-30 cm | >2.0 | 1.5-2.0 | 1.25-1.5 | 1.0-1.25 | 0.8-1.0 | <0.8 |
| Av. P. (mg, kg-1) 0-30 cm | >22 | 16-22 | 12-16 | 8-12 | 4-8 | <4 |
| Ca (mole fraction) | 0.8-0.9 | 0.7-0.8 | 0.6-0.7 | 0.4-0.6 | 0.2-0.4 | <0.2 |
| Land Qualities | S11 | S12 | S2 | S3 | N1 | N2 |
|---|---|---|---|---|---|---|
| Climate (c) | ||||||
| Annual Rainfall (mm) | >1000 | 900-1000 | 800-900 | 600-800 | 600-500 | <500 |
| Mean annual temperature (°C | >25 | 22 – 25 | 20 – 22 | 18 – 20 | 16 – 18 | <16 |
| Relative humidity (%) | >75 | 70 – 75 | 65 – 70 | 60 – 65 | <60 | |
| Topography (t) | <2 | 3-4 | 5 – 6 | 7 - 8 | 9 – 10 | >10 |
| Slope (%) | ||||||
| Drainage (s) | ||||||
| Wetness | WD (ID)† | MWD (ID) † | MD | ID (WD) † | PD (WD) † | PD (WD) † |
| Flooding | Fo | Fo | F1 | F1 | F2 | F3 |
| Soil physical properties (s) | ||||||
| Texture | L (LC)† | Lfs (SLC) † | LS (SL) † | S | S | S |
| Structure | Cr (SAB) † | C (SAB) † | SAB (Cr) † | SAB (Cr) † | Col (Cr) † | Col (Cr) † |
| Coarse fragments (%) (0-45cm) | <3 | 3 – 5 | 5 – 10 | 10 – 15 | >15 | |
| Soil depth (cm) | >75 | 65 -70 | 50 – 65 | 35 – 50 | 30 – 35 | <30 |
| Fertility (f) | ||||||
| pH | 5.5 – 6.5 | 5.0 - 5.5 | 4.5 – 5.0 | 4.0 -4.5 | <4.0 | |
| Cation Exchange Capacity (cmol Kg-1) | >16.0 | 12.0 -16.0 | 8.0 -12.0 | 5.0 – 8.0 | <5.0 | |
| Base saturation (%) | >80 | 70 – 80 | 50 -70 | 40 – 50 | 25 -35 | <25 |
| Organic carbon (%) (0-30 cm) | >2.0 | 2.0 – 1.5 | 1.2 – 1.5 | 1.0 – 1.2 | 1.0 | <1.0 |
| Macro- nutrients | ||||||
| Nitrogen (%) | >2.0 | 1.5 – 2.0 | 1.0 – 1.5 | 0.5 – 1.0 | <0.5 | |
| Phosphorus (mg kg-1) | >20 | 15 – 20 | 8 – 15 | 5 – 8 | 3 – 5 | <3 |
| Potassium (cmol/kg) | >0.5 | 0.3 -0.5 | 0.2 – 0.3 | 0.1- 0.2 | <0.1 | |
| Micro-nutrient (0.5 N Hcl) | ||||||
| Iron (Fe) (mg kg-1) | >4.5 | 3.5 – 4.5 | 2.5 – 3.5 | 1.5 – 2.5 | 1.0 – 1.5 | <1.0 |
| Zinc (Zn) (mg kg-1) | 2.0-2.5 | 1.5 – 2.0 | 1.0 – 1.5 | 0.8 – 1.0 | 0.6 -0.8 | <0.6 |
| Manganese (Mn) (mg kg-1) | 1.5 – 1.7 | 1.0 – 1.5 | 0.8 – 1.0 | 0.6 – 0.8 | 0.5 – 0.6 | <0.5 |
IPC = A × B/100 × S/100 × C/100 ×….. F/100 ----- (i)
Where, IPC is the index of current (actual) productivity, A is the overall least rating characteristic and B, C..... are the least rating characteristic for each land quality group.
The potential suitability (IPP) was similarly computed using the potential index of productivity.
3. RESULTS AND DISCUSSION
The physical and chemical characteristics of pedons of Commercial and Teaching and Research Farms are presented in Tables 7 and 8, respectively. Sand content ranges from 55.7% - 82.7%. Silt ranges from 3.5% - 11.0%, while clay ranges from 7.8% - 40.8%. Within the soil profiles, the clay contents generally increased as the profile depth increases with argilluviation occurring in the second, third or fourth horizons of some pedons. One of the unique characteristics of the soil of this site is the occurrence of stones and gravels within the soil profiles. The soils had gravel contents that ranged from 0.9% to 71.7%. The distribution of gravelly materials within the soil profiles varied between the mapping units. In some mapping units, the gravel content increased as the profile depth increased while in some others, the gravel contents decreased as the profile depth increased. The gravels which were quartz, granite gneiss or ironstones (plinthite) ranged in sizes from small stones to boulders. It was reported that the major variability in the plinthite present in the savannah agroecology of Nigeria was measured in terms of the depth, thickness, and structure of the plinthite [28].
| Gravel >2 <76 mm |
Sand (%) |
Silt (%) |
Clay (%) |
Textureal class | C (%) | pH (1:2) | pH (1:2) | Avail P mg P/kg soil | Al+H (cmol(+)/kg) | Ca2+ (cmol(+)/kg | Mg2+ (cmol(+)/kg | K+ (cmol(+)/kg | Na+ (cmol(+)/kg | ECEC (cmol(+)/kg | Base saturation (%) | |
|---|---|---|---|---|---|---|---|---|---|---|---|---|---|---|---|---|
| v-v (%) | water | 1 M KCl | ||||||||||||||
| Profile 1 | ||||||||||||||||
| AP (0-27 cm) | 15.0 | 82.7 | 6.0 | 11.3 | LS | 2.69 | 5.4 | 5.2 | 16.83 | 0.23 | 2.00 | 5.10 | 1.13 | 0.01 | 8.5 | 97.3 |
| Bt1 (27-41cm) | 64.5 | 79.7 | 3.0 | 17.3 | SL | 0.61 | 4.1 | 3.8 | 6.07 | 1.22 | 1.00 | 1.60 | 0.46 | 0.01 | 4.3 | 71.6 |
| Bt2 (41-41cm) | 54.8 | 81.7 | 5.0 | 13.3 | SL | 0.23 | 3.9 | 3.9 | 4.70 | 1.08 | 0.90 | 1.80 | 0.31 | 0.02 | 4.1 | 73.7 |
| Bt3 (70-93cm) | 71.7 | 81.7 | 5.5 | 12.8 | LS | 0.29 | 4.1 | 3.8 | 5.91 | 1.11 | 0.70 | 2.60 | 0.26 | 0.01 | 4.7 | 76.3 |
| C (93-138cm) | 56.6 | 80.7 | 4.5 | 14.8 | SL | 0.32 | 4.0 | 3.8 | 5.31 | 1.54 | 0.70 | 1.10 | 0.31 | 0.01 | 3.7 | 57.9 |
| Median | 56.6 | 81.7 | 5.0 | 13.3 | 0.32 | 4.1 | 3.8 | 5.91 | 1.11 | 0.90 | 1.80 | 0.31 | 0.01 | 4.30 | 73.7 | |
| Mean | 52.5 | 81.3 | 4.8 | 13.9 | 0.83 | 4.3 | 4.1 | 7.76 | 1.04 | 1.06 | 2.44 | 0.49 | 0.01 | 5.06 | 75.36 | |
| SD | 22.0 | 1.14 | 1.15 | 2.27 | 1.05 | 0.62 | 0.61 | 5.09 | 0.48 | 0.54 | 1.58 | 0.36 | 0.01 | 1.96 | 14.1 | |
| CV | 41.9 | 1.40 | 23.9 | 16.3 | 126.5 | 14.4 | 14.9 | 65.6 | 46.1 | 50.9 | 64.7 | 73.5 | 100 | 38.7 | 18.7 | |
| Profile 2 | ||||||||||||||||
| AP (0-24 cm) | 50.7 | 69.7 | 11.0 | 19.3 | SL | 4.04 | 5.4 | 5.1 | 5.46 | 0.21 | 1.90 | 8.50 | 1.33 | 0.01 | 12.0 | 98.2 |
| Bt1 (24-30cm) | 60.5 | 62.7 | 5.5 | 31.8 | SCL | 1.53 | 4.9 | 4.4 | 2.73 | 0.31 | 4.20 | 1.90 | 0.67 | 0.03 | 7.1 | 95.6 |
| Bt2 (30-77cm) | 46.1 | 59.7 | 5.0 | 35.3 | SC | 0.72 | 5.2 | 4.9 | 1.97 | 0.18 | 3.10 | 2.00 | 0.62 | 0.01 | 5.9 | 97.0 |
| Bt3 (77-110cm) | 33.3 | 60.7 | 5.5 | 33.8 | SCL | 0.57 | 4.9 | 4.6 | 2.27 | 0.22 | 1.20 | 3.50 | 0.46 | 0.01 | 5.4 | 95.9 |
| C (110-132cm) | 28.1 | 73.7 | 6.0 | 20.3 | SCL | 0.44 | 4.9 | 5.0 | 5.00 | 0.20 | 1.80 | 2.70 | 0.21 | 0.01 | 4.9 | 95.9 |
| Median | 46.1 | 62.7 | 5.5 | 31.8 | 0.72 | 4.9 | 4.9 | 2.73 | 0.21 | 1.9 | 2.7 | 0.62 | 0.01 | 5.9 | 95.0 | |
| Mean | 43.7 | 65.3 | 6.6 | 28.1 | 1.40 | 5.1 | 4.8 | 3.4 | 0.22 | 2.44 | 3.72 | 0.65 | 0.01 | 7.06 | 96.5 | |
| SD | 13.1 | 6.1 | 2.4 | 7.6 | 1.50 | 0.23 | 0.29 | 1.62 | 0.05 | 1.20 | 2.7 | 0.41 | 0.01 | 2.87 | 1.08 | |
| CV | 29.9 | 9.3 | 36.4 | 27.0 | 107.1 | 4.5 | 6.0 | 47.6 | 22.7 | 49.2 | 72.5 | 63.1 | 100 | 40.6 | 1.1 |
| Gravel >2 <76 mm | Sand (%) | Silt (%) | Clay (%) | Textural class | C (%) | pH (1:2) | pH (1:2) | Avail P mg P/kg soil |
Al+H (cmol(+)/ kg) |
Ca2+ (cmol(+)/ kg |
Mg2+ (cmol(+)/ kg |
K+ (cmol(+)/ kg |
Na+ (cmol(+)/ kg |
ECEC (cmol(+)/ kg |
Base saturation (%) | |
|---|---|---|---|---|---|---|---|---|---|---|---|---|---|---|---|---|
| Profile 3 | ||||||||||||||||
| Ag (0-12 cm) | 2.3 | 78.7 | 9.5 | 11.8 | SL | 0.73 | 4.9 | 4.2 | 4.40 | 0.34 | 1.10 | 0.90 | 0.16 | 0.02 | 2.5 | 86.4 |
| Btg1 (12-24 cm) | 1.3 | 77.7 | 10.0 | 12.3 | SL | 0.67 | 5.0 | 4.2 | 5.00 | 0.27 | 1.10 | 0.70 | 0.15 | 0.01 | 2.2 | 87.9 |
| Btg2 (24-43 cm) | 0.9 | 79.7 | 10.5 | 9.8 | LS | 0.33 | 5.4 | 4.4 | 5.91 | 0.23 | 1.00 | 1.20 | 0.15 | 0.01 | 2.6 | 91.1 |
| Cg (43-62 cm) | 4.0 | 87.7 | 4.5 | 7.8 | S | 0.23 | 6.2 | 5.2 | 6.37 | 0.12 | 1.20 | 0.20 | 0.15 | 0.01 | 1.7 | 92.9 |
| Median | 1.8 | 79.2 | 9.8 | 10.8 | 0.5 | 5.2 | 4.3 | 5.4 | 0.25 | 1.1 | 0.80 | 0.15 | 0.01 | 2.35 | 89.5 | |
| Mean | 2.12 | 80.9 | 8.6 | 10.4 | 0.49 | 5.4 | 4.5 | 5.4 | 0.24 | 1.1 | 0.75 | 0.153 | 0.013 | 2.25 | 89.6 | |
| SD | 1.38 | 4.57 | 2.8 | 2.06 | 0.24 | 0.59 | 0.47 | 0.88 | 0.09 | 0.08 | 0.42 | 0.005 | 0.005 | 0.40 | 2.9 | |
| CV | 65.1 | 5.64 | 32.6 | 19.8 | 48.9 | 10.9 | 10.4 | 16.3 | 37.5 | 7.3 | 56 | 3 | 38.5 | 17.8 | 3.3 | |
| Profile 4 | ||||||||||||||||
| Ap (0-77cm) | 52.5 | 68.7 | 8.5 | 22.8 | SCL | 1.84 | 5.7 | 4.9 | 3.34 | 0.23 | 4.20 | 0.10 | 0.56 | 0.04 | 5.1 | 95.5 |
| BT1 (32 -77 cm) | 56.0 | 56.7 | 4.0 | 39.3 | SCL | 0.87 | 5.4 | 4.5 | 2.43 | 0.37 | 0.30 | 3.90 | 0.67 | 0.03 | 5.3 | 93.0 |
| Bt2 (77-130 cm) | 51.8 | 55.7 | 3.5 | 40.8 | SC | 0.53 | 5.4 | 4.8 | 2.27 | 0.27 | 3.10 | 0.70 | 0.72 | 0.03 | 4.8 | 94.4 |
| C (130-155 cm) | 51.0 | 70.7 | 6.0 | 23.3 | SCL | 0.50 | 5.7 | 5.3 | 3.49 | 0.21 | 2.00 | 0.90 | 0.36 | 0.03 | 3.5 | 94.0 |
| Median | 52.1 | 62.7 | 5.0 | 31.3 | 0.70 | 5.5 | 4.87 | 2.88 | 0.25 | 2.5 | 0.80 | 0.61 | 0.03 | 4.9 | 94.2 | |
| Mean | 52.8 | 62.9 | 5.5 | 3.5 | 0.93 | 5.5 | 4.85 | 2.88 | 0.27 | 2.4 | 1.4 | 0.57 | 0.033 | 4.6 | 94.2 | |
| SD | 2.2 | 7.8 | 2.3 | 9.8 | 0.62 | 0.17 | 0.33 | 0.62 | 0.71 | 1.66 | 1.70 | 0.16 | 0.005 | 0.8 | 1.03 | |
| CV | 4.2 | 12.4 | 41.8 | 280 | 66.6 | 3.1 | 6.8 | 21.5 | 262.9 | 69.2 | 121.4 | 28.1 | 15.1 | 17.3 | 1.1 |
The soils had reactions ranging from extremely acidic (3.8) to slightly acidic (6.2). Generally, the soils of the area are very acidic. It was earlier reported [6, 29] that tropical savannah soils are acidic. The soils had exchangeable acidity (EA) that varied from 0.12 to 1.54 cmol/kg of soil. Like most tropical soils, the exchange sites of these soils were dominated by exchangeable calcium and magnesium. The exchangeable calcium (Ca2+) ranged in values between 0.7 cmol kg-1 and 4.2 cmol kg-1. Magnesium (Mg2+) contents ranged from 0.20 to 8.5 cmol kg-1. Exchangeable K+ varied from 0.15 cmol kg-1 to 1.33 cmol kg-1. The exchangeable sodium (Na+) contents of the soils ranged from 0.01 cmol kg-1 to 0.04 cmol kg-1.
The average values of exchangeable calcium K within the rooting zones are well above the suggested critical values of 1.50 – 2.0 cmol kg-1 for Ca2+ and 0.16- 0.2 cmol kg-1 for most arable crops grown in the savanna agro-ecology of Nigeria [30]. This means that Ca2+ and K supply should not limit crop production in these soils. The exchangeable sodium (Na+) contents of the soils were low, so it would not constitute any hindrance to crop production on these soils. Organic carbon varied from 0.23% (very low) to 4.04% (very high). On average, the organic matter is moderate. Phosphorus contents are generally low with about 3 or 4 samples posting moderate (1.97 mg/kg to 16.83 mg/kg). The ECEC values vary from 1.7 cmol kg -1 to 8.5 cmol kg – 1. Over 90% of the samples posted below 5 cmol kg -1 which are very low values. Thus, the soils of the area are very poor in their ability to exchange cations, and therefore fertilizers must be applied in split doses.
The soil structural classes (Fig. 1) ranged from weakly formed fine sub-angular blocky in the surface horizons to strongly formed medium and coarse angular blocky structures in the subsurface horizons. The consistencies were moderately weak on the surface to extremely very hard in the sub-surface horizons of the soil profiles (Tables 9 and 10). The surface soils had different shades ranging from black to very dusky red. The general colour hue ranged from 10 YR to 2.5 YR with colour values ranging from 2 to 5 and chroma variations between 1 and 6 (Tables 9 and 10). Mottling in mapping unit profile pit 3 was a result of a high seasonal water table caused by the topography. Pedons that have been subjected to repeated wetting and drying cycles as a result of fluctuating water tables developed mottles while those that were well-drained throughout the year had no mottles. This is because they are fully oxidized with no reduction taking place and is therefore not mobile [31]. Fe2+ moves relatively well in soil solution and as it reacts in oxygenated horizons, it precipitates out, therefore, resulting in mottled zones in the soil fabric.
| Pedon/depth | colour | Colour description | Consistency | Root | Boundary | structure |
|---|---|---|---|---|---|---|
| Profile 1 | ||||||
| AP (0-27 cm) | 7.5YR 3/3 | Dark brown | Very hard | Few medium woody roots | Clear smooth boundary | Medium sub-angular blocky |
| Bt1 (27-41cm) | 7.5 YR 3/6 | Bright brown | Very hard | Few fine fibrous roots | Clear boundary smooth | Medium sub-angular blocky |
| Bt2 (41-41cm) | 2.5 YR 3/6 | Dark reddish brown | Hard | Few fine fibrous roots | Abrupt smooth boundary | Fine sub-angular blocky |
| Bt3 (70-93cm) | 2.5 YR 5/8 | Bright brown | Moderately strong | Very few fine fibrous roots | Abrupt smooth boundary | Medium sub-angular blocky |
| C (93-138cm) | 10 YR 5/8 | Yellowish brown | Very strong | - | - | Medium sub-angular blocky |
| Profile 2 | ||||||
| AP (0-24 cm) | 7.5 YR 3/4 | Dark brown | Slightly hard | Few medium fibrous root | Abrupt wavy boundary | Medium sub-angular blocky |
| Bt1 (24-30cm) | 5 YR 4/8 | Reddish brown | Slightly hard | Few medium woody roots | Abrupt wavy boundary | Medium sub-angular blocky |
| Bt2 (30-77cm) | 2.5 YR 3/6 | Dark reddish brown | Slightly hard | No roots | Abrupt wavy boundary | Medium sub-angular blocky |
| Bt3 (77-110cm) | 2.5 YR 3/4 | Dark reddish brown | Very hard | No roots | Abrupt wavy boundary | Coarse angular blocky |
| C (110-132cm) | 2.5 YR 4/8 | Light brown | Very hard | No roots | - | Coarse angular blocky |
| Pedon/depth | colour | Colour description | Consistency | Root | Boundary | Structure |
|---|---|---|---|---|---|---|
| Profile 3 | ||||||
| Ag (0-12 cm) | 7.5YR 7/1 | Light brownish gray | Moderately weak | Few medium fibrous roots | Clear smooth boundary | Medium sub-angular blocky |
| Btg1 (12-24cm) | 7.5 YR 6/1 | Brownish gray | Moderately weak | Few fine fibrous roots | Clear boundary smooth | Medium sub-angular blocky |
| Bt2 (24-43cm) | 7.5 YR 6/1 | Brownish gray | Moderately weak | Very few fine fibrous roots | Clear boundary smooth | Medium sub-angular blocky |
| Cg (43-62cm) | 7.5 YR 6/1 | Brownish gray | Moderately strong | - | - | Medium sub-angular blocky |
| Profile 4 | ||||||
| AP (0-32 cm) | 5 YR 3/4 | Dark reddish brown | Slightly hard | Few medium fibrous root | Abrupt wavy boundary | Medium sub-angular blocky |
| Bt1 (32-77 cm) | 2.5 YR 3/6 | Dark reddish brown | Hard | Few medium woody roots | Abrupt wavy boundary | Medium sub-angular blocky |
| Bt2 (77-130cm) | 2.5 YR 4/8 | Reddish brown | Slightly hard | No roots | Abrupt wavy boundary | Medium sub-angular blocky |
| C (130-155cm) | 7.5 YR 7/8 | Dark reddish brown | Very hard | No roots | - | Coarse angular blocky |
| C (110-132cm) | 2.5 YR 4/8 | Light brown | Very hard | No roots | - |
3.1. Land Capability Classification
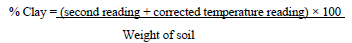
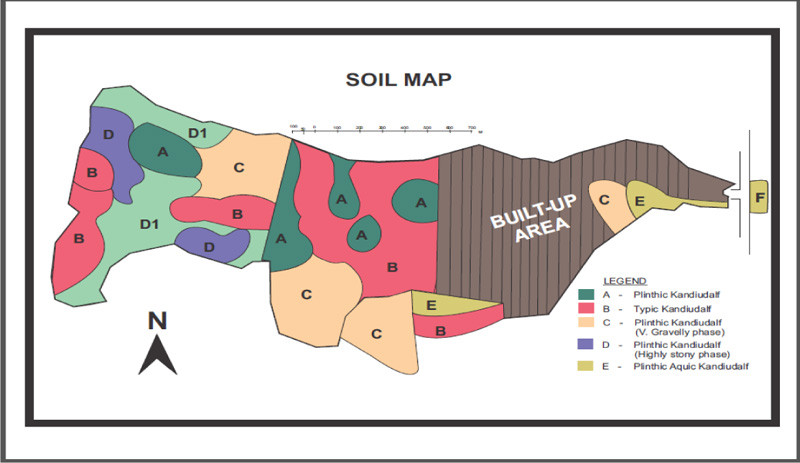
The results of the analysis (Fig. 2) showed that all the mapping units belong to capability class IV (Tables 1 and 2). Mapping Unit A is gravelly from about 40 cm below the surface, generally moderately sloping and deep soils, and will profitably support arable crop production with optimum inputs (24 hectares). Mapping Unit B is fairly gravelly, moderately sloping, and moderately deep soils and will also support arable crop production with moderate inputs (70 hectares). Mapping Unit C is fairly gravelly from the surface, with gently sloping but deep soils, and will support arable crop production with moderate inputs (49 hectares). Mapping Unit D is strongly sloping with plinthite outcrops in some places, shallow and gravelly from the surface, and will only support arable crop production with more inputs than in A and B (67 hectares). Plinthite are low in plant nutrients. Nutrients are chemically precipitated and therefore become unavailable for crop uptake [32]. In addition, plinthites are high in Fe Al sesquioxides and low in organic matter, Na, Ca, Mg and K, N, P, Mn, etc. thereby limiting crop growth, therefore due to the high amount of Fe in plinthite soils, there is usually the immobilization of phosphorus, limiting its availability to crops [33, 34]. Asiamah and Dwomoh [35] suggested the application of large quantities of organic and inorganic fertilizers to plinthite soils. Mapping Unit E is poorly drained alluvial soils, fairly gravelly, generally flat and deep, and will support low land rice production (5 hectares). Paddy soils include valley bottoms (Gleysols), bottom slopes, and toe slopes (Humic Ferralsol and Gleyic Lixisols) [36].
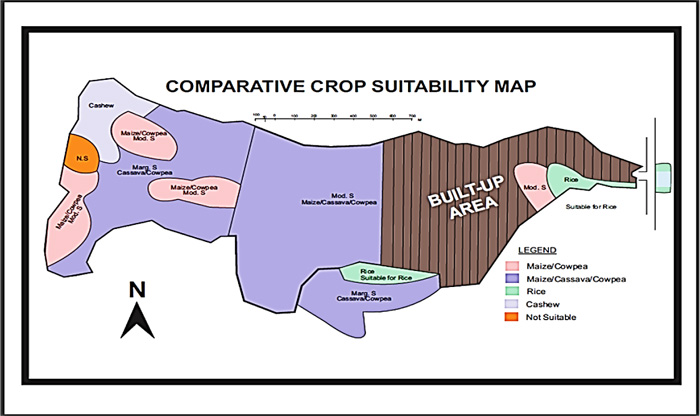
3.2. Comparative Land Suitability Classification for Arable Crop Production
In terms of the suitability (Fig. 3) of the soils for the production of maize, the evaluation result (Tables 3-6) showed that all the mapping units were currently not suitable for maize, cassava, cowpea, and upland rice production. This stems from the low fertility status of all the mapping units, shallowness of depth, and excessive stoniness of most of the mapping units. These conditions are the characteristics of Nigeria’s savannah soils. They are physically fragile because the topsoil has a high percentage of sand, resulting in weak aggregation due to the small amount of organic matter in this soil. The physical limitations are aggravated more in gravelly soils or soils with shallow depth lying on top of plinthic or hardpan layers [37, 38]. However, with the adequate application of appropriate fertilizer, all the mapping units become moderately suitable except mapping unit D (62 hectares) which can support maize production marginally. This may require ridging because of the shallowness of the soil. However, the cost of production may be so high as to reduce the profit margin of such a production venture drastically. For cassava cultivation, evidence from literature indicates that soils that are suitable for maize production, especially those with sandy loam and loamy sand textures, therefore, they will equally be suitable for cassava production. Cassava might do well in moderately fertile soils [39], whereas maize is a nutrient-demanding crop [40]. However, the fertility requirements of cassava are lower than that of maize. Since the major limitations for cassava production in all the mapping units are low fertility and coarse fragments (gravels) in the soil, improving the fertility of the soils by fertilizer application will improve the suitability of mapping units to moderately (S2) suitable (143 hectares). However, mapping unit D will be marginally suitable for cassava production.
Evaluation of the potential suitability of the soil for the production of cowpea (Table 4), a nitrogen-fixing crop (legume) indicated that with the amendment of the soil fertility status all the mapping units except E will become moderately (S2) suitable, while mapping unit D will be marginally suitable (S3). Since cowpea is a nitrogen-fixing plant, adequate application of phosphorus fertilizers will be of uttermost importance in the production of cowpea or any other leguminous crop on the project site. Phosphorus is important in cowpea production as it was reported to promote growth, and bring about nodulation /nodule formation in addition to having a positive effect on the rhizobium legume symbiosis [41].
The evaluation of the site for upland rice production showed that all the pedons had an index of current productivity (IPc) less than 25 and were classified as currently not suitable (N1) for the production of upland rice (Table 6). The major constraints were mainly low levels of available micronutrients, organic matter, and low cation exchange capacity. Also, the soil texture, structure, and coarse fragment (gravel) contents were sub-optima for rice production. Soils for lowland rice cultivation are Gleysols, Humic Ferralsol, and Gleyic Lixisols (Buri and Issaka, 2019)
However, when the potential suitability of the soils (without considering the levels of organic carbon, macro-and micronutrients which are regarded as temporary limitations) was computed, the results indicated that all the mapping units except mapping units D had an index of potential suitability that ranged from 50 to 54, indicating that they could become moderately (S2) suitable for the production of upland rice with the application of the appropriate types and quantity of fertilizers.
In terms of comparative suitability of all the mapping units, mapping unit D (62 hectares) is considered marginally arable. Comparatively, mapping unit E is the most suitable for lowland rice production while mapping units A, B, and C (143 hectares) are moderately suitable for cassava, maize, and cowpea production. However, mapping units D and C (111 hectares) are marginally suitable for maize and therefore cassava and cowpea and are likely to give higher yields per unit input than maize.
CONCLUSIONS AND RECOMMENDATIONS
The land evaluation shows that the soils of the project site are very fragile and poor in native fertility. Also, the soils are generally defined by the plinthite content. Apart from the traditional crops grown in the area, some other crops like sweet potato and cowpea will do well on the soil of the area.
Mapping unit A is moderately suitable for arable crop production, while Units B and C are fairly suitable. For agricultural activities, mapping unit D is marginal for arable crop production. Stoniness, steep slope, and shallow soil depth are major limitations. In addition, this unit is plagued with plinthite outcrops in some places. This makes mechanization very difficult. The shallow soil depth resulting from the stony layer immediately underlying the epipedon of these mapping units also limits the choice of crops that can be planted on them. Minimum tillage methods are the only tillage alternatives that can be used to manage these soils productively.
Soil fertility management should combine organic and inorganic amendments in an integrated system. Sound management of organic residue should be adopted and cropping systems such as crop rotation and intercropping including legumes should be encouraged.
Macronutrients such as nitrogen, potassium, and phosphorus content of the soils were lower than the critical requirement for all the crops evaluated for this project site. However, fertilizers with acidic residual effects such as UREA should be avoided if possible and the use of fertilizers containing calcium or magnesium should be encouraged. Also, due to the low level of organic carbon in the soils, the soils will benefit optimally from the application of manure. This will improve the soil aggregation, water, and nutrient-holding capacities as well as improve the pH status of the soil. Soil tests for fertility evaluation should be carried out every two years after continuous cropping. ‘High-Intensity Detailed Soil Survey’ of this nature should be carried out every ten years.
ETHICS APPROVAL AND CONSENT TO PARTICIPATE
Not applicable.
HUMAN AND ANIMAL RIGHTS
Not applicable.
AVAILABILITY OF DATA AND MATERIALS
The data supporting the findings of the article are available in this manuscript.
FUNDING
None.
CONSENT FOR PUBLICATION
Not applicable.
CONFLICT OF INTEREST
The authors declare no conflict of interest, financial or otherwise.

