All published articles of this journal are available on ScienceDirect.

Productivity of Quinoa (Chenopodium quinoa L.) Genotypes Across Different Agro-Ecological Regions of Oman
Authors Info & Affiliations
Abstract
Background:
Quinoa has the great potentiality of its expansion in world agriculture owing to its resilient traits of productivity under marginal conditions across varying altitudes, soil and climatic conditions with extreme levels of abiotic factors like moisture stress, high temperature and salinity as influenced by climatic change. It offers a crop of food security in several countries that have begun the trials of evaluation since the early 1980s leading to the rapid expansion of its cultivation in other countries after the United Nation’s declaration for 2013 as “Year of Quinoa” to promote its production as a grain crop. In this view, five quinoa genotypes were evaluated for their yield, agronomic performance and adaptability at three locations across different agro-ecological regions of Oman.
Methods:
Five quinoa genotypes Amarilla Marangani, Amarilla Sacaca, Blanca de junin, Kancolla and Salcedo INIA, received from the Oman FAO office in 2016, were evaluated for three consecutive years from 2016/2017 to 2018/2019 during the winter season (October to March) at national agriculture research stations located at Rumais in South Batinah governorate, AlKamil in South Sharqia governorate and Sohar in North Batinah governorate. The experiments were conducted on the sites containing sandy loam soil under Randomized Complete Block Design (RCBD) involving these five genotypes with four replications under a drip-irrigation system with varying levels of irrigation water salinity. The irrigation and fertilizers were applied as per national recommendations. The characters viz. chlorophyll content, plant height (cm), number of branches, inflorescence length (cm), days to maturity and grain yield (ton/ha) were recorded at appropriate times of growth of crops at all locations. Grain samples were subjected to proximate analysis. The data on yield and yield contributing characters were subjected to multi-factor analysis of variance (ANOVA) using GenStat Statistical Package v12.
Results:
The results indicated that among the effects of main factors viz. genotypes, locations and years, all the effects were highly significant (p<0.01) in respect of plant height and grain yield, whereas for a number of branches, all the main effects except genotypes were highly significant (p<0.01). In respect of chlorophyll content (SPAD value), effects of genotype and years were found significant (p<0.05) and whereas for inflorescence length, effects of locations and years were highly significant (p<0.05). Genotype Amarllia Sacaca had the highest plant height (135 cm), followed by genotype Salcedo INIA (117 cm) during the winter season of 2016/2017. The highest grain yield of 5.40 t ha-1) obtained was harvested at Agriculture Research Station, Rumais where Amarllia Sacaca produced the highest (8.86 t ha-1). The protein content was highest (17.49%) in the genotype Amarllia Maranagani. Irrespective of genotypes, locations and years, the quinoa crop had acceptable performance in terms of 107.47 cm plant height, 18 number of branches, 44.47 SPDA value (chlorophyll) and 31.96 cm inflorescence length with an average yield of 3.83 t ha-1.
Conclusion:
Quinoa has been found to be highly adaptable to Northern agro-ecological regions (South and North Batinah Governorates) of Oman, and genotypes evaluated can be successfully introduced for general cultivation in Northern Oman.
1. INTRODUCTION
The quinoa (Chenopodium quinoa L.), once neglected or underutilized in the past, has now attained a status of quality food in the world only recently owing to its balanced mineral contents and high protein contents with quality amino acids profile, and very high antioxidants in its grains [1-4] and rapid expansion of its cultivation from the Andean region in South America where it was domesticated to 8 countries in 1980 to 95 countries in 2015 [5, 6]. This is due to its versatility in adaptation to all ranges of agro-ecological extremes (soils, rainfall, temperature, and altitude) [7] and tolerance to frost up to -8 oC for four hours [8], drought/moisture stress up to 200-220 mm for a cropping season [9] and salinity levels from 15 to 75 dSm-1 [10], which confer high levels of genetic diversity in its varieties/ ecotypes/ accessions [11, 12]. Globally, quinoa has been distinguished as one of the strategic crops for food security and nutrition because of its resilience and high nutritional quality of its grains [13-15].
Quinoa is ranked high for its nutritive value as it contains more protein than other plant-foods [7]. It is chiefly cultivated in the Andean countries, where it is famous as ‘the golden grain of the Andes’ [7, 16-18]. Quinoa is light, tasty, easy to digest, and often described as nutty with a delicate taste. Its texture adds flavor to almost any recipe. In addition, it is also recognized for its nutritional and dietary properties, genetic multiplicity, adaptableness to diverse agro-environmental situations, as well as the socio-economic and cultural benefits on the indigenous environment [1, 19, 20].
Quinoa is adapted to cold environment and soil salinity; however, some current researches have revealed that it can be grown in warmer latitudes (Mediterranean region) where combinations of soil salinity and high temperature can prevail. Its ability to adjust the plant canopy and hence photosynthesis optimization makes it appropriate for cultivation in counties with adverse environmental confines, for example, in the Middle East [21]. Quinoa production worldwide has been increased from 80,069 metric tons in 2010 to 161 415 metric tons in 2019 [22]. This crop has shown tremendous potential to cope with certain global challenges viz., climate change, desalinization, phytoremediation and food security [18, 23, 24]. In the marginal environments of the Middle East and North Africa (MENA) and other regions of Central Asia, quinoa offers an excellent replacement to ensure food and nutrition security to the growing population [25].
Since the declaration of the United Nations for 2013 as the “Year of Quinoa” in recognition of its significance in food security, there aroused global thrust to increase its production among several countries by way of initiating field evaluation trials for expansion of its area [1, 2, 18, 26, 27]. On similar lines, the trials were initiated on evaluating the performance of introduced varieties of quinoa in 2016 in the Sultanate of Oman, an arid country in the Arabian Peninsula, because of its potential of expansion of cultivation in all its agriculture areas facing challenges of water stress and salinity [28]. The present investigations were to evaluate diverse quinoa genotypes for plant growth and grain yield performance in different agro-ecological locations of Oman to introduce quinoa in the present production systems of Oman.
2. MATERIALS AND METHODS
2.1. Experimental Material
Five quinoa genotypes Amarilla Marangani, Amarilla Sacaca, Blanca de junin, Kancolla and Salcedo INIA, were received from the Oman FAO office in 2016 for evaluation of their productivity in Oman. These genotypes reported to be originated in the high altitudes (2000-4000 m) of the Andean valley are characterized by a long growth period, high Saponin content and colored seed [29].
2.2. Details of Conducting Experiments
These genotypes were evaluated on three experimental sites located in different agro-ecological regions of Oman viz. Agriculture Research Station, Rumais in South Batinah (23°40'57.00”N, 58° 0'37.08”E), Agriculture Research Station, Alkamil in Sharqia (22°14'18.31”N, 59°10'50.17”E) and Agriculture Research Station, Wadi Hibi, Sohar, in North Batinah (24°28'15.40”N, 56°35'4.47”E) (Fig. 1).
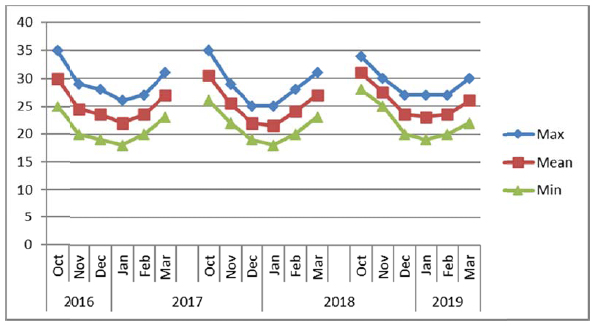
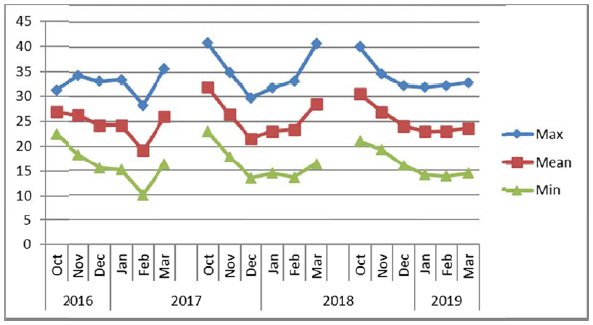
The experiments were conducted consecutively for three years (2016/2017, 2017/2018 and 2018/2019) at layouts on sites composed of sandy loam soils during winter seasons from November to March. The electrical conductivity (EC) and pH of soil and water were recorded for each experimental site (Table 1) before the start of the experiments. The soil at Alkamil research station had the highest pH (8.1) as compared to the soil of Rumais (7.62) and Sohar (7.90) research sites. However, the EC of Sohar soil was the highest (2.5 ds m-1). The irrigation water EC at Sohar ranged between 1.5 to 2.0 ds m-1, whereas it was between 0.93 and 1.00 ds m-1 at Alkamil and between 0.32 and 1.21 ds m-1 at Rumais. Water pH ranged from 6.71 to 7.20 at Rumais and from 7.5 to 8.0 at Alkamil and Sohar (Table 2). The maximum, minimum and mean temperature conditions of the experiments at three locations viz. Rumais, Alkamil and Sohar during three cropping seasons from October to November are presented in Figs. (2a-2c), respectively.
The experiments were laid in Randomized Complete Block Design (RCBD) with four replications at each location. Seeds of each genotype were planted in six rows of a plot (3 × 4 m) within 2.5 cm soil depth and a planting distance of 35 cm was maintained along with 50 cm distance between the rows. The seed rate was 5 kg ha-1 (53,000 seed per hectare given that the weight of seed is about 0.3 g). The fertilizers were applied at the rate of 170, 100 and 10 kg N, P and K ha-1 using urea, triple superphosphate and potassium sulphate as sources, respectively. Half of nitrogen and whole of potassium and phosphorus were applied as basal doses at planting, while the remaining nitrogen was applied after 30 days of emergence. The plants were irrigated for 15 minutes every day in the evening hours until germination (two weeks after planting). The irrigation time was increased by 5 minutes every 15 days until physiological maturity through a well-maintained drip irrigation system. All the crop husbandry practices were followed according to national guidelines to raise a successful crop [30].
The observations on leaf SPAD chlorophyll index were measured one month before harvest (during the flowering stage) in two locations only, whereas days to maturity were recorded whenever more than 95% maturity was attained by each genotype. Leaf chlorophyll was recorded in the field using Chlorophyll Meter SPAD-502 on three sample sites of a leaf prior to the top leaf, which gives a value called SPAD value that corresponds to the amount of chlorophyll present in the leaf sample according to Ling et al. [31]. The remaining characters viz. plant height (cm), number of branches, inflorescence length (cm), and grain yield (ton/ha) were recorded at harvest (average of six plants) at all locations. The plants were harvested at grain maturity (after 30-35 days of flowering) by inspecting grains of five randomly sampled panicles in each plot, and panicles were threshed manually during March. In respect of proximate analysis, grain samples from each genotype were analyzed for moisture, protein, fat and fiber contents according to ISO 712:2014, ISO 1871:2015, ISO 11085:2015 and ISO 5498:2014, respectively [32] by outsourcing with Oman Folour Mill.

| Soil & Water Properties | Rumais Research Station | Alkamil Research Station | Sohar Research Station | |||
|---|---|---|---|---|---|---|
| Soil | Water | Soil | Water | Soil | Water | |
| pH | 7.62 | 6.71 to 7.20 | 8.1 | 7.5 to 8.0 | 7.9 | 7.5 to 8.0 |
| EC (ds m-1) | 1.09 | 0.32 to 1.21 | 2.2 | 0.93 to 1.0 | 2.5 | 1.5 to 2.0 |
| Genotypes | Rumais Research Station | Mean of Years at Rumais | Alkamil Research Station | Mean of Years at Alkamil | Sohar Research Station | Mean of Years at Sohar | Mean of Years | Grand Mean of Years | Means of Locations | Grand Mean of Locations | Grand Mean | ||||||||||
|---|---|---|---|---|---|---|---|---|---|---|---|---|---|---|---|---|---|---|---|---|---|
| 2016/17 | 2017/18 | 2018/19 | 2016/17 | 2017/18 | 2018/19 | 2016/17 | 2017/18 | 2018/19 | 2016/17 | 2017/18 | 2018/19 | Rumais | Alkamil | Sohar | |||||||
| Amarllia Maranagani | 66.00 | 52.50 | 84.00 | 67.50 | 129.75 | 113.75 | 116.50 | 120.00 | 110.50 | 120.25 | 107.25 | 112.67 | 102.08 | 95.50 | 102.58 | 100.06 | 67.50 | 120.00 | 112.67 | 100.06 | 100.06c |
| Amarllia Sacaca | 111.00 | 115.75 | 125.50 | 117.42 | 108.00 | 106.25 | 108.25 | 107.50 | 118.25 | 182.75 | 105.25 | 135.42 | 112.42 | 134.92 | 113.00 | 120.11 | 117.42 | 107.50 | 135.42 | 120.11 | 120.11a |
| Blanca de junin | 68.75 | 72.25 | 127.25 | 89.42 | 117.75 | 112.00 | 106.25 | 112.00 | 128.25 | 147.00 | 94.25 | 123.17 | 104.92 | 110.42 | 109.25 | 108.19 | 89.42 | 112.00 | 123.17 | 108.19 | 108.19b |
| Kancolla | 63.75 | 75.75 | 98.00 | 79.17 | 106.00 | 104.00 | 101.50 | 103.83 | 117.00 | 130.50 | 92.75 | 113.42 | 95.58 | 103.42 | 97.42 | 98.81 | 79.17 | 103.83 | 113.42 | 98.81 | 98.81c |
| Salcedo INIA | 108.00 | 83.75 | 91.75 | 94.50 | 109.25 | 102.50 | 101.50 | 104.42 | 134.75 | 160.00 | 100.25 | 131.67 | 117.33 | 115.42 | 97.83 | 110.19 | 94.50 | 104.42 | 131.67 | 110.19 | 110.19b |
| Mean of Genotypes | 83.50 | 80.00 | 105.30 | 89.60 | 114.15 | 107.70 | 106.80 | 109.55 | 121.75 | 148.10 | 99.95 | 123.27 | 106.47 | 111.93 | 104.02 | 107.47 | 89.60 | 109.55 | 123.27 | 107.47 | |
| Sig (P value) | LSD at p<0.05 | ||||||||||||||||||||
| Genotype | <0.001 | 6.91 | |||||||||||||||||||
| Location | <0.001 | 5.35 | |||||||||||||||||||
| Year | 0.013 | 5.35 | |||||||||||||||||||
| Genotype × Location | <0.001 | 11.97 | |||||||||||||||||||
| Genotype × Year | 0.002 | 11.97 | |||||||||||||||||||
| Location × Year | <0.001 | 9.27 | |||||||||||||||||||
| Genotype × Location × Year | 0.003 | 20.74 | |||||||||||||||||||
| Coefficient of Variation (%) | 3.4 | ||||||||||||||||||||

3. RESULTS AND DISCUSSION
The results obtained from the analyzed data of the present investigations on the characters of performance of five introduced quinoa genotypes/ varieties are presented and discussed, hereunder, in light of contemporary results of the researches around the world. The results indicated that among the effects of main factors viz. genotypes, locations and years, all the effects were highly significant (p<0.01) in respect of plant height and grain yield, whereas for a number of branches, all the main effects except genotypes were highly significant (p<0.01). In respect of chlorophyll content (SPAD value), effects of genotype and years were found significant (p<0.05) and whereas for inflorescence length, effects of locations and years were highly significant (p<0.05). However, among the interaction effects, all the effects were significant (p<0.05) to highly significant (p<0.01) for plant height and a number of branches. In the case of grain yield, all the interaction effects except genotypes x locations, were highly significant (p<0.01). However, in respect of chlorophyll content and inflorescence length, only the effect of location and year was highly significant (p<0.01). The significant effect of GxE interaction for yield was also reported earlier [7, 35, 36].
3.1. Plant Height (cm)
Uniform plant height plays a significant role in determining the quinoa suitability for mechanical harvesting [37]. Among the locations, Sohar Research Station (SRS) had the highest mean plant height (123.27 cm) in comparison with that at Rumais, which had the shortest quinoa plants (89.6 cm), whereas among the genotypes, Amarllia Sacaca genotype was the tallest (120.11 cm) followed by Salcedo INIA (110.19 cm), and Blanca de junin (108.19 cm) (Table 2). Winter season of 2017/2018 witnessed the highest mean plant height (148.10 cm) at Sohar Research Station and lowest at Rumais (80.00 cm) (Table 3). The shorter plant height at Rumais can be attributed to lower prevailing mean temperatures ranging from 20oC-29oC as compared to 22oC-31oC at Alkamil and 19oC-32oC at Sohar during the season (Fig. 2a). This is attributed to slow enzymatic activity that causes slow and stunted plant growth [7, 37]. (Adams et al., 2001; Maliro et al., 2017). During the winter season of 2017/2018, Amarllia Sacaca was the highest in plant height (134.92 cm), followed by Salcedo INIA (117.33 cm) during the winter season of 2016/2017, whereas the lowest was obtained by Amarllia Maranagani (95.50 cm) during the winter season of 2017/2018 which did not significantly differ from Kancolla (95.58 cm) during the winter season of 2016/2017. (Table 3). The overall response of crop irrespective of varieties to the temperature climate in respect of plant height indicated quinoa attained the mean height of 107.49 cm with a range from 89.60 cm (Rumais) to 123.27 cm (Sohar). These observations are in line with the results of other researches across the contemporary world [39-42].
3.2. Number of Branches Per Plant
The results revealed highly significant differences among locations, year and their interaction (P<0.001), whereas there were no significant (p=0.438) differences found between genotypes in respect to a number of branches, in which all genotypes produced an average of 18 branches per plant except Amarllia Sacaca which produced highest of 20 branches (Table 4). Winter season of 2017/2018 was the highest in an average number of branches (22 branches per plant). However, the highest number of branches were produced by the plants at Rumais (26 branches per plant), which was significantly different from that produced in Sohar (16 branches per plant) and Alkamil (13 branches per plant). Irrespective of genotypes, years and locations, quinoa showed its ability to produce on an average of 18 number of branches. These observations are consistent with the results of earlier workers [41, 43-45].
| Genotypes | Rumais Research Station | Mean of Years at Rumais | Alkamil Research Station | Mean of Years at Alkamil | Sohar Research Station | Mean of Years at Sohar | Mean of Years | Grand Mean of Years | Means of Locations | Grand Mean of Locations | Mean of | ||||||||||
|---|---|---|---|---|---|---|---|---|---|---|---|---|---|---|---|---|---|---|---|---|---|
| 2016/17 | 2017/18 | 2018/19 | 2016/17 | 2017/18 | 2018/19 | 2016/17 | 2017/18 | 2018/19 | 2016/17 | 2017/18 | 2018/19 | Rumais | Alkamil | Sohar | genotypes | ||||||
| Amarllia Maranagani | 21 | 26 | 20 | 22 | 17 | 16 | 16 | 16 | 11 | 19 | 18 | 16 | 16 | 20 | 18 | 18 | 22 | 16 | 16 | 18 | 18 |
| Amarllia Sacaca | 19 | 38 | 34 | 30 | 12 | 12 | 12 | 12 | 11 | 24 | 15 | 17 | 14 | 25 | 20 | 20 | 30 | 12 | 17 | 20 | 20 |
| Blanca de junin | 13 | 30 | 34 | 26 | 13 | 13 | 12 | 13 | 12 | 20 | 19 | 17 | 13 | 21 | 22 | 18 | 26 | 13 | 17 | 18 | 18 |
| Kancolla | 14 | 34 | 22 | 23 | 16 | 14 | 14 | 15 | 12 | 21 | 17 | 17 | 14 | 23 | 18 | 18 | 23 | 15 | 17 | 18 | 18 |
| Salcedo INIA | 22 | 37 | 24 | 28 | 10 | 10 | 10 | 10 | 12 | 23 | 13 | 16 | 15 | 23 | 16 | 18 | 28 | 10 | 16 | 18 | 18 |
| Mean of year × location | 18 | 33 | 27 | 26 | 14 | 13 | 13 | 13 | 12 | 21 | 16 | 16 | 14 | 22 | 19 | 18 | 26 | 13 | 16 | 18 | |
| Sig (P value) | LSD at p<0.05 | ||||||||||||||||||||
| Genotype | 0.438 | - | |||||||||||||||||||
| Location | <0.001 | 1.68 | |||||||||||||||||||
| Year | <0.001 | 1.68 | |||||||||||||||||||
| Genotype × Location | <0.001 | 3.75 | |||||||||||||||||||
| Genotype × Year | 0.011 | 3.75 | |||||||||||||||||||
| Location × Year | <0.001 | 2.91 | |||||||||||||||||||
| Genotype × Location × Year | 0.045 | 6.5 | |||||||||||||||||||
| Coefficient of Variation (%) | 5.5 | ||||||||||||||||||||
Table 4.
| Genotypes | Rumais Research Station | Mean of years at Rumais | Sohar Research Station | Mean of years at Alkamil | Mean of years | Grand Mean of years | Means of locations | Grand Mean of locations | Grand mean | |||||||
|---|---|---|---|---|---|---|---|---|---|---|---|---|---|---|---|---|
| 2016/17 | 2017/18 | 2018/19 | 2016/17 | 2017/18 | 2018/19 | 2016/17 | 2017/18 | 2018/19 | Rumais | Sohar | ||||||
| Amarllia Maranagani | 47 | 47 | 43 | 45.67 | 52 | 42 | 37 | 43.67 | 49.50 | 44.50 | 40.00 | 44.67 | 45.67 | 43.67 | 44.67 | 4.04a |
| Amarllia Sacaca | 45 | 51 | 43 | 46.33 | 56 | 45 | 39 | 46.67 | 50.50 | 48.00 | 41.00 | 46.50 | 46.33 | 46.67 | 46.50 | 3.95a |
| Blanca de junin | 38 | 46 | 43 | 42.33 | 52 | 52 | 46 | 50.00 | 45.00 | 49.00 | 44.50 | 46.17 | 42.33 | 50.00 | 46.17 | 3.82a |
| Kancolla | 40 | 46 | 40 | 42.00 | 52 | 43 | 35 | 43.33 | 46.00 | 44.50 | 37.50 | 42.67 | 42.00 | 43.33 | 42.67 | 3.34b |
| Salcedo INIA | 40 | 51 | 33 | 41.33 | 49 | 41 | 40 | 43.33 | 44.50 | 46.00 | 36.50 | 42.33 | 41.33 | 43.33 | 42.33 | 3.99a |
| Mean of Genotypes | 42.00 | 48.20 | 40.40 | 43.53 | 52.20 | 44.60 | 39.40 | 45.40 | 47.10 | 46.40 | 39.90 | 44.47 | 43.53 | 45.40 | 44.47 | |
| Sig (P value) | LSD (p<0.05) | |||||||||||||||
| Genotype | 0.026 | 3.3 | ||||||||||||||
| Location | 0.085 | - | ||||||||||||||
| Year | <0.001 | 2.5 | ||||||||||||||
| Genotype × Location | 0.076 | - | ||||||||||||||
| Genotype × Year | 0.296 | - | ||||||||||||||
| Location × Year | <0.001 | 3.6 | ||||||||||||||
| Genotype × Location × Year | 0.309 | - | ||||||||||||||
| Coefficient of Variation (%) | 12.9 | |||||||||||||||
3.3. Chlorophyll Content (SPAD)
In 2014, Riccardi and coworkers demonstrated the use of non-destructive evaluation of chlorophyll contents in the leaves of quinoa leaves using a chlorophyll meter that provides SPAD values which are directly proposal to chlorophyll contents [46]. The analysis of variance showed significant differences in genotypes (p<.05), and highly significant (P<0.001) in the year and the interaction of year×location in respect of chlorophyll content, whereas there was the location (p=0.085) and its’ interaction with genotype (p=0.076) was not significant (Table 4). Amarllia Sacaca and Blanca de junin genotypes, which had the highest Chlorophyll content (47 SPAD), were not significantly different, whereas Kancolla and Salcedo INIA contained the lowest Chlorophyll (43 SPAD). Quinoa chlorophyll at Sohar for 2016/2017 winter season was the highest (52 SPAD) followed by Rumais during 2017/2018 (48 SPAD), whereas the lowest was recorded at Sohar and Rumais during 2018/2019 (39 and 40 SPAD, respectively. The grand mean of SPAD over varieties, location and year, was found to be 44.47. The SPAD values reported in the present studies are in line with previous reports [8, 47, 48].
3.4. Inflorescence Length (cm)
The statistical analysis did not show any significant (P>0.05) effect of genotypes and its’ interaction with year and location in respect of inflorescence length. The location was significant (p=0.001) in respect to inflorescence length (cm). The inflorescence length obtained in Rumais (41.87 cm) was the highest as compared to that in Sohar (32.38 cm), followed by that in Alkamil (21.63 cm), as displayed in Table 5. The interaction between location and year was highly significant (p<0.001). Inflorescence length during the winter season of 2018/2019 at Rumais was the highest (63.55 cm), followed by that obtained during 2017/2018 at Sohar (47.45 cm), whereas the lowest (14.85 cm) was obtained during the winter season of 2018/2019 at Sohar (Table 5). The grand mean of inflorescence length over gentypes, locations and years was found to be 31.96 cm. These results are similar to the reports of earlier researches that indicated inflorescence length in the range of 13.86 cm to 35.32 cm [7, 45], made by Maliro et al. 2017 (29.33 cm to 35.32 cm) and Biswas and Tanni, 2017 (13.86 cm to 29.62 cm) in their studies in quinoa.
3.5. Days to maturity
The results on days to maturity of five quinoa genotypes are presented in Fig. (3). Significant differences (P<0.05) were found among genotypes in respect to days to maturity. Amerllia Maranagani genotypes showed the shortest period to maturity (84 days), which is significantly different from other genotypes (Fig. 3). The highest days to maturity were noted in Salcedo INIA (149 days), followed by Kancolla (124 days), Amerllia Sacaca (116 days) and Blanca de junin (103 days). The grand mean of days to maturity over the years for a location (Rumais) was found to be 115.2. These are in line with the findings of Spehar and Santos. 2005 (80-126 days) and Tan and Temel, 2018 (119- 141 days) among the genotypes studied. Belmonte et al. (2018) observed days to flowering ranging from 53.8 to 57.7 among the varieties investigated. It is reported that the physiological maturity of quinoa can be achieved within 70-90 days after flowering [49, 50].
| Genotypes | Rumais Research Station | Mean of years at Rumais | Alkamil Research Station | Mean of years at Alkamil | Sohar Research Station | Mean of years at Sohar | Mean of years | Grand Mean of years | Means of locations | Grand Mean of locations | Grand mean | ||||||||||
|---|---|---|---|---|---|---|---|---|---|---|---|---|---|---|---|---|---|---|---|---|---|
| 2016/17 | 2017/18 | 2018/19 | 2016/17 | 2017/18 | 2018/19 | 2016/17 | 2017/18 | 2018/19 | 2016/17 | 2017/18 | 2018/19 | Rumais | Alkamil | Sohar | |||||||
| Amarllia Maranagani | 19.25 | 25.50 | 45.75 | 30.17 | 27.25 | 26.00 | 23.50 | 25.58 | 33.00 | 38.00 | 13.25 | 28.08 | 26.50 | 29.83 | 27.50 | 27.94 | 30.17 | 25.58 | 28.08 | 27.94 | 27.94 |
| Amarllia Sacaca | 31.75 | 37.75 | 49.25 | 39.58 | 21.00 | 21.25 | 19.25 | 20.50 | 33.75 | 56.25 | 14.00 | 34.67 | 28.83 | 38.42 | 27.50 | 31.58 | 39.58 | 20.50 | 34.67 | 31.58 | 31.58 |
| Blanca de junin | 35.00 | 29.25 | 47.00 | 37.08 | 25.50 | 24.00 | 22.50 | 24.00 | 34.00 | 48.75 | 17.25 | 33.33 | 31.50 | 34.00 | 28.92 | 31.47 | 37.08 | 24.00 | 33.33 | 31.47 | 31.47 |
| Kancolla | 44.00 | 31.50 | 135.75 | 70.42 | 21.50 | 21.50 | 19.25 | 20.75 | 36.50 | 35.25 | 14.50 | 28.75 | 34.00 | 29.42 | 56.50 | 39.97 | 70.42 | 20.75 | 28.75 | 39.97 | 39.97 |
| Salcedo INIA | 23.25 | 33.00 | 40.00 | 32.08 | 18.00 | 17.25 | 16.75 | 17.33 | 37.00 | 59.00 | 15.25 | 37.08 | 26.08 | 36.42 | 24.00 | 28.83 | 32.08 | 17.33 | 37.08 | 28.83 | 28.83 |
| Mean of Genotypes | 30.65 | 31.40 | 63.55 | 41.87 | 22.65 | 22.00 | 20.25 | 21.63 | 34.85 | 47.45 | 14.85 | 32.38 | 29.38 | 33.62 | 32.88 | 31.96 | 41.87 | 21.63 | 32.38 | 31.96 | |
| Sig (P value) | LSD at p<0.05 | ||||||||||||||||||||
| Genotype | 0.426 | - | |||||||||||||||||||
| Location | 0.001 | 10.46 | |||||||||||||||||||
| Year | 0.694 | - | |||||||||||||||||||
| Genotype × Location | 0.125 | - | |||||||||||||||||||
| Genotype × Year | 0.456 | - | |||||||||||||||||||
| Location × Year | <0.001 | 18.11 | |||||||||||||||||||
| Genotype × Location × Year | 0.757 | - | |||||||||||||||||||
| Coefficient of Variation (%) | 14.5 | ||||||||||||||||||||

3.6. Grain Yield (t ha-1)
Genotype × Location × Year interaction was highly significant (p<0.001) for grain yield (t ha-1). The genotypes Amarllia Maranagani, Salcedo INIA and Amarllia Sacaca produced higher grain yields of 4.04, 3.99 and 3.95 t ha-1, respectively (Table 6). The grain yields obtained from these genotypes were within the range of mean grain yield (0.46 kg m-2 equivalent to 4.6 t ha-1) of five accessions evaluated at the International Center for Biosaline Agriculture (ICBA) during 2012 [38]. (Rao and Shahid, 2012). Locations had a highly significant effect (p<0.001) in which the highest grain yield was obtained at Rumais (5.40 t ha-1) followed by Sohar (4.08 t ha-1). Alkamil Research Station location was the lowest, with an average grain yield of 2.01 t ha-1 (Table 6).
Winter season of 2017/2018 was the highest in grain yield (7.34 t ha-1) at Rumais, which is significant from a season of 2018/2019 (5.95 t ha-1) at the same location, whereas the lowest grain yield (1.62 t ha-1) was found during winter 2018/2019 at Alkamil (Table 6). Among 25 genotypes tested in Brazilian Savannah in 2005, grain yield was recorded between 1.00 and 2.5 t ha-1 [51]. Relatively, the grain yields were stable during the three seasons at Sohar (p>0.05), while they were found significantly different (p<0.05) in the other two locations, with higher preferential of Rumais and Sohar in comparison to Alkamil Station. In general, the grand mean yield of quinoa irrespective of genotypes, locations and years was found to be to the extent of 3.83 t ha-1. This mean yield was similar to yield levels obtained in Egypt (3.87 ha-1) and Lebanon (4.5 t/ha) and other countries of the world [25, 52].
3.7. Proximate Analysis
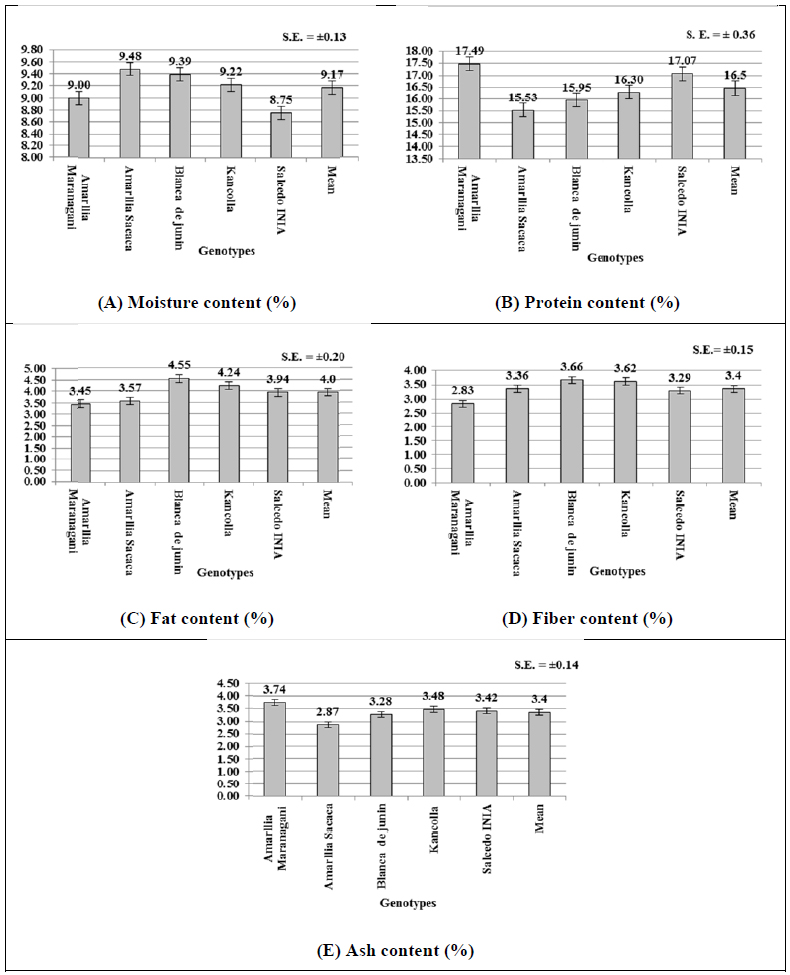
The proximate analysis of quinoa genotypes are illustrated in Figs. (4-E). The moisture contents of the genotypes varied significantly between 8.75% (Salcedo INIA) to 9.48% (Amarilla Sacaca) with mean moisture of 9.17% (Fig. (4A), which are similar to earlier findings [53]. This clearly indicates that these genotypes have about 88% and higher dry matter content indicating their higher storage ability in marketing [4, 54]. In respect of protein content, only two genotypes Amarilla Marangani (17.49%) and Salcedo INIA (17.07%), had significantly higher protein content than the remaining three genotypes (15.53% to 16.3%) (Fig. 4B). The mean protein content of the genotypes was found to be 16.5%. These figures are in line with the protein % reported by earlier workers in the range from 14 to 20% [53-56]. In respect of fat content, the present studies indicated an average fat content of 4.0% in quinoa genotypes with a range from 3.57 to 4.55% (Fig. 4C). These are within the range of fat content (2% to 10%) reported earlier by Valencia-Chamorro in 2003 [49]. However, recent research reports indicated a higher range of fat contents from 5.3% to 7.8% [56-59]. In respect of fiber contents, the genotypes varied from 2.83 to 3.66%, with an average of 3.4% (Fig. 4D). These figures are in line with the fiber contents 4.2% reported in FAO-INFOODS Data base [59]. In the present study, the highest ash contents were found in a range of 2.87% (Amarilla Sacaca) to 3.74% (Amarilla Marangani) (Fig. 4E) with mean ash content of 3.4%. These results in the range of ash contents from 2.3% reported earlier [57, 58]. The ash content determines the amount and type of minerals in food; and has its own significance as the amount of minerals can determine the physiochemical properties of foods like quinoa [53, 60].
| Genotypes | Rumais Research Station | Mean of years at Rumais | Alkamil Research Station | Mean of years at Alkamil | Sohar Research Station | Mean of years at Sohar | Mean of years | Grand Mean of years | Means of locations | Grand Mean of locations | Grand mean | ||||||||||
|---|---|---|---|---|---|---|---|---|---|---|---|---|---|---|---|---|---|---|---|---|---|
| 2016/17 | 2017/18 | 2018/19 | 2016/17 | 2017/18 | 2018/19 | 2016/17 | 2017/18 | 2018/19 | 2016/17 | 2017/18 | 2018/19 | Rumais | Alkamil | Sohar | |||||||
| Amarllia Maranagani | 5.47 | 6.08 | 4.93 | 5.49 | 3 | 2.06 | 1.88 | 2.31 | 4.01 | 4.63 | 4.32 | 4.32 | 4.16 | 4.26 | 3.71 | 4.04 | 5.49 | 2.31 | 4.32 | 4.04 | 4.04a |
| Amarllia Sacaca | 2.81 | 8.87 | 5.78 | 5.82 | 2.55 | 1.73 | 1.65 | 1.98 | 4.11 | 4 | 4.06 | 4.06 | 3.16 | 4.87 | 3.83 | 3.95 | 5.82 | 1.98 | 4.06 | 3.95 | 3.95a |
| Blanca de junin | 2.43 | 7.28 | 6.55 | 5.42 | 3.2 | 1.59 | 1.55 | 2.11 | 3.81 | 4.03 | 3.92 | 3.92 | 3.15 | 4.30 | 4.01 | 3.82 | 5.42 | 2.11 | 3.92 | 3.82 | 3.82a |
| Kancolla | 2.11 | 6.37 | 4.95 | 4.48 | 2.7 | 1.55 | 1.52 | 1.92 | 4.14 | 3.13 | 3.63 | 3.63 | 2.98 | 3.68 | 3.37 | 3.34 | 4.48 | 1.92 | 3.63 | 3.34 | 3.34b |
| Salcedo INIA | 1.81 | 8.08 | 7.53 | 5.81 | 2.18 | 1.43 | 1.52 | 1.71 | 4.17 | 4.73 | 4.45 | 4.45 | 2.72 | 4.75 | 4.50 | 3.99 | 5.81 | 1.71 | 4.45 | 3.99 | 3.99a |
| Mean of Genotypes | 2.93 | 7.34 | 5.95 | 5.40 | 2.73 | 1.67 | 1.62 | 2.01 | 4.05 | 4.10 | 4.08 | 4.08 | 3.23 | 4.37 | 3.88 | 3.83 | 5.40 | 2.01 | 4.08 | 3.83 | |
| Sig (P value) | LSD (p<0.05) | ||||||||||||||||||||
| Genotype | 0.003 | 0.38 | |||||||||||||||||||
| Location | <0.001 | 0.30 | |||||||||||||||||||
| Year | <0.001 | 0.30 | |||||||||||||||||||
| Genotype × Location | 0.061 | - | |||||||||||||||||||
| Genotype × Year | <0.001 | 0.66 | |||||||||||||||||||
| Location × Year | <0.001 | 0.51 | |||||||||||||||||||
| Genotype × Location × Year | <0.001 | 1.15 | |||||||||||||||||||
| Coefficient of Variation (%) | 5.9 | ||||||||||||||||||||
CONCLUSION
In recent years, quinoa has gained increasing interest on a global scale. The results of the present study clearly indicated that quinoa genotypes had outstanding performance reflected on mean grain productivity over seasons at two of three diverse locations located in the coastal regions, namely Rumais (5.4 t/ha) and Sohar (4.08 t/ha) with their optimum nutritional quality features in terms of protein (15.53 – 17.49%), fat (3.45 – 4.55%) and fiber (2.83 – 3.61%) contents. These results clearly revealed that quinoa genotypes tested could be conveniently introduced for general cultivation under the cropping systems existing not only in northern governorates of Oman, which are suffering from high temperature and higher soil and water salinity but also in arid areas of the Arabian Peninsula because of their adaptability to adverse agro-ecological conditions.
ETHICS APPROVAL AND CONSENT TO PARTICIPATE
Not applicable.
HUMAN AND ANIMAL RIGHTS
Not applicable.
CONSENT FOR PUBLICATION
Not applicable.
AVAILABILITY OF DATA AND MATERIALS
All the experimental data are available with the corresponding author and shall be provided on request.
CONFLICT OF INTEREST
The authors declare no conflict of interest, financial or otherwise.
FUNDING
The authors gratefully acknowledge the Directorate General of Agriculture & Livestock Research, Ministry of Agriculture, Fisheries and Water Resources of Oman for the financial support of the research
ACKNOWLEDGEMENTS
Authors are grateful to the Director General of Agriculture and Livestock Research and Director of Plant Production Research Center, for providing logistic support at the research centers. Authors also extend their acknowledgment and appreciation to the staff of Atyab FoodTech laboratory at Atyab FoodTech Trading and Services Company L.L.C for their cooperation and technical support in proximate analysis.

