All published articles of this journal are available on ScienceDirect.

Potential for Vegetable Production Towards Food Security in Arabian Peninsula: A Case Study of Oman
Authors Info & Affiliations
Abstract
Introduction:
In Oman, the weather is not conducive to year-round cultivation of vegetables. However, these are dual-purpose commodities because they can be grown to achieve food security goals as well as serve as cash crops that generate employment and income. Increasing vegetable production in Oman has the potential to contribute to the government’s economic diversification efforts. Technical efficiency analysis for selected crops indicated the ability to improve crops’ production with the present state of technology in-line with regional food security objectives.
Materials and Methods:
Relevant documents about cultivating vegetables in terms of area, production, price structure, and other factors were extensively researched, analyzed, and presented in tables and figures to show their present and future trends. Researchers surveyed about 118 randomly selected farms across Oman. They also evaluated Technical Efficiency (TE) using a Trans-Logarithmic function (TL) and Cobb Douglas (CD) function with SHAZAM comprehensive economics and statistics package to achieve meaningful results.
Results:
The results include retrospective analysis of area and production of different vegetables cultivated in Oman and their import and export, their price, and its potential increase in vegetable production in Oman for economic diversification in domestic consumption and export markets. They also identified trends in organic vegetable cultivation, and sales showed the potential to increase production levels and assist government efforts to increase agriculture’s contribution to the gross domestic product of Oman. Technical efficiency for tomato in selected samples indicated the ability to improve production beyond 20% with the present state of technology.
Conclusion:
Analysis of data on ordinary vegetable cultivation established that the outlook for global vegetable supply and demand is attractive. The global demand for vegetables, is increasing and will continue to do so. Moreover, growth is especially strong in demand for organic vegetables in wealthier countries such as Switzerland, Sweden, and the United Arab Emirates. Technical efficiency analysis indicated a potential increase in the production of vegetables with the present state of technology.
1. INTRODUCTION
Oman is one of the Arab countries in the southeastern portion of the Arabian Peninsula. The country is primarily dep-
endent on oil and gas to sustain its economy [1, 2]. The oil and gas industry had fueled Oman's remarkable rise in the standard of living since 1964 when oil was first discovered in Oman to date when 150 Omani oil fields are producing more than 900,000 barrels per day. However, many of them are rather small, complex, and not as productive as those typical of the Middle East, leading to the production costs proportionately higher [2].
Recently, an awareness of modest remaining resources has led the government to introduce programs to diversify the economy.
Oil has been the driving force of the Omani economy since Oman began commercial production in 1967. The oil industry supports Oman’s modern and expansive infrastructure, including electrical utilities, roads, public education, and medical services. Lower oil prices over the past few years have pushed firms to improve efficiencies, forcing many market players to reduce their costs [3, 4].
Amidst decreased and fluctuating national oil resources, reduced oil prices have exposed the risks and hazards of having a sector-dependent economy [3, 4]. Hence, Oman has wisely decided to mitigate its dependency on hydrocarbon exports by diversifying and expanding its non-oil sectors [1].
Oman's economic development policy increasingly emphasizes agricultural and fishery commodities as vital in expanding its non-oil contribution to the gross domestic product. Chief among these commodities are fruit and vegetables [1, 2].
Challenges for this sector include scarce and ecologically sensitive land and water suitable for agriculture. Oman must move ahead carefully in a sustainable fashion to avoid unfortunate, unintended consequences such as those suffered recently by neighboring Saudi Arabia. In 2008, Saudi Arabia found that its already scarce water supplies were depleted by an otherwise successful 30-year programme growing wheat to achieve self-sufficiency in this vital food commodity [5].
Harsh weather and environmental conditions must also be assessed, and appropriate methodologies and technologies should be adopted for maximized production. Some parts of Oman, such as the city of Salalah and surrounding Dhofar region in southern Oman, receive adequate seasonal rainfall for crop production because of monsoon winds from the Indian Ocean [4, 6, 7]. Year-round agricultural cultivation can work in such areas if administered correctly.
However, for most parts of Oman, the weather is not conducive to comfortable year-round open-field agricultural cultivation. Most of the interior region is hot, with daily maximum temperatures easily reaching 40°C (104°F) or more during summer. Water is also an issue. Although the coasts and parts of the southern highlands and deserts have extreme humidity in the summer, the interior is arid, with annual rainfall typically only 72 to 102 mm (2.8 to 4.1 inches). Drought is frequent in the peninsula, often lasting for several years [5, 6].
The sustainable future of agriculture in Oman, therefore, depends very much on adopting land and water-saving technologies such as greenhouses, soilless culture and hydroponics, and soil-based Integrated Production and Protection Management (IPPM) [7-9]. Each of these technologies has unique benefits and typical applications. However, early-maturing vegetables and other agricultural commodities excel in all of them because they can be grown and harvested within a very short period of time. Thus, suitable technologies and crops can easily mitigate the limitations of heat and aridity [10-17].
Furthermore, vegetables are dual-purpose commodities that can help achieve food security goals and serve as cash crops that generate employment and income [1]. Increasing vegetable production in Oman has the potential to help government efforts to diversify its economy and reverse the country’s former dependency on hydrocarbon exports [1, 2].
This paper analyses and presents import and export price trends for vegetables to show that increased vegetable production in Oman has the potential to help economically diversify the exports and domestic consumption of markets. It also presents analytical features of organic vegetable production, indicating the parallel potential of increased organic vegetable production, assisting government efforts to increase agriculture's contribution to Oman's GDP.
This paper has also verified the technical efficiency of commodity farming operations in Oman and assessed whether they are adequate or need to be improved. Specifically, tomato farms have been assessed as a representative sample of agricultural farm efficiency. Their determinants of technical efficiency have been examined, identified, and quantified.
The results of these assessments can provide policymakers with valuable feedback and facts for the successful implementation of Oman's economic diversification strategy.
2. MATERIALS & METHODS
2.1. Oman’s Perspective of Demand and Supply of Vegetables Locally as Well as Globally
Relevant documents about cultivating vegetables concerning area, production, price structure, etc. were extensively researched and analyzed in preparation for this paper. These are presented in text, tables, and figures to show their present and future trends in cultivation in Oman in context with the Arabian Peninsula, the Middle East, and the world [10-17].
2.2. Oman’s Perspective on the Production of Organic and Inorganic Vegetables
This paper differentiates organic and ordinary vegetables and shows the current and potential markets for organic vegetables [18] and their unique opportunity to add to the GDP of Oman.
2.3. Methodology to Estimate Technical Efficiency
This paper also employs an efficiency analysis to assess the efficacy of vegetable farming in Oman. There are numerous ways to measure efficiency frontiers, comprising two groups: parametric and non-parametric. Parametric analysis specifies a production function, a cost function, or a profit function in a given functional form and applies econometrics for studying these economic issues and their data. Many previous examinations of parametric stochastic frontiers applications in agriculture were analysed for this study [19-29]. Many non-parametric analyses applications in agriculture were also analyzed [30-38]. Several empirical applications in agriculture combining both parametric and non-parametric analytical approaches were incorporated as well [30-40].
Technical efficiency studies on tomato production are scarce. Most studies reported in efficiency literature are of non-farm operations. However, studies of applications in the farm and fisheries sector do exist for dairy farms [16, 19], cereal grain farms, date farms, and fisheries [41-44]. Efficiency analysis researchers in the last few decades have identified several key criteria and results for farms. A Sri Lankan study demonstrated that farming experience and skills are essential in explaining efficiency [45]. Others proved that specific factors such as farmer's age, education, experience, and soil fertility positively influence technical efficiency [46, 47]. A study of date farm efficiency in Tunisia [26, 27] found that date farms were 68.3% technically efficient on average with individual efficiency ranging from 11.4% to 94.1% [10, 26]. Two other studies of Tunisian date farms reported 68.3% and 85% average technical efficiency [48-50]. Related studies of farms in the U.S. and Turkey reported similar results in criteria and results [48-56].
For this paper, the parametric approach was determined to be the most appropriate for these agricultural issues. The specific methodology used includes a model for cross-sectional data, as defined in equation (1) and equation (3).
The first equation expresses tomato farm production in terms of input used by the farm, as handled by the farm’s technology and the efficiencies and inefficiencies of the process:
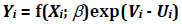 |
(1) |
Here, Yi denotes the production of the i-th tomato farm in the sample (i = 1, 2…, N); Xi is a (1 x k) vector of input quantities used by the i-th tomato farm; β is a (k x 1) vector of parameters to be estimated; and f (Xi;β) is an appropriate parametric form (functional form) for the underlying technology. These are assumed to be independently and identically distributed; that is  random errors, independent of Ui; and Ui are non-negative random variables associated with technical inefficiency in production, which are assumed to be independently distributed with truncations (at zero) of the normal distribution with mean,
  , and variance,
  .
.
Under these assumptions, the mean of technical inefficiency effects µi. So, it can more formally be expressed as:
 |
(2) |
In this, Z is a (1 x m) vector of observable farm-specific variables hypothesized to be associated with technical inefficiency, and δ is an (m x 1) vector of unknown parameters to be estimated.
Technical efficiency of the i-th sample tomato farm, denoted by TEi, is defined in terms of the ratio of the observed output to the corresponding frontier output, conditional on the levels of inputs used by that tomato farm [53]. It is given as:
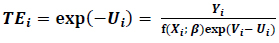 |
(3) |
In this,  is the stochastic production frontier.
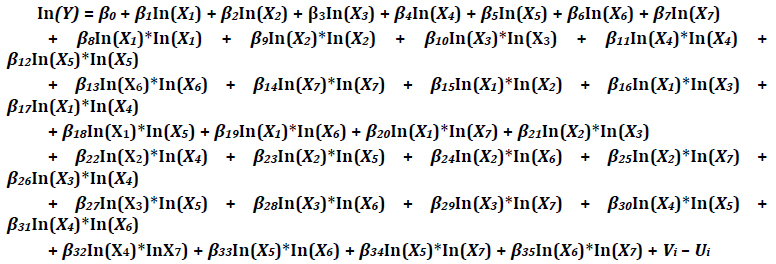
To estimate the model defined in equation (1), specific functional forms and inefficiency distributions must be chosen. A Trans-Logarithmic (TL) production function is used because this paper investigates the technical efficiency and factors affecting farm efficiency. Both Cobb-Douglas (CD) and TL function were estimated; the results indicated that the TL stochastic frontier [26, 27]. is dominant This TL stochastic frontier production function is specified as:
In this, Y is the value of tomato output measured in kilogram; X1 is farm size; X2 is the quantity of fertilizer applied in kilograms; X3 is labor; X4 is the amount of seed applied in kilogram; X5 is water quantity in cubic meters; X6 is an electricity bill in Omani Rials; and X7 is the amount of chemicals applied. In addition, β0, β1, β2, β3, β34 and β35 are parameters to be estimated. The Vi’s are assumed to be independent and identically distributed normal random variables with mean zero and variance  . Inefficiency scores, Ui, are assumed to be half-normally distributed. All variables are defined in detail in Table 1.
The inefficiency model is specified as:
 |
(4) |
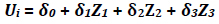 |
(5) |
In this, Z1, Z2, and Z3 are defined in Table 4.
2.4. Data to Estimate Technical Efficiency
Data for this study was collected by picking randomly and surveying a sample of 118 tomato farms from the Al-Batinah region. Located along the northwest coast of Oman, Al-Batinah is its leading vegetable growing region. Data analysis was performed using both SHAZAM comprehensive econometrics and statistics package and State general-purpose statistical software [57-66].
The selection of variables for the model was motivated by the variables used in previous tomato efficiency studies [67-69]. These are defined in Table 1.
3. RESULTS AND DISCUSSION
3.1. Global Perspective Demand and Supply of Vegetables
The worldwide vegetable market still mostly functions as a local market. Only 5% of the vegetables grown are traded internationally. However, that share is increasing indicates an increased potential for future vegetable export opportunities. According to a Rabobank report in 2018 [67], an estimated 70% of all vegetables grown in the world are sold as fresh vegetables [20, 22, 23]. While global consumption of preserved vegetables has decreased over the last decade, the overall market for vegetables is increasing worldwide, especially outside the United States and the European Union. Notably, demand is increasing for vegetables that are convenient to eat and prepare.
Most fresh vegetables are highly perishable. Thus, easy market access is essential [21]. The rise of new vegetable importing countries in recent years has been a significant change in world vegetable trade. Vegetable imports used to be concentrated in North America, Western Europe [57, 58], and Japan. Now, countries such as India, China [54], Russia, and the United Arab Emirates [11, 19] have increased vegetable imports, and it is expected to continue [21, 22]. The UAE's growing vegetable import activity gives Oman a significant advantage because of its proximity [23].
An emerging key global trend is the increasing production of vegetables in greenhouses and vertical farms. These production technologies help mitigate many of the limitations on conventional open-field vegetable farming in desert countries such as Oman, where Summer temperatures sometimes reach above 45ºC (113ºF) [18, 19]. One such approach is the net house, developed by the International Centre for Agricultural Research in the Dry Areas (ICARDA) and Arabian Peninsula National Agricultural Research Systems (NARS). This is a fabric insect-proof net greenhouse structure that enables high-yield vegetable production in desert conditions 8 to 9 months of the year. Studies in the region have shown that the net benefit income of net-houses in 8-9 months is about the same as cooled greenhouses in 12 months because of savings in cooling water, electricity, and other costs. Several other technologies have been developed and are being developed to maximize net profit, especially in desert conditions [11-20].
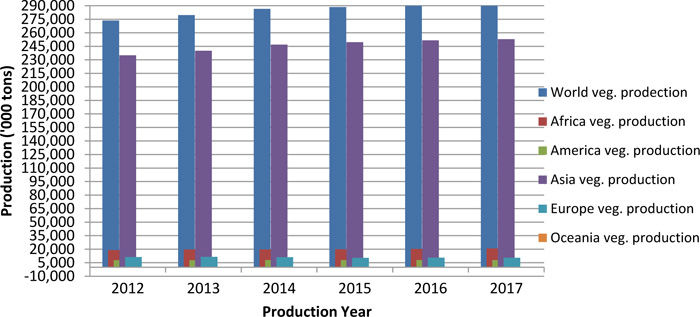
Statistics shows an increase in global vegetable production/supply (Fig. 1), of 7% from 273.5 million tons in 2012, to 292.5 million tons in 2017 [15, 16].
It is evident from Fig. (1) that Asia is leading globally in terms of vegetable production, followed by Africa, Europe, the Americas, and Oceania. The vegetable market in Oman is broadly classified into vegetables and fruits. These are sub-classified into onions, potatoes, tomatoes, garlic, cauliflower, cucumber, cabbage, beans and eggplant, and lemons, apples, bananas, oranges, grapes, strawberry, watermelon, grapefruit, dates, and olives.
| Variable Name | Description |
|---|---|
| Output (Y) | Tomato output in kilograms |
| Input variables (Xis) | |
| Farm size (X1) | Farm, the size used by the farmer, in hectares |
| Fertilizer (X2) | Fertilizer, the quantity applied in kilograms |
| Labor (X3) | Labor, quantity in hours |
| Seeds (X4) | Seeds amount applied, in kilograms |
| Water (X5) | Water, quantity in cubic meters |
| Electricity (X6) | Electric bill, the amount in Omani Rials |
| Chemicals (X7) | Chemicals amount applied in kilograms |
| Farm-Specific Variables | |
| Farmer’s age (Z1) | Age, number of years |
| Farmer’s experience (Z2) | Farmer’s experience, number of years |
| Farmer’s education dummy (Z3) (Z4)† |
Value = 1 if the number of years of education is below 12; 0 otherwise Value = 1 if the number of years of education is above 12; 0 otherwise |
As indicated in Table 2 below, the area under vegetable cultivation in Oman increased 199.6% from 272,000 tons in 2010 to 815,000 tons in 2017 [24-31]. During the same period, fruit production increased 23.2% from 366,000 tons to 451,000 tons, while field crop production decreased by 65.4%. The areas under cultivation followed those trends.
There is a potential for Oman to increase vegetable production significantly beyond current levels. Production can be intensified both in the open field and in greenhouses with or without soil (soilless culture or hydroponics) in the Batinah coast [32-36] and interior places such as near the Jabal Akhdar and Jabal Shams mountains.
Furthermore, vegetable production can also be increased in Salalah [8] in the Governorate of Dhofar, in southern Oman. This area has a typical monsoon climate from June to October annually, similar to that of South Asia, and it has adequate rainfall in the other seasons [5]. Salalah's climate, land, and water availability are conducive to growing fruits and vegetables year-round [5, 37-45].
3.2. Local and Imported Vegetables in Oman
Local vegetable markets in Oman are competitive, and their vegetable prices respond to the prevailing supply and demand forces. Omani vegetable prices for 2011 to 2017 are presented in Fig. (2) [22, 23, 30]. Overall, the prices of vegetables, such as cabbage, cucumber, eggplant, okra, and capsicum increased significantly during the time shown.
It is worth to note that okra is the highest-priced of the five Omani-grown vegetables. Okra was sold at 280 RO per ton in 2011 and settled at 383.4 RO per ton in 2017. Cabbage commanded the lowest price per ton, sold at 81 RO per ton in 2011, and increased to 117.6 RO per ton in 2017. Beyond noting price trends for individual vegetable crops in Fig. (2), it is also essential to look at the quantity produced for each of these vegetable varieties [17-23].

| Vegetables | Fruits | Field Crops | ||||
|---|---|---|---|---|---|---|
| Year | Area in Hectares | Tons Produced | Area in Hectares | Tons Produced | Area in Hectares | Tons Produced |
| 2010 | 7,777 | 272 | 38,353 | 366 | 8,252 | 55 |
| 2011 | 6,292 | 202 | 39,081 | 362 | 10,093 | 56 |
| 2012 | 5,944 | 193 | 39,081 | 351 | 9,614 | 46 |
| 2013 | 11,581 | 313 | 30,846 | 397 | 5,601 | 28 |
| 2014 | 13,106 | 335 | 30,846 | 317 | 4,842 | 22 |
| 2015 | 16,347 | 399 | 30,846 | 432 | 3,910 | 31 |
| 2016 | 17,351 | 413 | 30,846 | 443 | 4,249 | 19 |
| 2017 | 22,241 | 815 | 31,613 | 451 | 4,263 | 19 |
Data for Omani vegetable production from 2012 to 2017, along with local and import prices are presented in Table 3. This data shows that capsicum is the largest Omani vegetable crop with 53,742 tons in 2011, increasing to 191,597 tons in 2017, an increase of 256.5% in 7 years. This is followed by eggplant, cabbage, okra, and cucumber [30, 31]. Overall, local prices of vegetables in Oman are lower than import prices. Although there are a few isolated cases where local prices were higher than import prices, most of these were from depressed import prices rather than elevated local pricing. Thus, it is found that Omani farmers can produce vegetables competitively, and vegetables produced in Oman may compete on par with imported vegetables [68-72].
Given the above facts from the analysis of data on regular vegetable cultivation, it is observed that the local impact of global vegetable demand and supply is good, and its outlook is encouraging [73-80]. Global demand for vegetables has increased and is likely to continue the upward trend, especially the demand for organic vegetables in relatively wealthy countries such as Switzerland, Sweden [57], and the UAE [19]. A parallel increase in consumer health consciousness seems to be driving the current and expected future increase in ordinary and organic vegetables. Again, the UAE is not only increasing its imports of vegetables but also from its next-door neighbouring country, Oman, which is good news for Omani producers [81-89].
3.3. The Popularity of Organic Vegetables and Farming
Another emerging key trend in food commodities is the popularity of organic vegetables. In this era of increased environmental concern and consumer health consciousness across the globe, there is an increased demand for organic vegetables and more willing to pay a premium for them. Thus, organic fruits and vegetables are gaining market share around the world. In the U.S., this share is 9% of the total fruit and vegetable markets, which is quickly growing [18]. Organic vegetable sales have already passed 10% in wealthy countries such as Switzerland, Sweden, Austria, and Denmark [34, 57]. This trend is expected to continue in new emerging vegetable import markets such as the UAE. Because Oman is close to the emerging vegetable import market in the UAE [21, 74], Oman has a unique opportunity to benefit from both the standard-vegetable market and organic-vegetable niche market. The outlook is promising, with many opportunities for Omani producers of various vegetables and fruits [90-96].
A survey was conducted in the spring of 2019 with SQU students, their families, and friends. The first question asked was if consumers were willing to purchase organic products? The majority of them said 'yes' (54%) where as 17% of them said as yes as considered consuming, and 10% said flatly refused to consume with the statement ‘no’. However, there were 19% who were neutral, saying as do not know or not sure. The second question asked was to know whether these consumers were willing to buy organic products from local Omani farmers? A substantial majority (91%) said yes, whereas only 9% answered in the negative. The third question was concerned with these consumers to understand whether they believed that there was a need for a system of verification of organic food products. To this, 95% said ‘yes’, and just 5% said no. The next question was to know who should be responsible for providing this verification. A vast majority (92%) agreed that there should be a system of verification of which 52% chose the government to be responsible for verification, followed by 27% who chose independent certification agencies; 8% suggested companies buying from farmers to be responsible whereas 5% favored producer himself /herself for certification. Only a small percentage (8%) of people were not sure to respond.
From the same survey conducted with SQU students, their families, and friends, we found that fruits and vegetables were the most popular organic food category (83.5%) followed by dairy products as a second category with 49.5% (Table 4). Survey participants were allowed to select more than one category for this question.
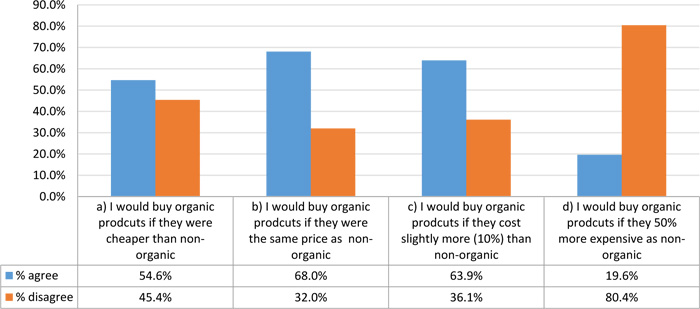
Then the consumer survey inquired about their opinion for willingness to pay. The survey asked four questions/ statements for the respondents’ response as agreed or disagreed with each statement. The results Fig. (3) showed that 50% or more of consumers were willing to buy organic foods in Oman if they cost the same as or even 10% more than the non-organic product. However, the percentage of willingness to buy dropped to the least to the extent of 20% when prices of organics were 50% higher. Thus, there existed differential responses of respondents in terms of willingness to pay based on the prices set for organic products (Fig. 3).
| Egg Plant | Okra | Cucumber | Capsicum | |||||||||
|---|---|---|---|---|---|---|---|---|---|---|---|---|
| Year | Production | Local | Import | Production | Local | Import | Production | Local | Import | Production | Local | Import |
| 2012 | 7,500 | 0.141 | 0.232 | 3,810 | 0.290 | - | 4,120 | 0.248 | - | 54,500 | 0.078 | 0.159 |
| 2013 | 12,320 | 0.127 | 0.176 | 4,384 | 0.241 | - | 4,432 | 0.149 | 0.197 | 74,790 | - | - |
| 2014 | 11,171 | 0.153 | 0.089 | 5,510 | 0.344 | - | 2,848 | 0.254 | 0.106 | 74,709 | 0.258 | 0.358 |
| 2015 | 10,018 | 0.160 | 0.230 | 5,468 | 0.360 | 0.275 | 3,848 | 0.207 | 0.251 | 116,408 | 0.247 | 0.580 |
| 2016 | 10,068 | 0.156 | 0.190 | 16,799 | 0.408 | - | 3,919 | 0.194 | 0.230 | 89,086 | 0.277 | 0.320 |
| 2017 | 32,062 | 0.186 | 0.209 | 19,992 | 0.512 | - | 5,200 | 0.200 | 0.203 | 191,597 | 0.249 | 0.425 |
| Category | Percentage of Consumers Who Would Prefer Organic for Various Food Categories |
|---|---|
| Fruit, Vegetable, Juices | 83.5% |
| Dairy Products | 49.5% |
| Meats (Poultry, Beef, etc.) | 25.8% |
| Cereals and Rice | 17.5% |
| Fish | 16.5% |
| Bread, Pasta, Flour | 12.4% |
| Herbs and Spices | 12.4% |
| Tea and Coffee | 10.3% |
3.4. Potential of Organic Farming to Benefit Fruit and Vegetable Sector
Certifying fruits and vegetables as organic has the potential to support higher pricing. Qualifying for certification as organic products requires a farm to have a minimum of three years since using any prohibited substance. These include most pesticides and all soluble fertilizers. Organic farming relies on natural forms of fertility, such as compost, manure, and even fish waste products, but may not use human wastewater or sludge. Pests such as insects, diseases, and weeds are controlled primarily through prevention. These technologies include crop rotation, physical barriers such as polyester row covers, bio-control methods, and a small number of allowed low-toxicity pesticides such as sulfur and copper to address diseases or neem oil for insects.
Organic farming goes back thousands of years and includes traditional methods used in every continent. However, the history of organic certification is relatively brief, having started in the early 1900s. This began with some “back to the land” and farmers' movements documenting organic methods in the modern and post-modern agricultural eras. The codification process culminated in basic standards first published in 1980 by the International Federation of Organic Agriculture Movements - Organics International (IFOAM). The European Union published its first regulations for organic production in 1991. The U.S. passed the Organic Foods Production Act in 1990 but did not publish a final version of organic standards until 2002. Predating in the EU and the U.S., Australia published regulations as early as 1974. Turkey and Egypt were also leaders in organic foods, publishing standards, or legislation in 1985 and 1990, respectively [18, 95].
Several organizations provide organic certification services internationally. They have common base-line requirements that are generally consistent with IFOAM standards [95, 96]. Organic certification requires third party annual inspection and documentation of a farm’s organic practices. Most farms are certified to specific standards for the country or continent to which they sell their products. For example, there are European standards for Europe, USDA for the U.S. and Japanese standards for Japan. At the same time, many countries and certifiers have reciprocal agreements that recognize certifications from other countries or continents.
By contrast, there are many “eco-labels” on food products in the marketplace. These may or may not be priced higher than non-eco-products and are “self-certified,” meaning that these are merely unverified claims from the seller. Experienced consumers who buy certified organic realize there is a difference between certified and “eco,” but consumers new to the organic marketplace may not realize the difference. Educated consumers are often willing to pay a premium price for certified products. Certified organic products are in high demand, which is the main reason for their higher price. Production costs may or may not be more dependent on the crop and production scale. However, farmers pay a substantial annual fee for certifying their products, and their product’s higher price in the marketplace helps to justify the time and money spent on certification.
In Oman, price premiums are paid for organic vegetables were sometimes twice to 10 times the price of ordinary vegetables, as shown in Table 5. Most of the vegetables listed are imported because, currently, only one farm in Oman is selling certified organic vegetables in Oman.
The future of organic farming in Oman can be projected fairly well by looking at prior experience in other countries. According to statistics gathered annually by IFOAM, there were 2.9 million farmers on 69.8 million hectares of organic land in 2017 in the world. Data available for 181 countries shows that globally 1.4% of agricultural land is being farmed for certified organic products. The countries having more than 10% of their agricultural land are in general farmed organically [96]. From this, a trend emerged that “early adopters” of organic legislation trends are higher in the ratio of land in organic food production [95, 96]. Conversely, countries without organic legislation or enforced definitions have lower organic adoption rates. This is partly because their farmers have no incentive to go through the extra work and cost of certification when their products with premium-cost certification labels are not protected from lower-cost products with “natural,” “eco-label” or other noncertified labels [95, 96].
IFOAM annual report highlighted various regions of the world and illustrated some general and country-specific trends [96]. For example, Sweden and Germany are high on the list of countries with certified organic lands-partly due to the early adoption of organic standards in Europe. Similarly, Australia is also high on the list for the same reason. The report also showed the nature of utilization of agricultural land for the production of organic foods continues to grow in these three countries even though Australia has seen a slight decline in the number of farms. The average size of an Australian organic farm is already much more extensive than those of other countries, and trending slightly larger. Egypt and Turkey are included in this list to illustrate their position as far ahead of others in the non-European Mediterranean/North Africa/ Middle Eastern region. Part of their early success was probably driven by meeting demand for organic foods from nearby European countries, but it is also linked to their early adoption of legislation to protect and promote organic farming. Started in Egypt in 1977, SEKEM [22] has supported organic agriculture and standards. These types of organizations usually started as non-profits, play an essential role in the early years of the development of organic standards [18, 22].
|
Price in Omani Rials/kg |
Organic vs. Conventional | ||
|---|---|---|---|
| Product | Normal | Organic | Price Premium |
| Beets | 0.35 | 1.99 | 569% |
| Eggplant | 0.94 | 4.06 | 434% |
| Mushroom white | 2.16 | 7.59 | 351% |
| Carrot | 0.27 | 2.59 | 959% |
| Cucumber | 0.17 | 1.84 | 1,099% |
| Potato | 0.29 | 2.59 | 893% |
| Summer squash | 0.63 | 2.79 | 443% |
| Canned tomato | 1.00 | 1.81 | 181% |
| cherry tomato | 3.50 | 5.64 | 161% |
| Roma tomato | 1.99 | 0.89 | 45% |
| Vine tomato | 1.13 | 5.58 | 494% |
| Colored pepper | 1.49 | 5.37 | 360% |
| Green pepper | 0.31 | 1.65 | 542% |
| Garlic | 1.49 | 9.90 | 664% |
| Leeks | 1.79 | 4.98 | 278% |
| Red onion | 0.19 | 2.26 | 1,209% |
| White onion | 0.77 | 1.99 | 259% |
| Lettuce | 0.52 | 4.16 | 807% |
| Bok choy | 0.43 | 2.99 | 702% |
| Cabbage white | 0.27 | 8.54 | 3,164% |
| Herbs/mint | 0.85 | 2.19 | 258% |
| Parsley | 0.85 | 2.99 | 352% |
The U.S. and UAE [74] have similar amounts/percentages of land in organic production even though the U.S. published their organic standards ten years before the UAE. The U.S. also seems to have a leveling off growth in both numbers of farms and area, with only 0.53% and 1.23% growth in land area and farms per year, respectively, over the past eight years, while the UAE has seen more than a 10-fold increase in both during the same time. These contrasting stories show that government support can help stimulate growth. Interestingly, when the organic standards were published in the U.S., larger organic farms got larger, and smaller farms started to “opt-out” of organic certification because they rely more on direct contact with their customers and less on a certified organic label [95, 96].
Japan's flat and falling numbers seem to tell a similar story to that experienced by the U.S. while in India, numbers seem to be increasing overall, but with a noticeable dip in 2013 as compared to 2009. We do not know if this is due to reporting errors or actual farm numbers decreasing temporarily and then increasing again. Jordan, on the other hand, saw rapid growth in farms and area from 2009 to 2013, which is primarily due to a government subsidy and support for organic farming. By 2017, the numbers had declined again, after the incentive programs ended, but are still slightly higher than in 2009 [95, 96].
Iran is seeing increasing numbers of farms, but declining land area in organic production, the opposite of the Australian trends [96]. Saudi Arabia has a new program to promote organic farming, thus provides technical support, research, and an in-country certification program in addition to external international certification, and has seen the number of farms increase, but organic land area decline [18, 96].
Oman has recently made a statement at a meeting of farmers of a commitment by the Ministry of Agriculture to create an office for organic agriculture. Still, it has not yet passed legislation to protect the organic label or develop its certification program. Farm numbers and land areas were not growing. This represents farms that are already certified ‘organic’ because of commitment to the principles of organic cultivation and/or consumption. Conversely, we have only one “market-oriented” farm, selling to the local hypermarkets in Muscat [1, 2].
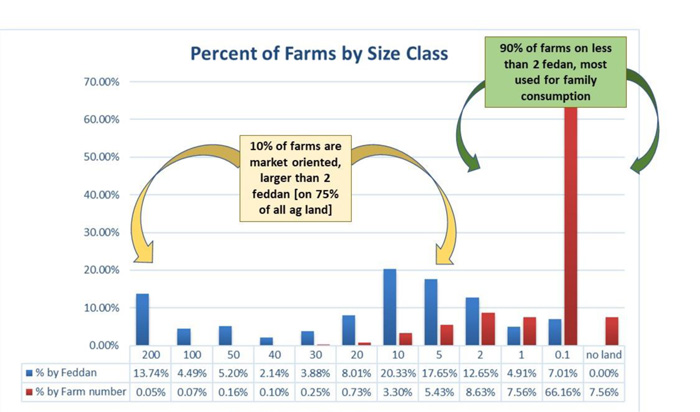
In general, there are few market-oriented farms in Oman, as compared to farms growing for home/family consumption. Data about marketing outlets used by farmers in Oman in 2013 Census of Agriculture shows that 88% of farms were grown primarily for family consumption, to sell at markets in Oman (9.5%) of which 0.5% was sold into the export market. The remainder is unknown or sold for processing [18-21, 97]. These data correspond reasonably well with farm size statistics in Oman, as shown in Fig. (4). There were 166,610 farms in Oman, according to 2013 Census of Agriculture. These had a total area of 315,011 feddans (132.3 hectares; 326.92 acres). Of these, 90% of them were two feddans (0.84 hectares; 2.07 acres) in size or smaller. 10% of farms that were larger than two feddans were potentially selling products in the marketplace [97].
3.5. National Organic Legislation in Oman and its Impact
What are the possible next steps in Oman regarding organic certification, and how will both the market-oriented and non-market-oriented farmers benefit from these next steps? Table 6 lists a summary of the current situation and five possible next steps with pros, cons, and comments for each scenario.
Currently, options A and E are both used in Oman. Outside international organizations provide certification of U.S. or EU markets to the six certified farms in Oman. However, so far, none of the products is known to be exported.
Option B is a possible next logical step that protects the word organic from “imitation.” The need is shown by few farmers that are marketing a “nearly organic” or non-certified organic product at farmers' markets, and one hydroponic grower even sells their product in a hypermarket with the label “certified awesome” and “beyond organic. This would be subject to a USD 10,000 fine if marketed in the U.S., because the word “organic” may only be used by certified producers, or small-scale non-certified producers selling directly to consumers, not in a retail outlet. This step could address this and provide an affordable way to obtain certification through some national label or recognition. Recently, both the UAE and Saudi Arabia have moved towards this in, and specified set of GCC common standards dated 2014 that can be used by these countries and Oman to “harmonize” their regulations for import and export. Additional agreements or accreditation steps would need to be taken to harmonize with EU, U.S., Japan, or other export markets. This has been done in recent years among many countries, including the U.S. and India, and has benefited both countries' markets and consumers [81-86].
[Source: 2013 Census of Agriculture; 1 faddan=0.42 ha].
| Option | Benefits/Pros | Downsides/Cons | Comments | |
|---|---|---|---|---|
| A. | Use out-of-country, established, international third-party organic certification organizations. | The option exists now. Once certified, entry to international markets (USA, EU, etc.) is available. | Costs are expensive. Some inspectors are not familiar with farming methods in Oman. | Currently: One-Cert (from USA and India) and ECOE (from Egypt) certify farms in Oman. |
| B. | Establish an “Oman Certified Organic Label” (must follow international standards and create third party inspection). | Models exist in other countries. It can be affordable for Omani farmers. | In-country certification only valid for local markets (in Oman), unless also accredited by an international certifier. It takes time to implement and needs organizational support. | The UAE and Saudi Arabia have implemented national organic labels and regulations. GCC set of standards was created in 2014 and could be used in Oman [97]. |
| C. | Create an Oman organic “Participatory Guarantee System” (PGS) using international standards and grower participation. | PGS is less expensive than most third-party organic certification systems. It includes the growers directly in implementing and enforcing compliance with standards. | Would not be recognized outside of Oman. Relies on grower volunteers and high mutual trust to follow standards. It takes time to develop and implement. It requires a strong leadership and grower organization. | The Omani farmers association would be the right candidate for this. |
| D. | Create and promote a new “eco-label.” | Many companies have developed alternative labels to organic, e.g., “eco” and “fair trade.” These appeal to consumers and are generally not as expensive. | “Self-certified” labels or product claims compete in the marketplace with certified organic; this confuses consumers. Without a third party or other verification, the labels mean nothing and eventually erode consumer confidence. | Some alternative claims can be backed up with third-party verification, e.g. “Fair Trade.” These labels could have meaning if there is government backing for verification. |
| E. | No regulation or official label for organic. No control over who uses the organic label. | All labels can compete in the marketplace. | There is no agreement about what “organic” means; no protection for the consumer. Without regulation, there is no penalty for misuse of the term. | This is the current situation in Oman. |
Option C requires a strong unity in farmers or growers' organization, and is becoming more popular in Brazil, India, New Zealand, and the U.S. The idea of farmers’ organization certification, called a “Participatory Guarantee System” (PGS), was sanctioned by IFOAM in 2010. The IFOAM database includes 240 PGS initiatives in 67 countries, with at least 142,955 producers certified [95, 96]. The Oman farmers' association is a probable candidate to be able to establish such a system but would require a few months or years of training, set-up, and on-going administrative oversight [97]. Crops with this label could be widely promoted and recognized in the in-country market but would not be eligible for export markets as certified organic without third party inspection by an external certifier. The same organic standards are used for certified and PGS products, however, which would make reciprocal recognition possible.
Option D is also feasible. There are many options for other “eco-labels” to describe the traditional farming practices, presently used in Oman, especially if they were combined with pesticide-free farming methods, use of natural or traditional soil amendments, etc. However, many eco-labels exist in the market already without any definitive or internationally recognized standards, without third party inspection, these labels can be meaningless or misleading. Therefore, although adding rigorously supported eco-labels seems an easy and inexpensive option, having too many labels can lead to more consumer confusion and frustration.
3.6. Results of Technical Efficiency Estimation
Technical efficiency analysis of the efficiency of vegetable farming in Oman gave the maximum likelihood estimates for equations 4 and 5, as shown in Tables 7 and 8. All the slope coefficients of the stochastic frontier are output elasticity of the included inputs. Parameters such as labor, water, and electricity were significant at 5% and 10% and had the expected positive signs related to output, except that water was negative, versus the a priori expectation of water to be positive. The negative sign was likely a result of the negative effects of saline water on tomato production, especially in coastal areas of Al-Batinah. The estimate of output elasticity of tomato production for labour was positive (6.86) and significant. This implies that a 10% increase in hired labour increases tomato output by 68%. The other variable, electricity (X6), was positive and significant as expected.
| Variable Name | Parameter | Coefficient | Standard Error | Z | P>|z| |
|---|---|---|---|---|---|
| In(X1) | β1 | 3.80 | 2.63 | 1.44 | 0.15 |
| In(X2) | β2 | 1.78 | 1.99 | 0.89 | 0.37 |
| In(X3) | β3 | 6.86 | 3.23 | 2.12 | 0.03 |
| In(X4) | β4 | 0.59 | 1.73 | 0.34 | 0.74 |
| In(X5) | Β5 | 5.81 | 2.04 | 2.85 | 0.00 |
| In(X6) | Β6 | 4.99 | 2.68 | 1.86 | 0.06 |
| In(X7) | Β7 | 2.74 | 14.30 | 0.19 | 0.85 |
| In(X1)*In(X1) | Β8 | 0.19 | 0.16 | 1.22 | 0.22 |
| In(X2)*In(X2) | Β9 | 0.20 | 0.07 | 2.93 | 0.00 |
| In(X3)*In(X3) | Β10 | 0.04 | 0.29 | 0.13 | 0.90 |
| In(X4)*In(X4) | Β11 | 0.21 | 0.08 | 2.72 | 0.01 |
| In(X5)*In(X5) | Β12 | 0.14 | 0.08 | 1.71 | 0.09 |
| In(X6)*In(X6) | Β13 | -0.07 | 0.12 | -0.60 | 0.55 |
| In(X7)*In(X7) | Β14 | -0.14 | 1.16 | -0.12 | 0.90 |
| In(X1)*In(X2) | Β15 | 0.20 | 0.20 | 1.00 | 0.32 |
| In(X1)*In(X3) | Β16 | -0.50 | 0.35 | -1.44 | 0.15 |
| In(X1)*In(X4) | Β17 | -0.07 | 0.19 | -0.36 | 0.72 |
| In(X1)*In(X5) | Β18 | 0.25 | 0.18 | 1.44 | 0.15 |
| In(X1)*In(X6) | Β19 | -0.20 | 0.31 | -0.66 | 0.51 |
| In(X1)*In(X7) | Β20 | -1.14 | 0.49 | -2.31 | 0.02 |
| In(X2)*In(X3) | Β21 | -0.13 | 0.21 | -0.61 | 0.54 |
| In(X2)*In(X4) | Β22 | 0.09 | 0.09 | 0.96 | 0.34 |
| In(X2)*In(X5) | Β23 | -0.23 | 0.09 | -2.57 | 0.01 |
| In(X2)*In(X6) | Β24 | -0.39 | 0.17 | -2.28 | 0.02 |
| In(X2)*In(X7) | Β25 | -0.24 | 0.34 | -0.71 | 0.48 |
| In(X3)*In(X4) | Β26 | 0.03 | 0.28 | 0.10 | 0.92 |
| In(X3)*In(X5) | Β27 | -0.35 | 0.27 | -1.26 | 0.21 |
| In(X3)*In(X6) | Β28 | 0.09 | 0.37 | 0.24 | 0.81 |
| In(X3)*In(X7) | Β29 | -0.41 | 0.54 | -0.75 | 0.45 |
| In(X4)*In(X5) | Β30 | -0.10 | 0.10 | -1.07 | 0.29 |
| In(X4)*In(X6) | Β31 | 0.01 | 0.18 | 0.06 | 0.95 |
| In(X4)*In(X7) | Β32 | -0.06 | 0.27 | -0.21 | 0.83 |
| In(X5)*In(X6) | Β33 | 0.41 | 0.14 | 2.94 | 0.00 |
| In(X5)*In(X7) | Β34 | 0.68 | 0.34 | 2.02 | 0.04 |
| In(X6)*In(X7) | Β35 | 1.21 | 0.41 | 2.96 | 0.00 |
| Constant | Β0 | 28.17 | 41.35 | 0.68 | 0.50 |
| Variable Name | Parameter | Coefficient | Standard Error | Z | P>|z| |
|---|---|---|---|---|---|
| Constant | δ0 | -8.47 | 5.91 | -1.43 | 0.15 |
| Farmer’s age (Z1) | δ1 | 0.161 | 0.1005 | 1.60 | 0.10 |
| Farmer’s experience (Z2) | δ2 | -0.117 | 0.082 | -1.41 | 0.16 |
| Education dummy (Z3) | δ3 | 1.453 | 1.797 | 0.81 | 0.42 |
| Variable Parameters | |||||
Sigma-square
|
σ2 | 0.98 | 0.11 | 9.26** | |
Gamma 
|
γ | 0.37 | 0.10 | 3.80** | |
| Log likelihood | -176.92 | ||||
| Mean of exp (−Ui) | 0.78 |
| Efficiency Index (%) | Study Sample | |
|---|---|---|
| Number of Farms | Compared to all Farms | |
| Less than 60% | 16 | 14% |
| 60-70% | 17 | 14% |
| 70-80% | 23 | 19% |
| 80-90% | 43 | 36% |
| 90-100% | 19 | 17% |
| Sample size | 118 | 100% |
| Measures of Central Tendency of the Farm Efficiency Index | ||
| Minimum | 0.54% | |
| Mean | 0.78% | |
| Median | 0.82% | |
| Maximum | 0.99% | |
| Standard Deviation | 0.23 | |
The estimated gamma value (γ) was 0.37, indicating that 37% of the total variation in tomato output is attributable to technical inefficiency. Coefficients of the inefficiency model are also presented in Table 7. The coefficient of farmer’s age was positive (0.161) and significant, meaning older farmers tended to be much more technically inefficient than their relatively younger counterparts.
Farmer’s experience coefficient was negative (-0.117) in accordance with a priori expectations. This means that experience decreases inefficiency and improves efficiency. That is, farmers with experience in tomato farming tend to be much more efficient, which was confirmed in similar results in the published literature [12, 15].
Farmer’s education coefficient was positive (1.453) i.e. farmers whose number of years of education was less than 12 years were less efficient than farmers with more than 12 years of education. This fact is agreeable with common sense-educated farmers are expected to easily adopt new crop husbandry methods and technologies that lead to improvements in technical efficiency. Educated farmers are also exposed to more new research findings, which enable them to manage their farm production better. The summary statistics of technical efficiency measures from this study are presented in Table 9.
Based on the estimates presented in Table 9, the mean technical efficiency for tomato farms in Oman was estimated to be 0.78, with a range from 0.54 to 0.99. These estimates are not significantly different from those reported by others in other Arab countries. They indicate that output can be increased on average by 22% with the present state of technology and the same amount of inputs as before if the technical inefficiencies are removed. Approximately half of the farmers are less than 80% efficient, and 53% of tomato farmers are more than 80% efficient. These results, therefore, indicate that there is substantial opportunity to enhance the technical efficiency of tomato farmers in Oman, and a great reward for doing so.
The Oman's economy is oil-dependent. Recent events in the international crude oil markets and the ongoing efforts internationally to develop clean energy cars are putting pressure on oil-dependent countries to look for alternative means to sustain their economies [1-3]. In this case, Oman is in the process of diversifying her economy to other non-oil sectors such as Fisheries, Tourism, and Agriculture. Under the economic diversification strategy, agriculture is expected to contribute more to the country's GDP. Among agricultural commodities grown in Oman, vegetables (especially Tomato) has excellent potential.
The outlook for the supply and demand of vegetables in Oman appears encouraging. On the demand side, the existing demand for vegetables in the country is much higher than domestic production. Therefore both demand and supply are strong and durable and will continue to increase in future. Therefore, Oman should welcome this opportunity by increasing vegetable production by both horizontal (open field, greenhouses and hydroponics) and vertical expansion by using big buildings to grow vegetables hydroponically [90-95]. Modern techniques will contribute significantly to increase productivity. Furthermore, the analysis shows that Oman local vegetable prices have consistently been lower than the imported vegetables, which put Oman farmers at the advantage of dominating the market.
In the case of organic farming, it is growing rapidly in many parts of the world, and consumer demand is translated into farming practices that promote consumer health, and at the same time, benefit the environment. The data presented shows that this consumer demand can also be translated into higher prices in the marketplace, but there is a limit to how many consumers are willing to pay higher prices. Third-party inspection and certification with a set of agreed-upon international standards is the ideal goal to strive for to help expand the number of growers in Oman. However, the path forward needs to fit the needs of farmers as well as local consumers, and be considered in the larger context of vegetable supply and demand in Oman and the other Gulf countries [98-105]. There is a good exposure to compare and contrast from India, Pakistan, and China, as well [95, 96].
Land and water suitable for agriculture are very scarce in Oman and are ecologically sensitive [1, 2, 106]. In this case, Oman needs to approach this new challenge carefully to avoid the unfortunate experience by Saudi Arabia1 . Saudi Arabia had to abandon a 30-year program in 2008 [5] to grow wheat that achieved self-sufficiency but depleted the desert kingdom's scarce water supplies. In order to successfully address this challenge sustainably, it is essential to assess the technical efficiency of farming operation of commodities such as tomatoes that are targeted in the economic diversification.
CONCLUSION
Analysis of data on ordinary vegetable cultivation establishes that the outlook for global vegetable supply and demand is found attractive. The global demand for vegetables, is increasing and will continue to do so. Moreover, growth is especially strong in demand for organic vegetables in wealthier countries such as Switzerland, Sweden, and the United Arab Emirates. Technical efficiency analysis indicated a potential increase in the production of vegetables with the present state of technology. Thus, vegetables have been proved to have prime significance, not only in elevating the livelihoods of those who grow vegetables but also in contributing to food security in Oman in terms of round the year availability of locally produced vegetables inside the country. Besides, growing organic vegetables to cater the needs of elite consumers has been providing a different dimension of vegetable cultivation successfully in the country.
LIST OF ABBREVIATIONS
| APRP | = Arabian Peninsula Research Program of ICARDA |
| CD | = Cobb Douglas |
| GDP | = Gross Domestic Product |
| ICARDA | = International Center for Agricultural Research in the Dry Areas |
| IFOAM | = International Federation of Organic Agriculture Movements |
| MAF | = Ministry of Agriculture & Fisheries, Oman |
| NARS | = National Agricultural Research Systems |
| PGS | = Participatory Guarantee System |
| SQU | = Sultan Qaboos University |
| TE | = Technical Efficiency |
| TL | = Trans-Logarithmic function |
| UAE | = United Arab Emirates |
| US | = United States |
ETHICS APPROVAL AND CONSENT TO PARTICIPATE
Not applicable.
HUMAN AND ANIMAL RIGHTS
No animals/humans were used for studies that are the basis of this research.
CONSENT FOR PUBLICATION
Not applicable.
AVAILABILITY OF DATA AND MATERIALS
The authors confirm that the data supporting the findings of this study are available within the article.
However, they are also available at:
https://www.maf.gov.om/Publications/Index/
FUNDING
None.
CONFLICT OF INTEREST
The author declares no conflict of interest, financial or otherwise.
ACKNOWLEDGEMENTS
The authors would like to acknowledge their gratitude towards the Ministry of Agriculture and Fisheries, AlKhwair, Muscat, and the College of Agriculture & Marine Sciences, the Sultan Qaboos University, Alkhoud, Muscat, Sultanate of Oman.

