All published articles of this journal are available on ScienceDirect.

Response of Soil Chemical Properties, Performance and Quality of Sweet Potato (Ipomoea Batatas L.) to Different Levels of K Fertilizer on a Tropical Alfisol
Authors Info & Affiliations
Abstract
Background:
The optimum rate of nutrient must be defined with reference to soil properties for individual crops and soil.
Objective:
Field experiments were carried out in 2015 and 2016 cropping seasons to determine the various levels (0, 40, 80, 120 and 160 kg ha-1) of potassium fertilizer (muriate of potash , KCl), on soil chemical properties, leaf nutrient contents, performance and proximate quality of sweet potatoes (Ipomoea batatas L.).
Method:
The five treatments were arranged in a randomized complete block design with three replicates.
Results:
Studies showed that K fertilizer in both the years significantly influenced N, P and K concentrations compared with the control and also increased the soil concentrations of these nutrients from 0 - 160 kg ha-1 K fertilizer. However, soil K only increased up to 80 kg ha-1 fertilizer after which there was a decrease. There was a reduction in the values of Ca and Mg in the soil as the levels of K increased. Leaf nutrient concentration of the sweet potato was consistent with the values of soil chemical properties recorded. 80 kg ha-1 K fertilizer was observed to be the highest value of sweet potato growth and tuber yield after which there was a reduction. The yield decrease was adduced to excessive K application leading to imbalanced sweet potato plant nutrition compared with N, P, Ca and Mg. K fertilizer significantly influenced moisture, vitamin C and carbohydrate compared with the control. The highest values of fibre and protein were obtained at 80 and 40 kg ha-1 K fertilizer, respectively. Dry matter and fat contents of the sweet potato reduced by K application from 0 - 160 kg ha-1 application rate.
Conclusion:
For best tuber yield, quality and economic response of K fertilizer to the sweet potato in the agro-ecological zone or in other similar soil conditions elsewhere in the tropics could be achieved by applying 80 kg ha-1 K fertilizer.
1. INTRODUCTION
Soils are integral components of agriculture and serve as a medium for numerous ecological, chemical and physical processes [1]. However, most soils of Africa are poor compared to most other parts of the world due to lack of volcanic rejuvenation which has resulted in various cycles of weathering, erosion and leaching, leaving soils poor in nutrients [2]. Soil fertility depletion is a fundamental root cause of the declining per capita food production; it has largely contributed to poverty and food insecurity [3]. In 30 years, as much as 37 African countries have lost over 132 million tons of nitrogen (N), 15 million tons of phosphorous (P) and 90 million tons of potassium (K) from cultivated lands [4]. Despite the cost of inorganic fertilizer, there is ample evidence that the use of fertilizers can be highly profitable. In addition to increased productivity, increased inorganic fertilizer use benefits the environment by reducing the pressure to convert forests and other fragile lands to agricultural uses and by increasing biomass production that helps in soil organic carbon content [3].
The sweet potato (Ipomoea batatas L.) is a member of the Convolvulaceae family. It is a perennial crop that is usually grown as an annual crop. Its short growing cycle of about 4 – 5 months has given it an advantage over other tuber crops like yam, cassava, and cocoyam. The sweet potato is important for its tubers which can be boiled, baked, roasted or fried for human consumption. The tubers can also be processed into flour for bread making, starch for noodles as well as used as raw material for industrial starch and alcohol [5]. Also, sweet potato roots are an excellent source of vitamin A (in form of beta carotene), vitamin C, manganese, copper, dietary fiber, vitamin B6, potassium and iron [6, 7].
The sweet potato requires a large quantity of nutrients, especially K for sustainability and improved cultivation. However, in Nigeria, farmers usually ignored K fertilizer application. This action has resulted in low tuber yield of sweet potato. K is absorbed by sweet potato in large quantities than any other nutrients. According to a study [8], the nutrients removed by the sweet potato crop producing 14 tonnes of biomass per hectare has been estimated to be 51.6 kg N ha-1, 17.2 kg P2O5 ha-1, 71.0 kg K2O ha-1. 6.1 kg MgO ha-1, 6.3 kg CaO ha-1 and 0.8 kg Fe ha-1.
K is essential in processes like photosynthesis, translocation of photosynthates, protein synthesis, control of ionic balance, regulation of plant stomata, turgor maintenance, stress tolerance, water use efficiency and activation of plant enzymes [9-11]. However, for better response to the applied nutrients, their optimum limits must be defined with reference to the soil characteristics for individual crops as soils and crops vary widely in their nutrient supply and utilization efficiency [12]. In China [13], K rate varied from 150 - 300 kg K2O ha-1. In India, the mean optimum rate was observed to be 120 kg K2O ha-1 [14]. In Calabar, (Ultisol) southeast Nigeria, the value ranged between 120 - 160 kg K2O ha-1 [15]. Rhue et al. [16] reported that the maintenance of optimum K level in the soil is important for the production of the potato plant.
Potassium fertilization may also influence the tuber qualities (fibre, carbohydrate, protein, moisture, fat dry matter and vitamin C) of sweet potatoes. This hypothesis has not been tested for Alfisol of Nigeria derived savannah. Chapman et al. [17] found increases in specific gravity and chip colour up to the optimum K fertilization (KCl) rate. However, K fertilization generally reduces specific gravity [18]. Studies on the effect of K fertilizer on soil chemical properties, sweet potato yield and quality are very scarce in Nigeria. It was hypothesized that soil chemical properties, sweet potato yield and qualities react differently to different rates of muriate of potash (KCl) fertilizer. Therefore, the objectives of this study were to evaluate the effect of K fertilizer on soil chemical properties, growth, yield, leaf nutrient concentration, and qualities of sweet potato tuber grown in a derived savannah ecology.
2. MATERIALS AND METHODS
2.1. Site Description and Treatments
Field experiments were carried out at the Teaching and Research Farm, Landmark University, Omu-Aran, Kwara state, Nigeria in 2015 and 2016 cropping seasons. The soil at Landmark University is an Alfisol classified as Oxic Haplustalf or Luvisol [19]. The Landmark University lies between Lat 8o 9’N and Long 5o 61’E and is located in the derived savanna ecological zone of Nigeria. There are two rainy seasons, one from March to July and the other from mid-August to November. The mean annual rainfall in the area is about 1300 mm and the mean annual temperature is 32oC. The experimental site in 2015 was under maize cultivation for two years and left to fallow for one year and in 2016, the site was left to fallow for two years before cultivation to the sweet potato. The site for 2015 experiment was just adjacent to that of 2016.
Each year, the experiment consisted of 5 levels (0, 40, 80, 120 and 160 kg ha-1) of potassium fertilizer applied as muriate of potash (KCl). The five treatments were arranged in a randomized complete block design with three replicates. The size of the experimental field each year was 187 m2. Each block comprised of 5 plots, each of which measured 3 × 3 m2. The blocks were 1 m apart and the plots were 0.5 m apart. Different sites within the same locality were used for the two years’ experiment.
2.2. Planting of Sweet Potato and Application of Potassium Fertilizer
Each year, conventional tillage that involved ploughing, harrowing and ridging was performed before planting. Three ridges were maintained per plot. The planting of sweet potato vine of about 25-30 cm long was carried out in April at each year on ridges at a distance of 1 m × 1 m to give a plant population of 10,000 plants per ha. Potassium fertilizer was applied at the rates 0, 40, 80, 120 and 160 kg ha-1 during planting at 10 cm away from the planted cuttings by banding. Also, at this stage, nitrogen (urea) and phosphorus (single super phosphate) at the rates of 60 kg N ha-1 and 50 kg P2O5 ha-1 respectively, were applied as basal applications to boost the growth of the potato as the site was deficient in these nutrients.
2.3. Determination of Soil Properties
In both the years (2015 and 2016) prior to the start of the experiments, soil samples (0 - 15 cm) were randomly collected from 10 different points from the experimental site (to serve as composite soil sample). The soil samples were bulked together, air-dried and sieved with a 2-mm sieve for chemical analysis, as described in a study [20]. The hydrometer method [21] was used to carry out the particle-size analysis. The pH of the soil sample was determined in a soil/water (1: 2) suspension using a digital electronic pH meter. The Walkley and Black procedure by wet oxidation using chromic acid digestion [22] was used for the determination of Organic Carbon (OC). Organic Matter (OM) was calculated by multiplying OC by 1.724. Micro-Kjeldahl digestion and distillation techniques [23] were used for the determination of total N. Bray-1 extraction followed by molybdenum blue colorimetry [24] was used for the determination of soil available P. Exchangeable K, Ca and Mg were extracted using 1 M NH4OAc, pH 7 solution. Exchangeable K was thereafter analysed with a flame photometer and Ca and Mg with an atomic absorption spectrophotometer [25]. At the end of each year’s experiment (at harvest of sweet potato), soil samples were also collected on plot basis (with three samples from each plot and latter bulk together) and similarly analysed for soil chemical properties as explained above.
2.4. Growth, Yield and Tuber Quality of Sweet Potato Measurements
Vine length, number of leaves, vine weight and tuber weight were determined at harvest (150 days after planting). The vine length was measured by a meter rule, the number of leaves per plant was determined by counting while the vine weight and tuber weight were determined by weighing on a top loading balance after washing and cleaning to remove any traces of sand from the sweet potato tubers. Samples of sweet potato tuber from each plot were taken for proximate analysis. The moisture, dry matter, crude fibre, crude protein, crude fat and carbohydrate contents of the sweet potato were determined using standard chemical methods described by the Association of Analytical Chemists [26]. The moisture content was determined by drying 2 g of each sample at 105oC till constant weight was achieved. Total dry matter was determined by oven drying at 70°C to constant weight. Soxhlet extraction technique using petroleum ether (40 - 50oC) was used to evaluate the fat content of the samples. The crude protein content of the sample was determined by micro-Kjeldahl digestion and distillation method [27]. The carbohydrate content of the sample was estimated by using the method described in a study [28]. Vitamin C content of the sample was determined by dichlorophenolindophenol titration [29].
2.5. Sweet Potato Leaf Analysis
Leaf samples were collected from sweet potato crops each year on a plot basis, oven dried for 24 h at 80oC and ground in a Willey mill. These samples were analyzed for N, P, K, Ca and Mg content [30]. Leaf N was determined by the micro-Kjeldahl digestion method. Ground samples were digested with nitric-perchloric- sulphuric acid mixture for the determination of P, K, Ca and Mg. Phosphorus was determined colorimetrically using the vanadomolybdate method, K was determined using a flame photometer and Ca and Mg were determined by the EDTA titration method [31].
3. RESULTS
3.1. Initial Physical and Chemical Properties of Soil at the Experimental Sites
The physical and chemical properties of the two sites are presented in Table 1. The soils were sandy loam in texture, low in Organic Matter (OM), N, P, K, Ca and Mg. However, Mg for 2015 was adequate according to the critical values of nutrient in agro-ecological zones of Nigeria [32]. Hence it is expected that the application of K fertilizer would enhance soil fertility and sweet potato performance.
3.2. Effect of K Fertilizer on Soil Chemical Properties
Table 2 shows the results of the effects of K fertilizer on the soil’s chemical properties. Application of K fertilizer significantly increased the concentrations of N, P and K in the soil compared with the control. K fertilizer increased the N and P from 0 - 160 kg ha-1 while K increased up to 80 kg ha-1 fertilizer after which there was a decrease. Application of K fertilizer reduced the concentrations of Ca and Mg in the soil compared with the control. The reduction was from 0 - 160 kg ha-1 fertilizer.
| Soil Property | 2015 | 2016 | *Critical Values |
|---|---|---|---|
| Sand (%) | 69.0 | 69.0 | – |
| Silt (%) | 13.1 | 13.6 | – |
| Clay (%) | 17.9 | 17.4 | – |
| Textural class | Sandy loam | Sandy loam | – |
| pH (water) | 5.62 | 5.68 | – |
| Organic matter (%) | 1.24 | 1.48 | 3.0 |
| Total N (%) | 0.16 | 0.15 | 0.20 |
| Available P (mg kg-1) | 9.8 | 8.9 | 10.0 |
| Exchangeable K (cmol kg-1) | 0.15 | 0.14 | 0.16 – 0.20 |
| Exchangeable Ca (cmol kg-1) | 1.72 | 1.80 | 2.0 |
| Exchangeable Mg (cmol kg-1) | 0.40 | 0.39 | 0.40 |
| K Fertilizer (kg ha-1) |
N (%) |
P (mg kg-1) |
K (cmol kg-1) |
Ca (cmol kg-1) |
Mg (cmol kg-1) |
|||||
|---|---|---|---|---|---|---|---|---|---|---|
| 2015 | 2016 | 2015 | 2016 | 2015 | 2016 | 2015 | 2016 | 2015 | 2016 | |
| 0.0 | 0.17d | 0.15e | 9.4d | 8.5d | 0.13d | 0.13d | 1.70a | 1.74a | 0.40a | 0.38a |
| 40.0 | 0.18c | 0.16d | 10.5c | 9.5c | 0.22c | 0.20c | 1.68a | 1.70a | 0.38b | 0.36b |
| 80.0 | 0.19b | 0.17c | 10.9b | 10.3b | 0.27a | 0.26a | 1.60a | 1.63a | 0.35c | 0.33c |
| 120.0 | 0.22a | 0.20b | 11.9a | 10.9a | 0.26a | 0.25a | 1.56bc | 1.57bc | 0.33d | 0.32d |
| 160.0 | 0.22a | 0.21a | 11.9a | 10.9a | 0.27a | 0.25a | 1.50c | 1.53c | 0.31e | 0.30d |
| K Fertilizer (kg ha1) |
N (g 100g-1) |
P (g 100g-1) |
K (g 100g-1) |
Ca (g 100g-1) |
Mg (g 100g-1) |
|||||
|---|---|---|---|---|---|---|---|---|---|---|
| 2015 | 2016 | 2015 | 2016 | 2015 | 2016 | 2015 | 2016 | 2015 | 2016 | |
| 0.0 | 2.24d | 2.20e | 0.16e | 0.14e | 1.26c | 1.20c | 1.23a | 1.20a | 0.72a | 0.68a |
| 40.0 | 2.31c | 2.28d | 0.17d | 0.15d | 1.38b | 1.31b | 1.20b | 1.18b | 0.69b | 0.67b |
| 80.0 | 2.36b | 2.35c | 0.18c | 0.16c | 2.50a | 2.46a | 1.18c | 1.14c | 0.60c | 0.63c |
| 120.0 | 2.41a | 2.40b | 0.19b | 0.17b | 2.49a | 2.45a | 1.16d | 1.10d | 0.58d | 0.54e |
| 160.0 | 2.42a | 2.48a | 0.20a | 0.18a | 2.49a | 2.44a | 1.14e | 1.04e | 0.56e | 0.50e |
| K Fertilizer (kg ha1) |
Tuber Yield (t ha-1) | Vine Length (m) | Vine Weight (t ha-1) | Number of Leaves/Plant | ||||||||
|---|---|---|---|---|---|---|---|---|---|---|---|---|
| 2015 | 2016 | Mean | 2015 | 2016 | Mean | 2015 | 2016 | Mean | 2015 | 2016 | Mean | |
| 0.0 | 10.1d | 10.8c | 10.5c | 1.30c | 1.60c | 1.45c | 1.18c | 1.24c | 1.21c | 166c | 178c | 172c |
| 40.0 | 17.6c | 17.2b | 17.4b | 2.60b | 2.07ab | 2.34b | 1.50b | 2.07b | 1.79b | 250b | 252b | 251b |
| 80.0 | 23.5a | 25.7a | 24.6a | 2.80a | 2.11a | 2.46a | 2.22a | 2.46a | 2.34a | 311a | 325a | 318a |
| 120.0 | 23.4ab | 25.5a | 24.5a | 2.61b | 2.01b | 2.31b | 2.21a | 2.45a | 2.33a | 310a | 322a | 316a |
| 160.0 | 22.9a | 24.8a | 23.9a | 2.60b | 2.07b | 2.34b | 2.20a | 2.45a | 2.33a | 308a | 320a | 314a |
3.3. Effect of K Fertilizer on Nutrient Concentration of the Sweet Potato Leaf
Table 3 shows the result of the effect of K fertilizer on the nutrient concentration of the sweet potato leaf. Application of K fertilizer increased N, P and K concentrations in sweet potato leaves significantly compared with the control. The values of N and P increased from 0 - 160 kg ha-1 K fertilizer. K in the sweet potato leaves was at its peak at 80 kg ha-1 K fertilizer after which there was a decrease. Application of K fertilizer reduced the values of Ca and Mg in the sweet potato leaves with 160 kg ha-1 having the least value while the control (no fertilizer application) had the highest value.
3.4. Effect of K Fertilizer on the Growth and Yield of Sweet Potato
The effects of K fertilizer on the growth and yield of sweet potatoes are as shown in Table 4. In both the years, the application of K fertilizer increased the growth - vine length, vine weight, number of leaves per plant and tuber yield of sweet potatoes significantly compared with the control. The growth and yield increased from 0 - 80 kg ha-1 K fertilizer after which, there was a slight decrease observed. There were no significant differences between 80, 120 and 160 kg ha-1 K fertilizer. Using the mean of the two years, compared with the control, the application of 40, 80, 120 and 160 kg ha-1 fertilizer increased the sweet potato tuber yield by 65.7, 134.3, 133.3 and 127.6%, respectively.
3.5. Effect of K Fertilizer on Proximate and Vitamin C Contents of Sweet Potato Tuber
The effect of K fertilizer on proximate and vitamin C contents of sweet potato is presented in Figs. (1a-c, 2a-d). K fertilizer influenced moisture content, vitamin C and carbohydrate significantly compared with the control. Application of K fertilizer increased the protein content of sweet potato tuber up to 40 kg ha-1 level, after which, there was a reduction in the content. There was a reduction in the dry matter contents of sweet potato tuber as the levels of K fertilizer increased from 0 - 160 kg ha-1 (Fig. 1b). The carbohydrate content increased significantly at all levels of K fertilizer application compared with the control. The highest value of carbohydrate was obtained at 80 kg ha-1 fertilizer after which, there was a reduction. The moisture content of the sweet potato tuber increased significantly with the application of K fertilizer at all levels compared with the control. The moisture content increased from 0 - 160 kg ha-1 fertilizer (Fig. 2a). The fat contents (Fig. 2b) decreased progressively with the levels of K fertilizer from 0 - 160 kg ha-1, whereas, fibre and Vitamin C (Figs. 2c & Fig. 2d respectively) were influenced with the application of K fertilizer with both having their highest values at 80 kg ha-1 K fertilizer.
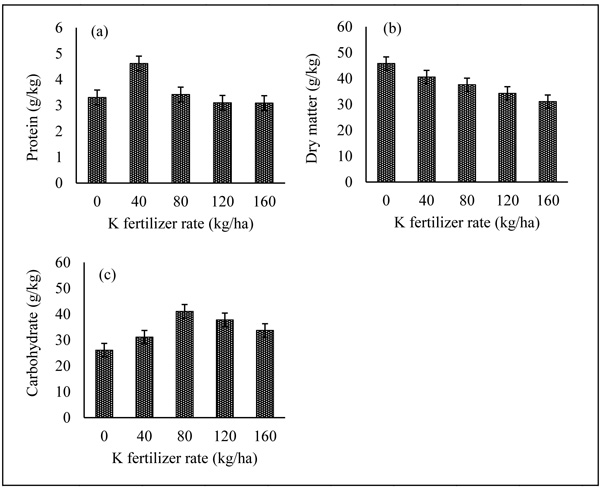
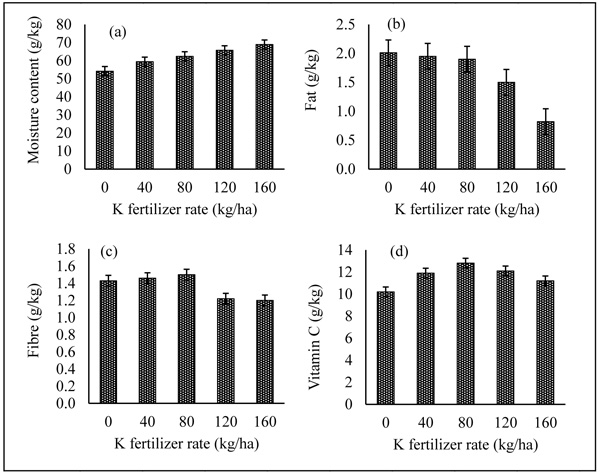
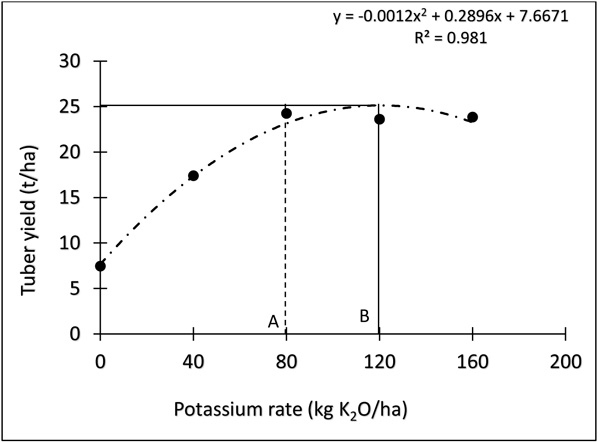
Fig. (3) describes the relationship between tuber yields of the sweet potato in response to K fertilizer application. Increasing K fertilizer rate from 0 to 80 kg ha-1 (A) increased the tuber yield of sweet potato to 25 t ha-1. Further increase in the rate of K fertilizer to 120 kg ha-1 (B) did not result in a significant increase in sweet potato tuber yield.
4. DISCUSSION
The response of the soil to K fertilizer showed that the soil was deficient in K. Table 1 shows that the soil of the site was deficient in K according to the critical value of nutrients (0.16 - 0.20 cmol kg-1) [32] for crops in the agro-ecological zones of Nigeria. There was an increase in N, P and K but Ca and Mg decreased. The increases in N, P and K in the soil were because of fertilization. However, Ca and Mg decreased in the soil and also in the plants, this means the amounts of both Ca and Mg were not sufficient in the soil so the concentrations in the plants decreased related with the plant growth (a dilution effect occurred). When plants grew bigger, the concentrations were diluted when compared to the small ones. Above 80 kg ha-1 K fertilizer, the K soil concentration started to reduce. This suggests that this rate of K fertilizer is sufficient for the sweet potato.
The response of leaf nutrient concentration of sweet potato was consistent with the values of soil chemical properties recorded for this experiment. For both the years pooled, the correlations between soil N and leaf N, soil P and leaf P, soil K and leaf K, soil Ca and leaf Ca, soil Mg and leaf Mg were all significant having r values of 0.960, 0.956, 0.914, 0.979 and 0.931, respectively. There was increased nutrient availability in the soil, hence increased uptake by sweet potato plants.
Application of K fertilizer increased the growth and tuber yield of sweet potato in this study. The function of K in increasing growth and yield of crops might be attributed to its role in cell division, formation and translocation of carbohydrates (sugar and starch), the activator of several enzymatic systems, in the regulation of osmosis or control of water in plants, cell permeability, in the conversion of sugar into organic acids in roots, and in the regulation of N uptake by roots [33]. Potassium is known to increase tuber development in roots and tuber crops which respond highly to the generous application of K fertilizer. Hence, the positive response of the tuber yield of sweet potato can be adduced to the high starch synthesis and translocation activity brought about by K fertilizer application. Moreover, K application enhanced the stomata resistance coupled with the reduced transpiration rate and increased relative water content thus, it may improve the water storage capacity of the cell and provide conditions for better yield [34].
In this study, K application increased vine length, vine weight and numbers of sweet potato leaves compared with the control. This can be related to the fact that K enhances N uptake. The result that K fertilizer at 80 kg ha-1 increased growth and yield implies that this amount corresponds to other factors and sweet potato requirement.
The decrease in yield might also be the result of excessive K application leading to imbalanced sweet potato plant nutrition compared with N, P, Ca and Mg. The decrease in yield occurs because uptakes of other nutrients are usually affected.
From this study, the uptake of Ca and Mg greatly affected at 80 kg ha-1 K level (Table 4). However, nutritional balances between soil K, Ca and Mg are important in plant nutrition [35]. Shukla and Mukhi [36] observed the antagonistic relationship between K, Ca and Mg during absorption by the roots and translocation from the roots to the shoot. Excess of K fertilization restricts Mg and Ca absorption in the tissue which may cause Mg and Ca deficiencies. It was reported [37] that the high rate of K fertilization increased K/Mg ratio and decreased Mg concentration in potato petioles. The K fertilizer applied above this (80 kg ha-1) rate will lead to yield reduction. This study revealed that the optimum K fertilizer in the form of KCl for sweet potato cultivation is 80 kg ha-1 on a tropical Alfisol. However, in another location Calabar, southeast Nigeria, Uwah et al., [15] recommended 120 - 160 kg ha-1 KCl (muriate of potash) fertilizer for the sweet potato. The optimum yield of sweet potato has also been obtained by applying 150 - 300 kg K2O [13]. Trehan [38] and Sharma and Trehan [39] reported that the response of potato to K is considerably influenced by the soil type and agro-climatic zones.
Estimation of nutrients within the leaves or fruit is very important and complex because it is associated with many physiological processes that occur within the plants and fruits. Potassium fertilizer plays a major role in plant physiological process. It was reported [40] that fruit weight and fruits size increase with an increase in potassium fertilizer. Potassium has been noted to improve fruits quality by increasing the total sugar and total soluble solids in fruits [41]. The increase in the moisture content of the fruit due to an increase in potassium fertilizer observed in this experiment can be attributed to the major role played by potassium in the swelling and expansion of cells and has a close relationship with water [42].
Vitamin C content in tuber was positively affected by the application of K as compared with the control, this is in support of the findings of another study [43] that found the use of potassium as a fertilizer leads to increase juice and vitamin C content in banana and grapes as a result of maintaining the pH and total acidity in fruits. It has also been reported [44] that potassium improves the transfer of radiation energy into primary chemical energy in the form of ATP (Photophosphorylation) and NADPH. This energy is required for all synthetic processes in plant metabolism, which express the quality of the crops. The high energy status in crops well supplied with potassium also promotes the synthesis of secondary metabolites, like vitamin C [45].
The 40 kg ha-1 K fertilizer increased the protein content of sweet potato tuber compared with the control because potassium facilitates the uptake and assimilation of nitrogen into simple amino acids and amide which favors peptide synthesis leading to protein synthesis. The observed improvement in the carbohydrate of the sweet potato upon the application of K fertilizer can be explained on the basis of the positive effect of K on the translocation of the assimilates [45]. Application of K fertilizer at optimum level increases starch concentration in plants and K deficiency changes carbohydrate metabolism such as the accumulation of soluble carbohydrate and the decrease in starch content [46]. However, heavy application rate of potassium may decrease starch content [47]. For this study, K fertilizer did not increase the dry matter yield of the sweet potato, this could be due to KCl used as the source of K fertilizer. Bansal and Trehan [48] also reported a reduction in dry mater content in tubers when fertilized with KCl. This can be adduced to the chloride ion rather than the potassium itself. However, K2SO4 increases dry matter content of tubers [49, 50]
Using the means of the two years (Fig. 3), yields of the sweet potato increased by adding K fertilizer up to 120 kg-1. There was no significant difference between 80 and 120 kg ha-1 K as they produced the same yield value (25 t ha-1) of the sweet potato. The increase in the application of K fertilizer from 80 to 120 kg ha-1 K could highlight an economic loss to the farmers, considering the cost and scarcity of K fertilizer in Nigeria and other tropical countries. Either applying 80 or 120 kg fertilizer, the farmers will still have the same yield of the sweet potato. Therefore, the best economic response of K fertilizer to the sweet potato in the agro ecological zone or other similar soil conditions elsewhere in the tropics could be achieved by applying 80 kg ha-1 K fertilizer.
CONCLUSION
Application of K fertilizer in both the years increased soil N, P and K concentrations significantly compared with the control and also increased the soil concentrations of these nutrients from 0 - 160 kg ha-1 K fertilizer. Soil K was only increased up to 80 kg ha-1 fertilizer after which there was a decrease. There was a reduction in the values of Ca and Mg in the soil as the levels of K increased. The response of the nutrient concentration of sweet potato leaf was consistent with the values of soil chemical properties recorded for this experiment. Application of 80 kg ha-1 K fertilizer resulted in the highest value of sweet potato growth and tuber yield after which there was a reduction. Using the mean of the two years, compared with the control, application of 40, 80, 120 and 160 kg ha-1 fertilizer increased the sweet potato tuber yield by 65.7, 134.3, 133.3 and 127.6%, respectively. K fertilizer influenced moisture, vitamin C and carbohydrate significantly compared with the control. Dry matter contents of the sweet potato reduced by K application from 0 - 160 kg ha-1 application rate. Therefore, the best yield, quality and economic response of the sweet potato to K fertilizer in the agro ecological zone or other similar soil conditions elsewhere in the tropics could be achieved by applying 80 kg ha-1 K fertilizer.
ETHICS APPROVAL AND CONSENT TO PARTICIPATE
Not applicable.
HUMAN AND ANIMAL RIGHTS
No animals/humans were used for studies that are the basis of this research.
CONSENT FOR PUBLICATION
Not applicable.
AVAILABILITY OF DATA AND MATERIALS
Data collected were subjected to statistical Analysis of variance (ANOVA) using IBM SPSS Statistics 21 and the Microsoft Excel 2013.
FUNDING
None.
CONFLICT OF INTEREST
The authors declares no conflict of interest, financial or otherwise.
ACKNOWLEDGEMENTS
The management of Landmark University is appreciated for willing to support the publication charges of this article.

