All published articles of this journal are available on ScienceDirect.

Comparison between Korea’s Grants-based ODA in Agriculture and Status of Food Security of its Recipient Countries in Asia
Abstract
Introduction:
Agriculture tends to be the main employer and income source in many developing countries. Recognizing the value of agriculture for food security and poverty reduction, major donors invest in the agricultural development through the Official Development Assistance or ODA. Of the donors, the Republic of Korea stands out with its historical experience from being a recipient to donor. However, it is not very clear with what criteria Korea would select its recipient countries to disburse its agricultural ODA. Thus, the main objective of this study is to examine a following hypothesis; Korea disburses its agricultural ODA in Asia based on the recipient country’s level of food insecurity.
Materials and Methods:
To test the hypothesis, collected data are analyzed and comparisons are made between Korea’s grants-based agricultural ODA disbursements and the status of food insecurity of its major recipients in Asia.
Results:
Although limited to the grants-based agricultural ODA, the results reveal that distribution of the agricultural ODA across the select recipient countries in Asia does not correspond to their severity of food insecurity. Rather, the least food insecure country or the Philippines received the largest agricultural ODA.
Conclusion:
It appears that at least at a recipient-country level, Korea may have other selection criteria for its grants-based agricultural ODA disbursement or more likely consider a combination of underlying factors that combine both Korea’s national interest and a recipient country’s sociopolitical environment.
1. INTRODUCTION
Globally, 821 million people or 10.9% of the global population are estimated to be suffering from chronic food dep rivation [1]. The majority of those facing poverty and hunger live in developing countries with food insecurity as their defining factor of life. At a national level, chronic food deprivation entails serious consequences in the developing countries; for instance, decreased productivity in population can prevent those countries from maximizing their economic capacity to facilitate development [2]. Therefore, ensuring food security supports not only the welfare of the poor but also economic development and political stability [3]. Poverty reduction is a proven path towards improved food security, yet a more direct and immediate path can be agricultural development.
Agriculture is the largest employer and a major source of income for rural households in many developing countries [4]. Yet, agricultural productivity in the developing countries is generally low due, in part, to insufficient use of inputs, low adoption of suitable technologies, land degradation or inadequate water management [3]. Other obstacles also exist such as government priorities geared towards other development sectors, unfavorable agricultural policies, budget shortages and changing global markets [5]. Despite these challenges, growth in agriculture tends to directly favor the rural poor and generate poverty-reducing effects through increased demands for agricultural services and employment opportunities for the landless poor [6, 7]. Recognizing the socioeconomic values of agricultural development, international donors invest in agriculture as a part of their Official Development Assistance or ODA. The collective ODA to agriculture fluctuated in the past, a peak around 1983 to 1986 and downturn through 2000. Several reasons are attributed to the downward trend in agricultural ODA: high global food surpluses, low commodity prices, agricultural aid fatigue, opposition from farm lobby groups, and changes in donor policies to other sectors [6, 7]. However, in the beginning of 2000, donors’ interest in agricultural development re-emerged from the rising food prices and high-profile political commitment to eradicate hunger [7].
Currently, there are 30 members of the Organisation for Economic Co-operation and Development (OECD) Develop ment Assistance Committee (DAC) as major ODA donors [8]. Of them, the Republic of Korea (hereafter Korea) stands out as a country that successfully transformed itself from an aid recipient to donor. In 2018, Korea ranks 16th in terms of the ODA quantity among the DAC members, and 26th for its ODA to GNI (Gross National Income) ratio [9]. Strategically, Korea mainly supports two regions, Asia and Africa. According to the 2019 ODA planning of Korea, Asia receives 39% of Korean ODA increased from the previous year’s 37% and Africa receives 20.6% also increased from 18.3%. In addition, these two regions include most of Korea’s Priority Partner Countries. These partner countries, selected in every 5 years, are critically important since approximately 70% of Korean bilateral ODA is allocated to those selected countries [9]. In the 2010 selection, Asia and Africa included 19 countries out of the 26 Priority Partner Countries: 11 in Asia and 8 in Africa. In the 2015 selection, the two regions included 18 countries out of 24: 11 in Asia and 7 in Africa [10].
The grants-based ODA of Korea is primarily executed by the Korea International Cooperation Agency (KOICA). The agency operates in six focus sectors: health, education, public administration, technology-environment-energy, Agricultural-Rural Development (ARD), and emergency relief. Of the six sectors, KOICA disbursed around 15% of its budget to ARD in 2016 with a clear objective, which is ‘improving food security and reducing poverty by building a resilient and income-generating agricultural system’ in rural communities in developing countries [11].
However, what is not clear is with what criteria the Korean agency selects its recipient countries to disburse its ARD ODA budget. The agency might depend on the list of the Priority Partner Countries of Korea, levels of national food insecurity, more narrowly the status of rural poverty or other considerations. As an initial study of this kind and given the agency’s stated goal, this research starts with a hypothesis that KOICA disburses its ARD ODA budget mainly based on the national standing of food insecurity of its potential recipient countries. In other words, the more food insecure the country is, the larger the ARD disbursement it would receive from the Korean agency. To examine this hypothesis, comparisons are made between top ARD recipient countries of KOICA and their status with food security indicators during the past decade. Two such indicators utilized for this study are the Prevalence of Undernourishment (PoU) from the Food and Agriculture Organization of the United Nations (FAO) and the Global Hunger Index (GHI) from the International Food Policy Research Institute (IFPRI).
Currently, PoU and GHI are the most extensively used indicators to measure and compare national-level food security [12]. For this study, each of these indicators is cross-examined with top Asian ARD recipients of KOICA over the past ten years. Asia is chosen because it is the strategic region that continues receiving the largest amount of Korean ODA. The ten-year period from 2006 to 2016 is chosen for two reasons; first, the data sets to examine the hypothesis are reliably available during these years; second, the ten-year period should provide a reasonable amount of evidence to draw meaningful conclusions, given Korea’s short history as a major donor. Results of this research are expected to indicate a degree of consistency between the ARD disbursement rankings of its Asian recipient countries and their status of national food insecurity. This reflection on the past practices with the ARD grants can draw useful policy implications for Korea and KOICA to achieve its ARD goals.
2. MATERIALS AND METHODS
2.1. Two Food Security Indicators
The 1996 World Food Summit defines food security as ‘it exists when all people, at all times, have physical and economic access to sufficient, safe and nutritious food that meets their dietary needs and food preferences for an active and healthy life’ [13]. This definition is built on the four dimensions of food security: food availability, access, utilization and stability. Availability indicates sufficient food supply in quantity. Access implies physical, social and economic access to the available food. Utilization considers proper, safe and nutritious use of food. Lastly, stability concerns the temporal dimension of food security capturing current and future disruptions in access to available and adequate food [13].
A primary purpose of setting the definition of food security is to provide a basis for measuring and understanding a magnitude of food security issues, formulating necessary policies, and implementing and monitoring relevant interven tions [14]. Food security measurement progressed over the past half-century. From the 1950s to 1970s, the focus was made on the national supply-side availability of sufficient food for a growing population. This is from the keen awareness of production shocks and food price crises. In the early 1980s, the focus moved to the individuals’ capacity to access food, which better explains a close relationship between food security, poverty and sociopolitical disenfranchisement [14]. Recently, the focus turned to the utilization for proper consumption, nutrition and sanitation with the assured stability of those three dimensions over time [15].
Given the broad scope and dimension of food security, accurately measuring it is inherently difficult. Instead, the global community relies on proxy measures to capture part of food security at a community, national, regional and global level as needed [15]. In addition, a choice among the available indicators entails tradeoffs. Each indicator depicts a different phenomenon of food security, therefore prioritizes different policies that influence initial resource allocations for food security interventions [12, 16]. For example, emphasis on the national food availability prioritizes strategies to increase domestic food supplies such as increasing food imports, accepting more food aids in the short term and improving agricultural production in the longer term. On the other hand, emphasis on food access may support different strategies including controlling food market prices, installing social protection programs such as food ration, and generating employment opportunities [16].
 .
.| Food Security Indicators | PoU | GHI |
|---|---|---|
| Terms used for measurement | Undernourishment | Hunger |
| Elements considered | National food production, export-import trade, loss, waste, other uses | PoU, child* stunting, wasting, mortality |
| Unit expressed | % of population undernourished in calories per capita |
0-100 scale in hunger severity |
| Main purpose | - Comparing food security of countries - Monitoring trends of food security - Targeting and evaluating food security interventions |
|
| Main strength | - Relative easiness to apply - Rich data covering most countries |
- Level of hunger severity - Inclusion of child health components |
| Data source |
FAO, World Bank https://data.worldbank.org/indicator/sn.itk.defc.zs |
IFPRI http://www.ifpri.org/previous-global-hunger-index- ghi-reports |
: Table contents are taken and modified from Pérez-Escamilla et al., 2017 [12] and websites of FAO, World Bank, IFPRI.
*: Children aged under five years.
The PoU and GHI are known more suited to compare a national-level food security and monitor changes over time [12]. The two indicators are summarized in Table 1.
The PoU developed by FAO is readily accessible and periodically published in the State of Food Insecurity report [15]. One particular strength of the PoU is that the databank covers for most of the countries over the past five decades. This makes a standardized time-series comparison of countries achievable. The PoU measures a portion of a population whose dietary energy intake is below the minimum dietary energy requirement. This subgroup of the population is considered undernourished, or a proxy measure of national food insecurity. In doing so, the PoU relies largely on the FAO food balance sheet. The food balance sheet considers food production, trade, waste and loss, livestock feed and seed, and other food utilization in a country. Combination of those elements estimates food calories available per capita and shows a comprehensive pattern of food supply in a country during a reference period [17]. To assess food security, the FAO justifies its focus on dietary calories from the following perspective; severe lack of dietary energy is very unlikely to meet nutritional criteria for maintaining health and physical functions of the population [17].
On the other hand, the GHI developed by IFPRI aggregates four separate components to evaluate hunger: population-level undernourishment, child stunting, child wasting, and child mortality. In a way, the GHI is similar to the PoU but with a greater emphasis on the outcomes of child health and nutrition [15]. It is a 0-100 scoring system in hunger severity, which is classified into five categories: low in severity with scores ≤ 9.9, moderate with 10.0–19.9, serious with 20.0–34.9, alarming with 35.0–49.9 and extremely alarming with ≥50.0. Once countries are classified with their GHI scores, the countries can be compared for their national level of hunger, a proxy measure of national food insecurity [12]. In practice, two extremes, 0 or 100 would not be observed. For instance, the value 0 indicates a country has no undernourished person and no child wasted, stunted, and dead from hunger in the population. One strength of the GHI is that combination of the four components minimizes random measurement errors [12]. Another strength is that the attention to the children under five years could offer insights on the acute and chronic undernutrition in the vulnerable subgroup of the population [18].
2.2. Data Collection
To examine the study hypothesis with these two indicators, data sets of the PoU, GHI and KOICA disbursement are collected from the World Bank, Global Hunger Index Reports and KOICA Annual Statistical Reports, respectively. From the KOICA Annual Statistical Report, which publishes the agency’s annual budget spending, ARD disbursement data are collected for each year and country, sorted and analyzed to identify trends and top recipient countries during the study period. The initially identified top recipient countries are ranked based on (1) their total amount of ARD grants they received and (2) their frequency of appearance as one of the top five recipients; if a country appears at least five times as one of the top five out of 11 years, it is selected for additional analysis. The ARD disbursement profiles of these final select countries are then compared to their PoU and GHI rankings to test the study hypothesis; whether the ARD disbursement ranking of a select country corresponds to the country’s PoU and/or GHI ranking. This comparison can indicate if the Korean agency disbursed its ARD budget by matching the national food insecurity level of its recipient countries.
3. RESULTS
From 2006 through 2016, KOICA’s total budget increased 2.85 times, from USD 193.489 million in 2006 to USD 551.683 million in 2016 (Table 2). However, during the same period, drastic increases are observed in ARD disbursement, 11.3 times increase from USD 7.305 million in 2006 to USD 82.765 million in 2016. This increase in ARD disbursement is also reflected with its % change against the total KOICA budget, from 3.8% in 2006 to 15% in 2016, implying the agency’s progressive emphasis on ARD as a development sector.
In Asia, the absolute amount of KOICA’s ARD disbursement increased from USD 5.607 million in 2006 to USD 41.166 million in 2016 (Table 2). However, the proportion of ARD disbursement in Asia against the total ARD disbursement decreased from 76.8% in 2006 to 49.7% in 2016. This shows the heavy regional concentration on Asia declined while other regions such as Africa gained in ARD disbursement [9]. Nevertheless, Asia dominates with almost 50% of KOICA’s ARD disbursement in 2016 (Table 2).
The ARD disbursement to Asia is further dissected by year, country and ranking. During the study years, the top five countries account for averaged 78.6% of the total Asian ARD disbursement, ranging from 73.2% in 2008 up to 87.6% in 2016 (Table 3). This demonstrates that the ARD disbursement in Asia is highly concentrated and skewed towards a few countries. Furthermore, the top two countries receive almost or over 50% of the total Asian ARD disbursement across all study years. In 2011, one country, the Philippines received nearly half of the total Asian ARD disbursement or 48.7% (Table 3). The Philippines is only distantly followed by Lao PDR with 13.2% in 2011. Overall, (Tables 2 and 3) show KOICA heavily distributed its ARD disbursement to Asia and did to only a few countries in Asia such as the Philippines.
.| Year | 2006 | 2007 | 2008 | 2009 | 2010 | 2011 | 2012 | 2013 | 2014 | 2015 | 2016 |
| Component | |||||||||||
| KOICA Total# | 193.489 | 270.217 | 275.238 | 279.258 | 454.156 | 408.056 | 445.277 | 477.585 | 551.296 | 563.250 | 551.863 |
| ARD Total# | 7.305 | 16.232 | 24.254 | 27.174 | 40.041 | 38.781 | 57.941 | 66.057 | 80.986 | 82.890 | 82.765 |
| ARD percentage § | 3.8 | 6.0 | 8.8 | 9.7 | 8.8 | 9.5 | 13.0 | 13.8 | 14.7 | 14.7 | 15.0 |
| Asia ARD Total# | 5.607 | 7.694 | 12.980 | 13.108 | 18.771 | 20.859 | 27.938 | 28.606 | 35.325 | 33.394 | 41.166 |
| Asia ARD percentage § | 76.8 | 47.4 | 53.5 | 48.2 | 46.9 | 53.8 | 48.2 | 43.3 | 43.6 | 40.3 | 49.7 |
: Data extracted from KOICA Annual Statistical Reports and rearranged for study purpose.
#: KOICA Total-KOICA total ODA disbursement to all recipient countries and all sectors; ARD Total-KOICA disbursement to agricultural-rural development sector to all recipient countries; Asia ARD Total-KOICA disbursement to agricultural-rural development to Asian recipient countries; the Totals are expressed in USD million.
§: ARD percentage-% of KOICA disbursement to agricultural-rural development to all recipient countries compared to KOICA total disbursement to all sectors to all recipient countries; Asia ARD percentage-% of KOICA disbursement to agricultural-rural development in Asia compared to KOICA disbursement to agricultural-rural development in all regions.
.| Year | 2006 | 2007 | 2008 | 2009 | 2010 | 2011 | ||||||
|---|---|---|---|---|---|---|---|---|---|---|---|---|
| Ranking | Country | % | Country | % | Country | % | Country | % | Country | % | Country | % |
| 1 # | Cambodia | 30.8 | Cambodia | 23.7 | Mongolia | 24.0 | Philippines | 38.9 | Philippines | 25.3 | Philippines | 48.7 |
| 2 | Philippines | 29.6 | Lao PDR | 23.3 | Lao PDR | 16.0 | Lao PDR | 14.5 | Lao PDR | 20.3 | Lao PDR | 13.2 |
| 3 | Lao PDR | 9.6 | Mongolia | 17.0 | Cambodia | 13.5 | Mongolia | 14.3 | Cambodia | 11.6 | Myanmar | 5.6 |
| 4 | Myanmar | 5.4 | Philippines | 13.0 | Philippines | 10.4 | Myanmar | 13.2 | Bangladesh | 10.8 | Cambodia | 5.6 |
| 5 | Sri Lanka | 5.4 | Vietnam | 5.3 | Bangladesh | 9.2 | Vietnam | 1.6 | Myanmar | 6.7 | Mongolia | 4.8 |
| % top 5 § | 80.7 | 82.2 | 73.2 | 82.5 | 74.6 | 78.0 | ||||||
| Year | 2012 | 2013 | 2014 | 2015 | 2016 | |||||
|---|---|---|---|---|---|---|---|---|---|---|
| Ranking | Country | % | Country | % | Country | % | Country | % | Country | % |
| 1 # | Philippines | 42.8 | Philippines | 38.8 | Myanmar | 29.0 | Philippines | 27.1 | Myanmar | 30.8 |
| 2 | Mongolia | 11.4 | Myanmar | 14.9 | Philippines | 19.2 | Vietnam | 18.8 | Vietnam | 17.4 |
| 3 | Lao PDR | 9.4 | Afghanistan | 9.7 | Mongolia | 11.4 | Myanmar | 14.4 | Philippines | 16.6 |
| 4 | Cambodia | 8.4 | Mongolia | 7.0 | Vietnam | 10.1 | Cambodia | 8.9 | Cambodia | 11.4 |
| 5 | Myanmar | 6.0 | Indonesia | 4.7 | Cambodia | 6.8 | Lao PDR | 7.4 | Lao PDR | 11.4 |
| % top 5 § | 78.1 | 75.2 | 76.5 | 76.5 | 87.6 | |||||
Data extracted from KOICA Annual Statistical Reports and rearranged for study purpose.
#: A country with largest amount received from KOICA for agricultural-rural development (ARD) is ranked 1. §: % of five countries’ total ARD disbursement against Asian total ARD disbursement as 100%.
| Ranking | Ranking (Accumulated Total Amount #) |
Percentage share of Country § |
Ranking (Total Appearance Frequency ¶) |
|---|---|---|---|
| Country | |||
| Philippines | 1 (69.784 #) | 37.6 § | 1 (11 ¶) |
| Myanmar | 2 (38.137) | 20.5 | 2 (9) |
| Lao PDR | 3 (22.631) | 12.2 | 2 (9) |
| Cambodia | 4 (21.033) | 11.3 | 2 (9) |
| Vietnam | 5 (17.651) | 9.5 | 4 (5) |
| Mongolia | 6 (16.487) | 8.9 | 3 (7) |
| Total for six countries | 185.723 # | 100% | NA ¶ |
Data extracted from KOICA Annual Statistical Reports and rearranged for study purpose.
#: Total amount accumulated for KOICA disbursement granted from 2006 to 2016 in USD million to each country’s agricultural-rural development sector.
§: % of each country’s accumulated total against six-countries’ total as 100%.
¶: Total frequency of appearance as a top-five country in Table 2; NA-Not Applicable.
.| Ranking & Year | Ranking # | Average § | 2006 | 2007 | 2008 | 2009 | 2010 | 2011 | 2012 | 2013 | 2014 | 2015 | 2016 |
|---|---|---|---|---|---|---|---|---|---|---|---|---|---|
| Country | |||||||||||||
| Mongolia | 1 | 21.5 | 29.1 | 26.5 | 24.2 | 22.1 | 20.8 | 19.6 | 18.8 | 18.3 | 18.3 | 19.6 | 18.7 |
| Lao PDR | 2 | 20.2 | 25.7 | 24.5 | 23.6 | 22.0 | 20.7 | 19.2 | 18.3 | 17.4 | 17.0 | 17.1 | 16.6 |
| Cambodia | 3 | 18.0 § | 19.2 | 18.8 | 18.7 | 18.8 | 18.8 | 18.6 | 18.0 | 17.1 | 16.1 | 15.3 | 18.5 |
| Myanmar | 4 | 18.0 § | 28.5 | 25.0 | 21.7 | 19.1 | 16.9 | 15.5 | 14.7 | 14.4 | 14.4 | 16.9 | 10.5 |
| Philippines | 5 | 14.0 | 15.2 | 14.1 | 13.3 | 13.1 | 13.4 | 13.9 | 14.3 | 14.4 | 14.3 | 13.8 | 13.7 |
| Vietnam | 6 | 13.4 | 17.6 | 16.7 | 15.5 | 14.5 | 13.6 | 13.0 | 12.4 | 11.9 | 11.2 | 10.7 | 10.8 |
Data extracted from World Bank and rearranged for study purpose.
#: PoU ranking based on each country’s PoU average from 2006 to 2016, higher average means more severe undernourishment of a country, therefore Mongolia as ranking 1 the most severe in undernourishment.
§: PoU expressed as % of population undernourished, average means averaged % of each country’s PoU from 2006 to 2016, Cambodia has slightly higher PoU than Myanmar as 17.99 vs. 17.96.
The top countries in Table 3 frequently appear as one of the top five as well, excluding Sri Lanka, Bangladesh, Afghanistan and Indonesia. In particular, the Philippines appeared 11 times or in all years (Tables 3 and 4). Myanmar, Lao PDR, and Cambodia appeared nine times each. The Philippines also received the largest total amount, summed in all years (Table 4). However, a high appearance frequency as one of the top countries did not guarantee a proportional increase in ARD disbursement that a country received. Myanmar, Lao PDR, and Cambodia, for instance, appeared with the equal frequency, but their total ARD disbursements greatly varied; Myanmar received 1.81 times more than Cambodia did and Mongolia appeared more frequently than Vietnam, yet the total ARD disbursement allocated to Mongolia was smaller than one to Vietnam (Table 4).
For the select six Asian countries based on the KOICA results above, their PoUs are compared and show an overall decreasing trend (Table 5). The decline in the PoU indicates these countries are gradually improving their status of food insecurity, measured in population-wide undernourishment. Among the six countries, Vietnam and the Philippines were more food-secured with their noticeably lower PoUs than others. Mongolia and Lao PDR were least food-secured with their higher PoUs, averaged 21.5% and 20.2%, respectively (Table 5).
On the other hand, the GHI scores for the six countries do not present a particular trend (Table 6). Each country shows a fluctuation across the years. On average though, Vietnam has the lowest GHI score, indicating it performed better in hunger as well as undernourishment than others (Tables 5 and 6). Lao PDR and Cambodia have the highest GHI scores, indicating a more severe situation with food insecurity. Mongolia, in particular, shows a reversed ranking with the PoU; the country has as low the GHI score as Vietnam whereas Mongolia has the highest PoU (Tables 5 and 6). With the averaged GHI scores, Lao PDR and Cambodia fall into the GHI category ‘serious’ or the scores between 20.0 and 34.9, and the remaining four countries into ‘moderate’ or 10.0-19.9.
The rankings for the averaged PoU and GHI score do not exactly match each other for the six countries. To some extent, their deviation might be expected; the PoU concerns population-wide undernourishment measured in food calories available per capita whereas the GHI pays greater attention to the vulnerable subgroup, children under five years. However, when Mongolia is excluded, five countries show the same order for the averaged PoU and GHI (Fig. 1-1). It indicates that Cambodia, Lao PDR, Myanmar, the Philippines and Vietnam have a very similar situation between population-wide undernourishment and children-emphasized hunger for their national status of food insecurity. But in Mongolia, children under five years may be less likely exposed to or more protected from severe hunger than its general population. Taking this into consideration, ranking reversion is possible.
.| – | Ranking # | Average § | 2006 | 2007 | 2008 | 2009 | 2010 | 2011 | 2012 | 2013 | 2014 | 2015 | 2016 |
|---|---|---|---|---|---|---|---|---|---|---|---|---|---|
| Lao PDR | 1 | 21.9 | 23.8 | 23.2 | 20.6 | 19.0 | 18.9 | 20.2 | 19.7 | 18.7 | 20.1 | 28.5 | 28.1 |
| Cambodia | 2 | 21.8 | 30.7 | 27.6 | 23.2 | 21.2 | 20.9 | 19.9 | 19.6 | 16.8 | 16.1 | 22.6 | 21.7 |
| Myanmar | 3 | 18.4 | 16.2 | 15.8 | 15.0 | 19.6 | 18.8 | 16.3 | NA § | NA | NA | 23.5 | 22.0 |
| Philippines | 4 | 14.6 | 17.6 | 16.2 | 14.0 | 13.2 | 13.0 | 11.5 | 12.2 | 13.2 | 13.1 | 16.9 | 19.9 |
| Mongolia | 5 | 12.7 | 15.8 | 15.3 | 12.1 | 12.9 | 12.8 | 11.4 | 11.7 | 10.1 | 9.6 | 14.7 | 13.8 |
| Vietnam | 6 | 12.6 | 18.4 | 17.7 | 12.6 | 11.9 | 11.5 | 11.2 | 11.2 | 7.7 | 7.5 | 14.4 | 14.5 |
Data extracted from Global Hunger Index Reports and rearranged for study purpose.
#: GHI ranking based on each country’s GHI score average from 2006 to 2016, higher averaged score means more severe hunger of a country, therefore Lao PDR as ranking 1 the most severe in hunger.
§: GHI expressed as 0-100 scale, average means averaged scores of each country’s GHI from 2006 to 2016, NA-not available.
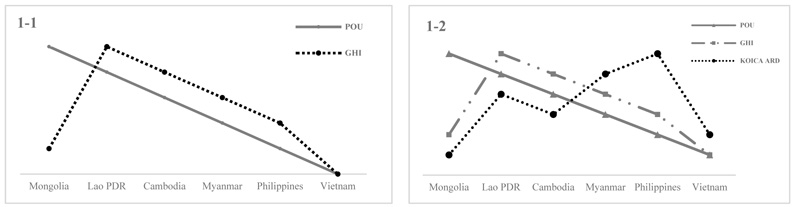
KOICA’s ARD disbursement ranking of its top recipient countries does not show a particular relation with either PoU or GHI (Fig. 1 - 2). For the PoU, Mongolia was the most vulnerable to food insecurity, yet the country received the least amount from KOICA during the study period. The Philippines, on the other hand, received the largest amount while the country performed best with the PoU. For the GHI, the national GHI status of Mongolia and Vietnam rather agree with their KOICA ARD disbursement because this group was the least vulnerable to hunger and received the least amounts, accordingly. Other countries do not show such an agreement. Again, as in the PoU, the Philippines displayed the largest deviation between its hunger status and its KOICA ARD disbursement.
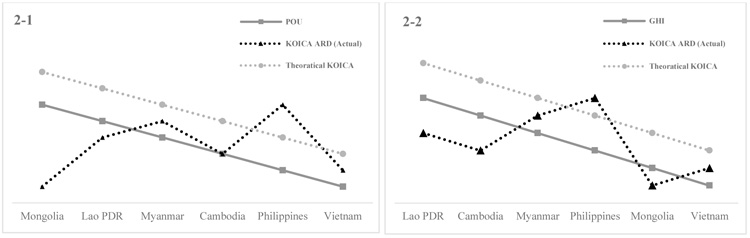
In principle, the least food-secured countries would receive the largest amount of agricultural aid to improve their food insecurity. In KOICA’s case, the theoretical distribution of its ARD grants would resemble (Figs. 2-1 and 2-2); the theoretical ARD disbursement would correspond to the PoU and/or GHI rankings of its recipients.
In practice though, it may be difficult for donors to distribute their ARD ODA budget, matching a food insecurity status of a recipient country. The reasons can vary revolving around a donor’s national interest, the cost-effectiveness of ARD intervention programs, a recipient country’s development policy and other sociopolitical environments among other reasons.
4. DISCUSSION AND CONCLUSION
The main objective of the study is to examine if the amount of the KOICA’s ARD disbursement agrees with the recipient’s food insecurity standing. To achieve the objective, this study compares the KOICA ARD disbursements to the national food insecurity status of the six Asian countries, by using the two proxy measurements: the PoU and GHI scores. In theory, the least food-secured countries would receive the largest amount of agricultural aid to improve their food insecurity.
However, the results of this research indicate that there is little evidence that KOICA disbursed its ARD budget with the matched food insecurity levels of its recipient countries in Asia from 2006 through 2016. During this period, the agency might have funded the ARD intervention projects, not based on the national status of food security, but other indicators. For instance, it might use economic indicators such as gross national production or gross national income as a funding criterion. Or, the agency could have allocated its ARD budget to a country if the country was a priority partner country of Korea. However, the two reasons do not hold; especially for the latter, Myanmar was not even a priority partner country until 2015.
In case that the Korean agency did consider the PoU and GHI scores of those Asian countries, the agency that might have seen the PoU ranging from 13.4% to 21.5% were not largely different, and the two GHI categories ‘moderate’ and serious’ did not significantly differ for its ARD budget allocation.The Korean agency may prefer some countries over others because of cost-efficiency and outcome-effectiveness to run ARD projects. This assessment could come from the agency’s past experience with similar ARD projects. Other possible reasons also include an active request from a recipient country for KOICA’s investment in its agricultural sector; welcoming political environment of a recipient country for ARD programs; status of ARD-relevant infrastructure such as a sound agricultural value chain and market; countries overlooked by other development partners; friendly economic climate of a recipient country for Korean corporations.
Equally likely though, the agency might have funded ARD programs by selecting specific rural areas, regardless of countries. In other words, the agency would fund ARD programs selected at a local community level, not at a national level. Feasible criteria with this type of selection may include a poverty level of the rural community, the number of ARD projects or financial aid from other donors in that community, and willing and conducive local conditions to support ARD projects. Yet, the most likely reason for selecting a project site in a country may be a combination of some of the reasons mentioned.
From the perspective of measuring food insecurity, it is recognized that limitations exist with the two indicators. First, for the PoU, estimating undernourishment operates under the strong assumptions that the distribution of available food calories in the population equals the consumption of food calories and that the level of physical activity is sedentary. Yet, food is lost and wasted before consumption and the rural poor are often engaged in physically demanding activities such as farming. Second, the PoU and GHI do not account for food quality, an important condition for food security. Third, they do not consider a potential bias for an intra-household distribution of food and calories. The distribution bias among household members tends to arise from cultural habits or gender inequality. Fourth, for the GHI, the inclusion of child factors could complicate its interpretation; additional information on child health may not be necessarily associated with food insecurity. For example, it could be a lack of access to healthcare services, sanitation, clean water or proper care and feeding practice [2, 19]. Despite these limitations, they are some of the most widely used tools for their proven strengths [19] that support the validation of using them.
As a limitation of this research, an argument can be made about the time lag between decision-making for the actual ARD budget allocation and published results of the food security indicators. It may take a few years for the Korean agency from formulating a feasible ARD project to implementing the project. Thus, the disbursement may reflect the past needs and food security status of a recipient country. However, use of the total disbursement and averaged PoU and GHI can soothe the time lag in order to examine the overall trends.
Further research is needed to explain in detail how the agency selects its recipients and allocates its ARD budget. As mentioned, it could be based on a project site or community, instead of a country. To examine this assumption, ARD programs need to be systematically dissected based on a specific criterion. Yet, the caveat to adopt this method is that there may be few data sets available at a community level, especially in developing countries. Nevertheless, the results from this type of research offer useful insights onto the ARD disbursement practices and set the stage for further discussions about future ARD ODA policies of Korea.
ETHICS APPROVAL AND CONSENT TO PARTICIPATE
Not applicable.
HUMAN AND ANIMAL RIGHTS
No animals/humans were used for studies that are basis of this research.
CONSENT FOR PUBLICATION
Not applicable.
FUNDING
None.
CONFLICT OF INTEREST
The author declares no conflict of interest, financial or otherwise.
ACKNOWLEDGEMENTS
The author sincerely thanks Haneul Lee for the technical assistance with the initial data collection and sorting at KU Institute for International Development Cooperation at Konkuk University, Seoul, South Korea.

