All published articles of this journal are available on ScienceDirect.

Response of New Cotton Variety (Rassafa) to Nitrogen Fertilizer and Partial Rootzone Drying Drip Irrigation
Abstract
Introduction:
Due to the water shortage and dry Mediterranean condition, determination of water and nitrogen (N) fertilizer requirements is a major challenge for crop production and environment protection. A field experiment was carried out for two consecutive years (2014 and 2015) to evaluate the response of a new cotton variety (cv. Rassafa) to N-fertilizer and drip irrigation.
Explanation:
Treatments consisted of five different N-rates (0, 50, 100, 150, and 200 kg N ha-1), and three irrigation modes: full irrigation (FI), fixed partial rootzone drying irrigation (FPRD80), and alternate partial rootzone drying irrigation (APRD80). They received 100, 80, and 80% of the seasonal water use, respectively. Cotton was irrigated when soil moisture in the specified active root depth was 80% of the field capacity as designated by the neutron probe.
Results:
Results indicated that seed cotton yield (SCY), dry matter (DM), and water productivity (WP) could be optimized at an average N-rate of 140 kg N ha-1, for the tested cotton cultivar, whatever the irrigation mode used. In contrast to APRD80 mode, the findings showed that both FI and FPRD80 modes exhibited a consistence over years, but with an obvious preference of FI in SCY, DM, and WP.
1. INTRODUCTION
Cotton (Gossypium hirsutum L.), as the greatest source of natural fibre, is one of the most valuable crops grown worldwide [1]. Like most major field crops, irrigation and nitrogen (N) fertilization are the most important two factors for improving cotton yield in terms of quantity and quality [2-5]. As these represent the largest inputs in the best management practice for cotton production, the optimum water and N-fertilizer requirements of cotton should be closely evaluated.
Cotton crop management aims to achieve balance between reproductive and vegetative growth. In this aspect, the nitrogen fertilizer plays a key role and could enhance the cotton production by regulating photosynthesis and plant development. However, its poor management has negative effects on plant growth, and therefore, the final yield [6]. Nitrogen deficiency reduces the total biomass and accelerates leaf senescence, resulting in decreases in yield. However, the overdose in N-fertilizer may lead to excess vegetative growth, delay crop maturity, and promote bolls shedding and some diseases damages [5, 7, 8]. Besides, cotton grown in different soil and crop management factors responds differently to application of mineral fertilizers [5, 9]. Therefore, there is a continuous need to select the optimum N application rate for cotton cultivars in ever changing agro-pedo-climatic conditions.
Drip irrigation with fertilizer injection (fertigation practices) on cotton, and other crops, have been combined and proved to improve both yield and quality, and to control uniformity and placement of water and fertilizer applications [2, 3, 10-12]. Moreover, many studies have reported that fixed partial rootzone drying irrigation (FPRD) (also called as, regulated deficit irrigation) and alternate partial rootzone drying irrigation (APRD) were efficient methods to save water. By applying FPRD or APRD, the crop could be exposed to a certain level of water stress affecting the crop yield, but considerable water savings could be attained [4, 13, 14].
Although previous studies have been conducted to evaluate seed cotton yield and water use efficiency (WUE) in response to both FPRD and APRD, still results are argumentative. Some researchers demonstrated that higher yield, and reduced water losses resulting in a higher WUE were observed under APRD compared to full irrigation (FI) [15]. Also, seed cotton yield under APRD was better than that under FPRD when the same water amounts were applied [15, 16]. On the contrary, other studies showed no significant differences in WUE under both FPRD and APRD methods [17]. According to Dagdelen et al. [18], the highest seed cotton yield, dry matter, and WUE were obtained under full irrigation, rather than under deficit conditions. These various results could be related to regions, soil types, and the tested cotton cultivars.
The Rassafa cotton cultivar is a relatively new variety grown in the dry areas of the eastern Mediterranean region. Farmers have targeted the higher seed cotton yield, they assume the greater yields would need augmented N fertilizer and water quantity. So, water and nitrogen fertilizer requirements of this new cultivar need to be quantified and optimized. In this context, as drip irrigation system is flexible enough to water both sides of plant row either simultaneously or alternatively, this study implemented both the regulated FPRD and the APRD through the drip fertigation system. The main objective was to report the effects of different N-levels and drip irrigation modes (FI, FPRD, and APRD) on seed cotton yield, dry matter, reproductive to vegetative ratio, and water productivity. Results may contribute to introduce practical alternatives in the context of sustainable crop production, environment protection, and minimizing production costs.
2. MATERIALS AND METHODS
Field experiments were carried out at the Deir Al-Hajar Agricultural Experiment Station, near Damascus, Syria (33°20′ N, 36°26′ E, altitude 600 m), for two consecutive growing seasons 2014 and 2015. The site is located within a dry region. The total annual rainfall is about 120 mm. Some climatic data collected during the course of these experiments are shown in Table 1. Climatic data in both growing seasons were somewhat close to the average of the last 10 years (data not shown). Hence, two years seemed fairly adequate.
| Season | Variable | Apr | May | Jun | Jul | Aug | Sep | Oct |
|---|---|---|---|---|---|---|---|---|
| 2014 | Tmax (0C) | 28.4 | 30.6 | 34.3 | 36.7 | 37.3 | 32.8 | 28.0 |
| Tmin (0C) | 10.4 | 14.2 | 17.3 | 18.7 | 19.8 | 17.7 | 12.3 | |
| Taverage (0C) | 20.0 | 22.5 | 26.4 | 29.3 | 27.2 | 24.5 | 20.0 | |
| RH (%) | 60.0 | 59.0 | 56.0 | 65.0 | 65.0 | 67.6 | 72.0 | |
| Rainfall (mm) | 0.0 | 26.0 | 0.0 | 0.0 | 0.0 | 0.0 | 12.2 | |
| 2015 | Tmax (0C) | 23.1 | 31.7 | 30.8 | 38.3 | 38.7 | 35.6 | 29.7 |
| Tmin (0C) | 9.0 | 14.2 | 16.4 | 19.3 | 20.8 | 19.4 | 14.9 | |
| Taverage (0C) | 17.6 | 24.6 | 25.8 | 28.5 | 29.7 | 28.3 | 22.3 | |
| RH (%) | 67.0 | 66.0 | 69.0 | 62.0 | 59.0 | 56.0 | 72.0 | |
| Rainfall (mm) | 11.8 | 0.0 | 0.0 | 0.0 | 0.0 | 0.0 | 5.9 |
Representative soil samples were taken to a depth of 60 cm in 15 cm increments prior to planting. Throughout the 0.6-m soil profile, the soil is classified as a clay loam, with an average 27.8% sand, 42.7% silt and 29.5% clay. Average volumetric soil water contents at field capacity and wilting point are 0.38 and 0.18 m3 m-3, respectively. Soil bulk density was 1.20 g cm-3. Other chemical soil properties were: pH 8.0; ECe 0.58 ds m-1; and organic matter <1%.
At the end of March, the experimental site was ploughed to a depth of 0.35 m with a mouldboard plough. Experimental units (plots), each of 15×3.75 m, were prepared. A minimum spacing of 2.0 m was maintained between plots to minimize water intervention among treatments. Cotton seeds (Gossypium hirsutum L.) of a new cotton variety called Rassafa were planted on 22 and 26 April in 2014 and 2015, respectively. Each plot had 5 crop rows, which were spaced 0.75 m apart and 0.2 m between holes giving about 67000 holes ha-1. After establishment, plants were hand-thinned to one plant per hole.
The experiment was laid out as a 5×3 factorial experiment arranged in a randomized complete block design (RCB design). Treatments consist of five nitrogen fertilizer rates (N), and three drip irrigation modes, with three replications, making a total of 45 plots. The N-fertilizer rates composed of N0, N50, N100, N150, and N200 which correspond to 0, 50, 100, 150, and 200 kg N ha-1 respectively. Urea 46% solution was used as a source of N-fertilizer, and was injected through the drip system every third irrigation in four equally split applications. The three distinct irrigation modes were: full irrigation (FI). The second one is fixed partial rootzone drying irrigation (FPRD80), in which both sides of plant row watered. The third one is the alternate partial rootzone irrigation (APRD80), where both sides of plant row alternatively watered. In the full irrigation treatment, plants received 100% of the cumulative crop evapotranspiration (ETc), i.e., the depleted water amount between two successive irrigation events, so that the humidity in the root zone was replenished to the field capacity. While in both FPRD80 and APRD80 irrigation modes, plants were irrigated at the same frequency as FI treatment, but with water amounts equal to 80% of that applied for the FI treatment.
One lateral dripline was used for one crop row, giving five laterals per plots for both FI and FPRD80 treatments. While six laterals were used in the APRD80 treatment; for each irrigation event only three out of the six driplines were under operation to apply water to only one side of the root mass; in the next irrigation the other three driplines were put on. The lateral dripline (16-mm inside diameter) with a build-in 0.40-m emitter spacing and a nominal flow rate of 4 L h-1 at an operating pressure of 1 bar (100 kPa) was used. The drip irrigation systems were installed on the appropriate experimental units after all the cultivation processes were completed. Volumes of applied irrigation water amounts were measured by inline flow meters. Irrigation was scheduled based on the soil water content measurements using neutron scattering technique. One neutron probe access-tube was installed in each experimental unit at 0.12 m from the lateral dripline. This permitted the monitoring of soil water content and provided feedback data for the irrigation scheduling. Irrigation was initiated immediately after planting for both growing seasons. For irrigation scheduling purposes, the active roots depths were 0.30 m from the beginning until peak flowering, and 0.60 m from fruit setting till termination [2, 15]. Cotton was irrigated when the soil water content in the concerned layer reached 80% of the field capacity.
In each growing season, six plants per sample wer e collected from each plot at physiological maturity stage. Plants were separated immediately into stems, leaves and fruiting forms (reproductive parts). Then reproductive and vegetative ratios (RVR) were calculated. Dry matter yield (DM) was obtained as the total dry weight of all aboveground parts (seed cotton yield was not included). At maturity, the seed cotton yield was determined by two hand pickings. The first one was in early October, and the second one was about two weeks later for both growing seasons. Total seed cotton yield was the summation of both pickings.
Cotton evapotranspiration (ETc) was calculated using the water balance equation:
 |
(1) |
where I is the amount of irrigation water applied (mm), P is the precipitation (mm), Dp is the deep percolation (mm), and Ro is the amount of runoff (mm), Δ(SWC) is the change in soil water content (mm) in the specified soil profile, as measured by the neutron probe technique. Since the amount of irrigation water was controlled, runoff was assumed to be zero. Observing SWC showed that the deep percolation was negligible below 0.60 m in depth. Precipitation was also negligible during both growing seasons (Table 1). Since the field application efficiency of drip irrigation system was about 97%, the ETc was very close to the volumes of applied water amounts.
Field water productivity (also known as water use efficiency, which is the relationship between crop yield and seasonal evapotranspiration (ETc)) was calculated for seed cotton yield (WPy), and for dry matter yield (aboveground biomass without seed cotton yield) (WPd) using equations (1) and (2), respectively. They were expressed as kg per m3 of water [19].
 |
(2) |
 |
(3) |
The measured variables, i.e., seed cotton yield (SCY), dry matter yield (DM), RVR, and water productivities (WPy and WPd) were subjected to a two-way analysis of variance using the DSAASTAT add-in version 2011 [20]. A combined analysis of data over both years was performed to identify irrigation mode and N-rate managements whose average effect over years is stable and high [21]. Mean comparison was made only for data after combined analysis. With quantitative factors, Gomez and Gomez [21] mentioned that “the types of mean comparison that focus on the specific treatments tested are not adequate”. Hence, a more appropriate approach is the trend comparison (regression analysis) to examine the functional relationship between crop responses (measured variables) and the quantitative factor (N fertilizer levels), that covers the whole range of tested N-levels. One very important feature of trend comparison is that it can describe the change in crop responses for every change in the level of N applied. Data was presented and illustrated according to the rules described by Gomez and Gomez [21].
3. RESULTS AND DISCUSSIONS
Although the mean values of the measured climatic parameters were identical between both years in the studied site Table 1, relative differences were observed between the individual observations measured during the vegetative (April-June) and reproductive (July-September) phonological stages of 2014 relative to 2015. During the vegetative period, maximum (Tmax), minimum (Tmin), overall average temperatures (Taverage), that plants were exposed to in 2014 were on average 9.0, 5.8, and 1.3% warmer than in 2015. Concerning the relative air humidity (RH), the air was also 13.4% drier in 2014 than in 2015. However, during the reproductive period, the Tmax, Tmin, and Taverage in 2014 were on average 5.2, 5.5, and 6.4% cooler than in 2015; and the air was 11.6% more humid in 2014 than in 2015.
The effects of years, N-fertilizer rates, and irrigation modes on the measured variables, (SCY, DM, RVR, WPy, and WPd) were analyzed and are summarized in Table 2.
| Source of Variance | df | SCY | DM | RVR | WPy | WPd |
|---|---|---|---|---|---|---|
| 2014 | ||||||
| N-fertilizer rates (N) | 4 | 7.53** | 4.69** | 1.57 ns | 7.44** | 4.52** |
| Irrigation methods (I) | 2 | 81.15** | 46.08** | 1.91 ns | 5.67** | 17.52** |
| N × I | 8 | 1.46 ns | 3.19* | 1.55 ns | 1.52 ns | 2.97* |
| Error | 28 | |||||
| CV (%) | 8.0 | 21.8 | 27.7 | 8.2 | 22.2 | |
| 2015 | ||||||
| N-fertilizer rates (N) | 4 | 0.96 ns | 3.16* | 7.86** | 0.83 ns | 2.81* |
| Irrigation methods (I) | 2 | 59.51** | 25.1** | 8.36** | 22.8** | 5.91** |
| N × I | 8 | 2.93* | 3.06* | 5.03** | 2.74* | 2.66* |
| Error | 28 | |||||
| CV (%) | 18.0 | 23.3 | 15.2 | 18.2 | 24.9 | |
| Combined analysis 2014-2015 | ||||||
| N-fertilizer rates (N) | 4 | 36.04** | 47.6** | 27.03** | 9.17* | 20.78** |
| Irrigation methods (I) | 2 | 7.93 ns | 85.5* | 0.55 ns | 2.21 ns | 13.22 ns |
| Interactions | ||||||
| N × I | 8 | 0.64 ns | 1.94 ns | 0.49 ns | 0.54 ns | 2.00 ns |
| Year × N | 4 | 0.11 ns | 0.16 ns | 0.23 ns | 0.43 ns | 0.33 ns |
| Year × I | 2 | 14.12** | 0.80 ns | 4.62 * | 11.98 ** | 1.62 ns |
| Year × N × I | 8 | 3.27 ns | 2.12 ns | 3.28 ns | 3.23 ns | 1.87 ns |
| Pooled error | 56 | |||||
| CV (%) | 14.0 | 22.6 | 21.9 | 13.6 | 23.5 |
3.1. Seed Cotton Yield (SCY)
Seed cotton yield (SCY) was affected by both N-rates and irrigation modes in 2014; while in 2015 seed cotton yield was affected only by irrigation modes and the irrigation × fertilizer interaction (Table 2). However, the combined analysis over years, which is more important, indicated that SCY was highly affected by N-rates and by the year × irrigation interaction.
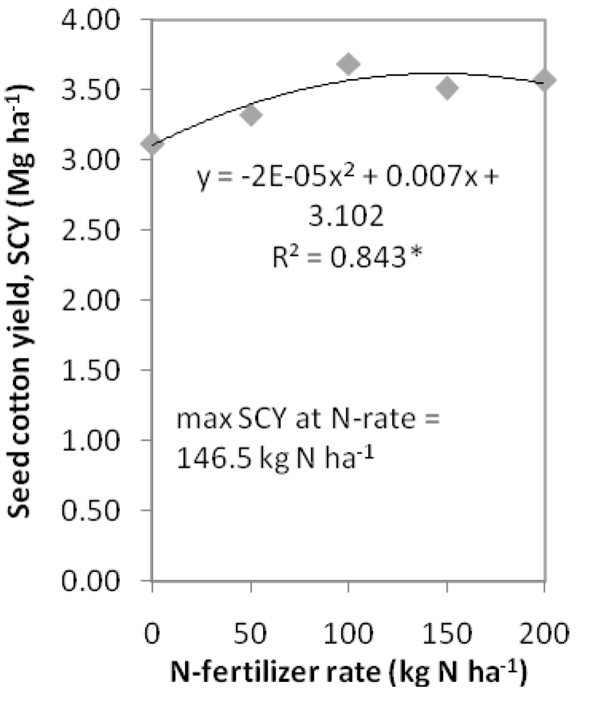
As none of the interaction effects involving N-rates was significant, data of N-rates was averaged over years and all levels of irrigation. As N fertilizer level is a quantitative factor, the trend comparison was used instead of the mean comparison that focuses on the specific nitrogen levels tested [21]. As can be seen in Fig. (1), trend analysis mentioned that the relationship between seed cotton yield and N-fertilizer rates was quadratic within the range of nitrogen rates tested (R2=0.843 with p<0.05). From this regression equation, the maximal seed cotton yield could be obtained at a certain rate of nitrogen fertilizer (146.5 kg N ha-1), which represents an optimal N-rate whatever the irrigation mode used under the given circumstances. The results are in agreement with similar results obtained by Janat [22]. Similar results were also obtained by Abdel-Malak et al. [23] when N was applied at 190 kg ha−1. Sarwar et al. [24] and Saleem et al. [25] stated that cotton yield was higher when N was applied at a rate of 120 kg ha−1. Sawan [26] found that highest yield was associated with a high rate of 161 kg ha-1 of applied N. These moderate to high N-levels confirm that nitrogen is an important nutrient controlling crop growth and production.
On the other hand, the interaction between irrigation modes and years was highly significant but the average irrigation effect was not (Table 2). Upon examination of the mean difference between years for each irrigation mode (Table 3), FI treatment had higher SCY in the second year (2015) than in the first one (2014); FPRD80 treatment gave similar yields in both years; and APRD80 treatment performed worse in the second year (2015) than in the first one (2014). This might be attributed to the differences in climatic data among both years, which indicated that the tested crop was affected by the environmental conditions between years under APRD80 system. Thus, both FI and FPRD80 modes are recommended whatever the N-rate applied: FI gave the highest mean yield of about 4500 kg ha-1, and FPRD80 exhibited a high degree of consistency over both years. Dagdelen et al. [18] reported similar results that the highest seed cotton yield was obtained under full irrigation rather than under deficit conditions. Basal et al. [4] reported that seed cotton yields increased as the irrigation levels increased.
3.2. Dry Matter Production and Distribution
Dry matter yield was affected by both N-fertilization and irrigation modes and by their interaction in both years (Table 2). However, the combined analysis of data over years confirmed the main effects of both factors on dry matter yield (DM), but none of the interactions were significant at the 5% level. Thus, it is acceptable to average each factor data over all levels of other factors (Fig. 2).

Regression analysis designated that the response of dry matter yield to various nitrogen rates followed also a quadratic relationship (R2=0.975 with p<0.01), as can be seen in Fig. (2A). Dry matter yield increased with increasing N-rates till a certain point, after that a decrease in DM was predicted. Thus, dry matter yield could be maximized whatever the irrigation mode used in this study, when an optimal rate of nitrogen fertilizer was added to the soil. The optimal rate was 135 kg N ha-1, and was close to its homologue estimated for SCY (146.5 kg N ha-1). Sawan [26] found significant effects on growth and dry matter yield of cotton when a high N-level of 161 kg ha−1 was applied compared to 107 kg ha−1. These results are in agreement with the fact that nitrogen is a fundamental nutrient for the total dry matter production.
Concerning irrigation modes, DM yield increased significantly under FI treatment relative to both FPRD80 and APRD80 treatments (Fig. 2B). The mean values were 12.74, 7.75, and 7.00 Mg ha-1, respectively. That is to say, an increase of 65 and 82% in DM could be attained when cotton crop was under full irrigation. Several studied reported similar results that dry matter yield was maximized under full irrigation rather than under deficit conditions [18].
To identify the effect of different nitrogen fertilizer rates on dry matter distributing into various plant tissues, the reproductive and vegetative ratios (RVR, kg kg-1) were calculated and analyzed. The ANOVA showed that RVR was significantly affected by both N-rates and irrigation modes and by their interaction in 2015; but it was not in 2014 (Table 2). However, the pooled analysis of data over years revealed that the main effects of N-rates on the RV ratio were highly significant at the 1% level. Moreover, these ratios were significantly affected by the year × irrigation interaction (p<0.05) (Table 2).
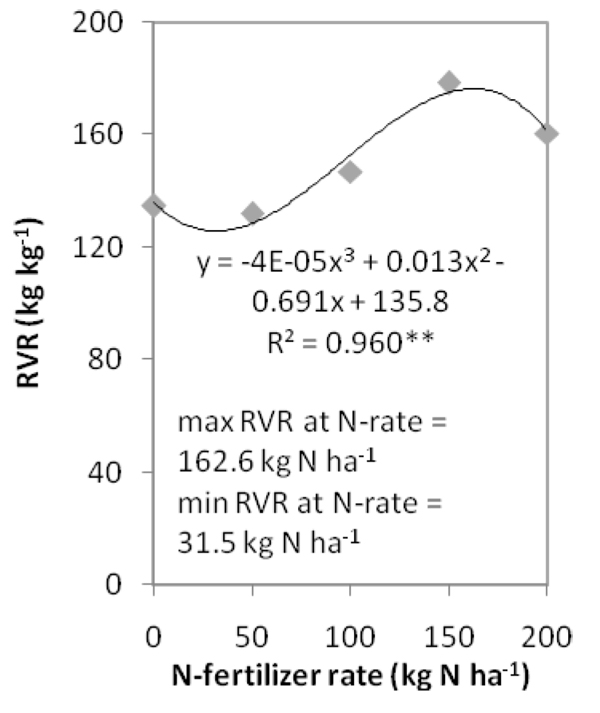
Trend analysis indicated that the response of RVR to N-rates was cubic within the range of N-rates tested (R2=0.960 with p<0.01) Fig. (3). As can be demonstrated, two distinguished N-rates could be observed. The first one corresponded to the worst rate (31.5 kg N ha-1), at which the RV ratio could be minimized. The second one corresponded to the optimal rate (162.6 kg N ha-1), at which the RVR could be maximized. This optimal rate was comparable to those found for both DM and SCY.
As the year × irrigation interaction effect was significant, the response of RVR to irrigation modes varied from year to year, and was not affected by the average irrigation effect. The mean difference between both years for each irrigation mode was examined and shown in Table 3. It indicated that in contrast to APRD80 mode, both FI and FPRD80 modes had higher RV ratios in the second year (2015) than in 2014. This could be explained by the fact that the reproductive period was more wormer in 2015 than in 2014. However, full irrigation (FI) stimulated this cotton cultivar to recruit more dry matter into the reproductive forms (about 162 kg kg-1) than fixed partial rootzone drying irrigation (FPRD80) (144 kg kg-1).
| Irrigation Modes | 2014 | 2015 | Av. | Difference |
|---|---|---|---|---|
| SCY (kg ha-1) | ||||
| FI | 4166.3 | 4827.0 | 4496.7 | 660.8 |
| FPRD80 | 3048.9 | 3133.4 | 3091.1 | 84.5 |
| APRD80 | 3068.3 | 2412.1 | 2740.2 | -656.3 |
| RVR (kg kg-1) | ||||
| FI | 150.2 | 173.0 | 161.61 | 22.7 |
| FPRD80 | 128.6 | 158.8 | 143.68 | 30.2 |
| APRD80 | 155.6 | 137.8 | 146.70 | -17.9 |
| WPy (kg m-3) | ||||
| FI | 0.584 | 0.593 | 0.588 | 0.009 |
| FPRD80 | 0.533 | 0.492 | 0.513 | -0.041 |
| APRD80 | 0.539 | 0.375 | 0.457 | -0.164 |
3.3. Irrigation Water Applied and Water Productivity (WPy and WPd)
Cotton plants received 38 and 17.7 mm of rain in 2014 and 2015, respectively (Table 1). These amounts could be neglected compared to those applied by irrigation. Due to the relative differences between both years concerning climatic conditions in vegetative and reproductive periods, different amounts of irrigation water were applied. It was on average 13% larger in 2015 than in 2014 whatever the irrigation mode used. The irrigation water applied to FI, FPRD80, and APRD80 were, 7133, 5720, and 5690 in 2014, and 8143, 6366, and 6438 m3 ha-1 in 2015, respectively.
The analysis of variance revealed that water productivity (WPy) was significantly influenced by both N-rates and irrigation modes in 2014; while in 2015 it was affected by irrigation modes and its interaction with N-rates. However, the combined analysis of data over years detected that WPy was significantly affected by N-rates (p<0.05), and by the year × irrigation interaction effect (p<0.01) (Table 2).
As none of the interaction effects involving N-rates in the pooled analysis were significant, the data of N-rates was averaged over years and all modes of irrigation. As for seed cotton yield, trend analysis showed that the relationship between WPy and nitrogen fertilizer rates was quadratic within the range of N-rates tested (R2=0.810 with p<0.05) (Fig. 4). The optimal WPy could be attained at the same optimal N-rate corresponding to the maximum seed cotton yield, which was found to be 146.5 kg N ha-1.

As the year × irrigation interaction effect was highly significant, an average effect of irrigation could not be obtained (Table 2). The mean difference between years for each irrigation mode was examined (Table 3). FI treatment had the highest averaged WPy of about 0.588 kg m-3, and exhibited a high degree of consistency over both years. Also, FPRD80 treatment displayed a degree of consistency over years, with an average of 0.513 kg m-3. However, APRD80 did not perform well. WPy under APRD80 was very close to that in FPRD80 treatment in 2014, but it was lesser in the second year. It appears that WPy under APRD80 mode was greatly affected by environmental conditions between years, compared to the other modes of irrigation.
Concerning water productivity for dry matter (WPd), both fertilization and irrigation factors and their interaction in both years significantly affected this variable. Nevertheless, the combined analysis over years confirmed only the main effects of N-rates at the 1% level, and none of the interactions were significant at the 5% level (Table 2).
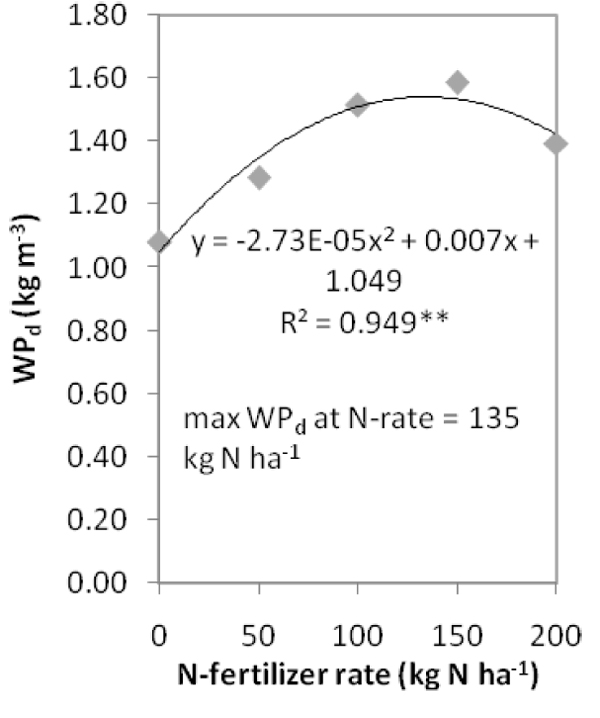
As for dry matter yield, regression analysis indicated that the relationship between WPd and nitrogen rates was quadratic within the range of N-rates tested (R2=0.949 with p<0.01). At the same optimal N-rate corresponding to the maximum DM yield (135 kg N ha-1), WPd could be optimized (Fig. 5).
CONCLUSION
The following conclusions can be obtained from the agro-pedo-climatic context of the experiments:
- The tested cotton crop cultivar was found to be responsive to the nitrogen fertilizer and drip irrigation modes.
- Seed cotton and dry matter yields, and water productivity could be maximized at an optimal nitrogen applied amount of about 140 kg N ha-1.
- Results suggested that yield, reproductive to vegetative ratio, and water productivity were influenced by environmental conditions between years under the alternate partial root-zone drying irrigation.
- Both full and fixed partial rootzone drying irrigation modes performed consistently over years, but yields and water productivity were found to be higher under full irrigation.
LIST OF ABBREVIATIONS
| APRD | Alternate Partial Rootzone Drying Irrigation |
| DM | Dry Matter Yield |
| FI | Full Irrigation |
| FPRD | Fixed Partial Rootzone Drying Irrigation |
| N | Nitrogen |
| RVR | Reproductive And Vegetative Ratio |
| SCY | Seed Cotton Yield |
| WP | Water Productivity |
CONSENT FOR PUBLICATION
Not applicable.
CONFLICT OF INTEREST
The authors declare no conflict of interest, financial or otherwise.
ACKNOWLEDGEMENTS
The authors would like to thank the Atomic Energy Commission of Syria for the financial support.

